

Abstract
Nine human tumour cell lines (four mammary, one bladder, two prostate, one cervical, and one squamous cell carcinoma) were studied as to whether cellular radiosensitivity is related to the number of initial or residual double-strand breaks (dsb). Cellular sensitivity was measured by colony assay and dsb by means of constant- and graded-field gel electrophoresis (CFGE and GFGE, respectively). The nine tumour cell lines showed a broad variation in cellular sensitivity (SF2 0.17–0.63). The number of initial dsb as measured by GFGE ranged between 14 and 27 dsb/Gy/diploid DNA content. In contrast, normal fibroblasts raised from skin biopsies of seven individuals showed only a marginal variation with 18–20 dsb/Gy/diploid DNA content. For eight of the nine tumour cell lines, there was a significant correlation between the number of initial dsb and the cellular radiosensitivity. The tumour cells showed a broad variation in the amount of dsb measured 24 h after irradiation by CFGE, which, however, was not correlated with the cellular sensitivity. This residual damage was found to be influenced not only by the actual number of residual dsb, but also by apoptosis and cell cycle progression which had impact on CFGE measurements. Some cell line strains were able to proliferate even after exposure to 150 Gy while others were found to degrade their DNA. Our results suggest that for tumour cells, in contrast to normal cells, the variation in sensitivity is mainly determined by differences in the initial number of dsb induced.
Keywords: tumour, MCF-7, RT112, Du145, LNCaP, T47D, HeLa, DSB, graded-field gel electrophoresis
Cancer cells exhibit characteristics that distinguish them from their normal counterparts. Three cellular functions tend to be inappropriately regulated in a neoplasm. First, the normal constraints on cellular proliferation are relaxed. Second, differentiation can be distorted. Third, chromosomal and genetic organisation may be destabilised such that variant cells arise with high frequency. All those factors do not only determine the growth and malignant characteristics of the tumour but also their responsiveness to radiation. This ‘intrinsic’ radiosensitivity differs largely between tumour types and is at least partly due to the different sensitivity of the respective tumour cells Deacon et al, 1984; Fertil and Malaise, 1985). It was further shown that within one type of tumours, the outcome of the individual patients after radiotherapy was reflected by the in vitro radiosensitivity (SF2) of their tumour cells (West et al, 1993, 1995; Stausbol-Gron and Overgaard, 1999; Björk-Eriksson et al, 2000).
It is generally accepted that among the DNA damage induced mainly double-strand breaks (dsb) (Bryant, 1984; Ward, 1988; Wurm et al, 1994; Dikomey et al, 1998; Pfeiffer et al, 2000), and particularly residual dsb (Dikomey et al, 1998, 2000) are responsible for cell killing by ionising radiation. The number of residual dsb depends on both, the number of dsb induced and on the respective repair capacity. In normal cells, no variation was found for the number of induced dsb (Dikomey et al, 1998, 2000), illustrating that differences are only due to variations in the repair capacity.
This picture appears to be much more complex and even contradictory for tumour cells. 11 out of 13 studies reported on a variation in the number of induced dsb (Kelland et al, 1988; Schwartz et al, 1988, 1990, 1991; McMillan et al, 1990; Giaccia et al, 1992; Olive et al, 1994; Ruiz de Almodovar et al, 1994; Zaffaroni et al, 1994; McKay and Kefford, 1995; Whitaker et al, 1995; Woudstra et al, 1998; Eastham et al, 2001), but only three found a correlation with cell killing (McMillan et al, 1990; Ruiz de Almodovar et al, 1994; Whitaker et al, 1995). In repair studies, a correlation between cell killing and the number of dsb was only found after short repair intervals (up to 2 h) (Schwartz et al, 1988, 1990; Giaccia et al, 1992; Zaffaroni et al, 1994), but never for nonreparable dsb.
These heterogeneous results may be partly explained by the techniques used (see also McMillan et al, 2001). Several studies raised doubts as to whether neutral filter elution exclusively detects dsb (Hutchinson, 1989; Okayasu and Iliakis, 1989; Wlodek and Olive, 1990). Pulsed-field gel electrophoresis (PFGE), currently most widely used, has the advantage to resolve large DNA fragments according to the molecular size permitting, in principle, a direct quantification of dsb. However, the accurate analysis of the profile of the continuous fragment distribution is not trivial (Ager et al, 1990; Kraxenberger et al, 1994; Cedervall et al, 1995). In addition, PFGE could be complicated by paradoxical migration patterns (Carle et al, 1986; Chu, 1991; Löbrich et al, 1993). Therefore, PFGE and constant-field gel electrophoresis (CFGE) are preferably used to quantify only the fraction of DNA fragments released (FDR) from the bulk DNA (Blöcher et al, 1989; Stamato and Denko, 1990; Iliakis et al, 1991a, 1991b). All three methods are sensitive to replication (Okayasu et al, 1988; Stamato and Denko, 1990; Iliakis et al, 1991a, 1991b; Dahm-Daphi and Dikomey, 1995), which might be important for continuously proliferating tumour cells.
To this end, we introduced a modification of the standard electrophoresis termed ‘graded-field gel electrophoresis’ (GFGE) (Dahm-Daphi and Dikomey, 1995, 1996; Zhou et al, 1997a, 1997b). GFGE operates at stepwise increased electric field strength resulting in distinct bands that contain fragments of different molecular weights. The analysis then permits direct calculation of the number of dsb independent of the cell cycle distribution.
Here we applied the GFGE to determine the number of dsb induced in nine tumour cell lines and for control in seven normal fibroblast lines and compared it with the respective data obtained by CFGE. We further measured the kinetics of dsb repair and the residual damage 24 h after irradiation in order to clarify, whether dsb critically determine tumour cell survival.
MATERIALS AND METHODS
Cell lines and culture conditions
The LNCaP and DU145 cell lines were originally isolated from metastatic lesions of patients suffering from prostate cancer (Stone et al, 1978; Horoszewicz et al, 1983) and purchased from DSMZ (Braunschweig, Germany) as American Type Culture Collection (ATCC) cell lines. HeLa cells were derived from a cervical carcinoma (Scherer et al, 1953) obtained from Dr Aubee. The T47D-B8 and MCF-7 cell lines descended from human breast carcinomas (Soule et al, 1973; Soto et al, 1986; Ruiz de Almodovar et al, 1994). The MCF-7 subclones BB and Bus were described to differ from MCF-7 parental cells with respect to dsb induction and repair, p53 status, cell cycle and apoptosis (Nunez et al, 1995; Siles et al, 1995). These cells as well as the RT112 bladder carcinoma cell line (Masters et al, 1986) were gifted by Dr Ruiz de Almodevar. SCC4451 cells were established from a squamous cell carcinoma of the head and neck obtained from Dr Zölzer (Zölzer et al, 1995). All cells were either grown in RMPI 1640 or DMEM (Life Science Technology/BRL, Karlsruhe, Germany) supplemented with 10% FCS and penicillin/streptomycin in 5% CO2.
Fibroblast cells, HF-1, -2, -7, -8, -46, -60 and HF, were established from punch biopsies as described elsewhere (Borgmann et al, 2002). CHO cells were kept in α-MEM medium. The experiments were performed with nearly confluent tumour cells and confluent fibroblasts.
Clonogenic cell survival
Tumour cell survival was assessed by colony formation assay. Near-confluent cultures were X-irradiated at 220 kVp, at a dose-rate of 2 Gy min−1. Irradiated cells were immediately plated and grown for 2–3 weeks with one medium change. Stained colonies of more than 50 cells were counted. Experiments were repeated thrice with three replicates each.
Constant-field gel electrophoresis
Subconfluent cells were suspended (3 × 10⁶ ml in 0.8% low melting point agarose (Bio-Rad, Munich, Germany) and pipetted into 180 μl plug moulds to solidify (Dahm-Daphi and Dikomey, 1995). Those agarose plugs were irradiated on ice to prevent DNA repair during irradiation and thereafter directly subjected to cell lysis (0.4 M EDTA, 2% N-lauryl sarcosine, and 1 mg ml−1 proteinase K, all Sigma, Deisenhofen, Germany). Lysis was started on ice for 30 min and continued at 37°C overnight. The plugs were washed thrice with Tris-EDTA buffer and sliced into pieces containing about 105 cells, which were inserted into a 14 × 20 cm 0.8% agarose gel (High-grade ultrapure, Bio-Rad). The gel was then covered with a thin overlayer of 0.8% agarose to avoid light fraction artefacts upon optical imaging. Electrophoresis was performed at 0.6 V cm−1 for 30 h in 0.5 × TBE buffer (45 mM Tris base, 45 mM boric acid, 2 mM EDTA) in a conventional apparatus (Subcell, Bio-Rad). The gel was then stained overnight (0.5 μg ml−1 ethidium bromide), destained overnight in ddH2O and CCD camera (Sony XC-75CE) equipped with an image analysis system (Optimas, Silverspring, MD, USA) was used to quantify the FDR.
Graded-field gel electrophoresis
Cells were treated as before but electrophoresis was performed differently. Running conditions were now 0.6 V cm−1 for 30 h followed by 1.5 V cm−1 for 6 h. Compared to the regimen published previously (Dahm-Daphi and Dikomey, 1995) the present protocol was restricted to two different field strengths sufficient for the current purpose. Detailed analysis and mathematics were described elsewhere (Dahm-Daphi and Dikomey, 1995). In principle, analysis was based on an equation given by Blöcher (1990) describing the sigmoid curve of the total FDR obtained by PFGE. Here, the total FDR corresponds to the sum of the FDR of the two bands (GFGE at 0.6 and 1.5 V cm−1, Figure 2). The curves of total FDR and FDR at 1.5 V cm−1 were both sigmoid (Figure 4) and could, hence, be fitted by the equation described by Blöcher (1990). The third curve (band 1) corresponds to the difference between both fits. The χ2 fits were calculated simultaneously and gave the number of dsb in unirradiated cells, of dsb induced per DNA-unit, the maximum DNA fragment size in each band and the factor of retention (fret).
Figure 2.

Constant- and graded-field gel electrophoresis, CFGE (upper) and GFGE (lower). CFGE was run at 0.6 V cm−1 for 30 h and GFGE at two field strengths of 0.6 V cm−1 for 30 h followed by 1.5 V cm−1 for 6 h. The fluorescence intensity of each band in each lane was recorded by a CCD video camera.
Figure 4.

Induction of dsb measured by GFGE. Cells were irradiated on ice with doses up to 140 Gy immediately followed by the measurement of dsb by GFGE. GFGE was run for nine tumour and seven primary fibroblast strains. For each cell line, the FDR of band 1 (circles), band 2 (triangles) and the sum of both (squares) were commonly fitted by nonlinear regression (see text and Dahm-Daphi and Dikomey, 1995).
Cell cycle analysis
Cell cycle distribution of PI-stained cells was determined by flow cytometry in an FACScan (Becton Dickenson, Heidelberg, Germany).
Statistics
Each experiment was repeated three times and the data were given as a mean with its standard error (±s.e.m.). Statistical analysis, data fitting and graphics were performed by means of the Prism 3.1 computer program (GraphPad Software, San Diego, USA).
RESULTS
The nine tumour cell lines showed a wide range of radiosensitivity (Figure 1). The SF2, the linear-quadratic parameters α and β and the mean inactivation dose, Dbar (Fertil et al, 1984), were calculated (Table 1). The Dbar of the most radiosensitive cell line (LNCaP) was 2.9 times lower as compared to the most radioresistant strain (RT112).
Figure 1.

Cellular radiosensitivity of human tumour cell lines. Cell survival was determined by means of colony formation assay. Data were fitted to the linear-quadratic equation −ln(S/S0)=αD+βD2 where S is the surviving fraction, S0 the plating efficiency of unirradiated cells and D the X-ray dose.
Table 1. Parameters of cellular radiosensitivity and cell cycle distribution.
|
0 Gy |
150 Gy |
|||||||||
|---|---|---|---|---|---|---|---|---|---|---|
| Cell lines | SF2a | α (Gy−1)b | β (Gy−2)b | Dbar (Gy)c | Gd1 | S | G2/M | G1 | S | G2/M |
| RT112 | 0.62±0.02 | 0.18±0.06 | 0.028±0.007 | 3.2±0.5 | 55 | 33 | 13 | 43 | 54 | 2 |
| DU145 | 0.63±0.05 | 0.12±0.02 | 0.055±0.005 | 2.85±0.3 | 54 | 36 | 10 | 47 | 44 | 9 |
| SSC4451 | 0.41±0.07 | 0.38±0.15 | 0.032±0.018 | 2.04±0.5 | 80 | 11 | 9 | 83 | 10 | 7 |
| HeLa | 0.43±0.03 | 0.33±0.06 | 0.043±0.007 | 2.1±0.2 | 70 | 18 | 12 | 43 | 40 | 17 |
| LNCaP | 0.17±0.01 | 0.87±0.06 | 0.014±0.011 | 1.11±0.1 | 78 | 15 | 7 | 68 | 23 | 9 |
| T47D-B8 | 0.46±0.06 | 0.29±0.4 | 0.045±0.006 | 2.21±0.2 | 65 | 26 | 9 | 53 | 14 | 33 |
| MCF-7 | 0.53±0.06 | 0.16±0.04 | 0.078±0.006 | 2.35±0.3 | 73 | 16 | 11 | 60 | 25 | 15 |
| MCF7-BB | 0.51±0.05 | 0.28±0.03 | 0.027±0.005 | 2.55±0.1 | 47 | 43 | 10 | 70 | 16 | 14 |
| MCF7-Bus | 0.31±0.03 | 0.52±0.03 | 0.03±0.005 | 1.64±0.1 | 76 | 14 | 10 | 52 | 3 | 13 |
Surviving fraction for a X-ray dose of 2 Gy.
Linear and quadratic term of the dose response.
Dbar, mean inactivation dose.
Percentage of cells in G1, S or G2M-phase 24 h after 0 or 150 Gy.
Induction of dsbs
Figure 2 shows dose-dependent separation of radiation-induced DNA fragments for MCF7-BB cells using CFGE (A) and GFGE (B). CFGE was run at a constant field strength of 0.6 V cm−1 collecting all released DNA fragments in a single band. The FDR, as determined by CFGE for all tumour cell lines (Figure 3), was found to increase with dose finally reaching a plateau at doses of 100–140 Gy. Clear differences were obvious for both the initial slope (see inset) and the final plateau. The initial slope varied by a factor of 2 (Table 2, 1st row) and the final plateau by 1.6.
Figure 3.

(A) Induction of dsb measured by CFGE. Cells were irradiated on ice with doses up to 140 Gy immediately followed by the measurement of dsb by CFGE. The increase of FDR with dose was fitted by nonlinear regression. The initial slope of FDR was determined by linear regression of the data obtained for doses up to 20 Gy (insrt). (B) Correlation between the number of dsb induced, as calculated from Figure 4, and the initial slope, as taken from Figure 3A. The symbols correspond to those in Figure 1.
Table 2. Parameters of initial and residual dsb for tumour and normal cells.
| Cell lines | Initial slopea (Gy−1) | kb 10−12 (Gy−1 Da−1) | fretc (%) | N24 h(150 Gy)d (Gy-equival.) |
|---|---|---|---|---|
| Tumour cell lines | ||||
| RT112 | 0.010±0.001 | 5.75±0.77 | 33±3 | 37.5±4.9 |
| DU145 | 0.012±0.001 | 6.39±0.64 | 30±4 | 24.1±4.2 |
| SSC4451 | 0.018±0.001 | 8.18±0.63 | 23±4 | 9.9±2.4 |
| HeLa | 0.021±0.003 | 8.31±0.72 | 11±3 | >150 |
| LNCaP | 0.020±0.001 | 8.31±0.76 | 12±2 | 10.2±2.5 |
| T47D-B8 | 0.018±0.001 | 9.71±0.70 | 28±4 | >150 |
| MCF-7 | 0.017±0.002 | 8.43±0.71 | 16±3 | 12.8±1.8 |
| MCF7-BB | 0.018±0.001 | 7.92±0.59 | 19±3 | 14.5±2.3 |
| MCF7-Bus | 0.020±0.002 | 11.00±0.65 | 40±5 | >150 |
| Mean | 8.22±1.6 | |||
| Normal human Fibroblasts | ||||
| HF-1 | Nde | 7.76±0.71 | 3±2 | Nd |
| HF-46 | Nd | 7.80±0.63 | 22±3 | Nd |
| HF-2 | Nd | 8.43±0.69 | 15±3 | Nd |
| HF-60 | Nd | 8.05±0.72 | 17±2 | Nd |
| HF-F | Nd | 8.69±0.68 | 20±5 | Nd |
| HF-8 | Nd | 7.16±0.75 | 6±3 | Nd |
| HF-7 | Nd | 7.54±0.60 | 6±3 | Nd |
| Mean | 7.9±0.50 |
Initial slope calculated by linear regression from data shown in the inset of Figure 3.
Number of dsb per Gy and per Da calculated from the data plotted in Figure 4.
Fraction of fragments that did not migrate to band 1 because of being retained in the plug.
Number of dsb measured 24 h after irradiation with 150 Gy expressed in Gy-equivalents.
Not determined.
These data suggested that the nine tumour strains studied differ in the number of dsb induced. However, the absolute number cannot be deduced from these data. Therefore, induction was also measured by GFGE, as previously described (Dahm-Daphi and Dikomey, 1995). Electrophoresis was run at two field strengths, which resulted in two distinct bands containing DNA fragments of different molecular weights (Figure 2B). GFGE hence allows to calculate the absolute number of dsb induced in each cell line. Fractions of DNA released (FDR) to bands 1 and 2 together with the total DNA released were measured for all nine tumour and also for seven human fibroblast lines (Figure 4). In all cases, FDR of band 1 first increased with the dose, reaching a maximum at a certain dose and declined thereafter. In contrast, band 2 increased continuously. The fraction of total DNA released, which is the sum of FDR in bands 1 and 2, gave a similar curve to that of CFGE (Figure 3). Bands 1 and 2 differed considerably between the cell lines, which was most obvious for the dose at which band 1 reached its maximum. For example, RT112 and DU145 cells band 1 reached this maximum at doses of 55–60 Gy, in contrast to a two-fold lower dose of 30 Gy measured for MCF-7-Bus cells.
For each strain, the FDR in bands 1 and 2 were simultaneously fitted as function of dose using a model previously described in detail (Dahm-Daphi and Dikomey, 1995). Those fits gave the number of dsb and a retention factor (fret). The comparison of all strains gave by fitting the size of the fragments in each band. According to these fits band 1 contained DNA fragments of 5.25–11.0 Mbp and band 2 of less than 5.25 Mbp. Theses values are slightly higher than previously reported (Dahm-Daphi and Dikomey, 1995). Now, 16 different cell lines have been analysed instead of only two data sets before (Dahm-Daphi and Dikomey, 1995). The number of dsb induced per Gy and Da was found to vary by a factor of 2 between 5.75 for RT112 and 11.5 × 10⁻¹² dsb/Gy/Da for MCF7-Bus (Table 2). The respective range for the seven normal fibroblast lines was significantly smaller (7.2–8.6 × 10⁻¹² dsb/Gy/Da). These values are equivalent to a variation of 14–27 dsb/Gy/diploid DNA content for tumour cells and 18–20 dsb/Gy/diploid DNA content for normal fibroblasts.
Figure 3B shows the relationship between the initial slope of the FDR curves measured by CFGE (Figure 3A) and the number of induced dsb as obtained from GFGE (Figure 4). There was a significant correlation between both parameters suggesting that differences in the initial slope of CFGE curves (inset of Figure 3) reflect the different number of dsb induced, as proposed above. In conclusion, the number of dsb induced per Gy and Da showed a substantial variation for the tumour cells, but not for normal fibroblasts.
As a novelty, GFGE allows to quantify the retention of DNA fragments in the plug (Dahm-Daphi and Dikomey, 1995). This retention factor, fret, depends on cell type, proliferation and presumably other effects. It needs to be known for calculation of the exact number of dsb. For the tumour cells the retention factor fret ranged between 0.11 (HeLa) and 0.4 (MCF7-Bus) (Table 2), which indicates that for HeLa cells only 11% of all fragments with a molecular size below 11.5 Mbp were trapped in the plug in contrast to 40% for MCF7-Bus.
Rejoining of dsbs
Figure 5A shows the repair kinetics of dsb for DU145 and LNCaP. The FDR as obtained from CFGE were converted into Gy-equivalents using the induction curves (Figure 3) for calibration. The repair curves revealed a fast and a slow exponential component with almost identical half-times for both cell lines (τfast=3–4 min and τslow=90–100 min). These data illustrate that tumour cells are unlikely to process dsb with different kinetics compared to normal cells, which was also observed previously for mouse and rat tumour cells (Dikomey et al, 1995, 1998). However, in LNCaP cells more dsb were rejoined with fast kinetics than in DU145 and analogously more dsb remain nonrepaired in DU145 cells.
Figure 5.

(A) Kinetics of dsb repair in DU145 and LNCaP cells. After irradiation with 60 Gy, cells were incubated at 37°C for up to 24 h and dsb were measured by CFGE. The FDR obtained were converted into Gy-equivalents. Data were fitted by nonlinear regression. (B) Number of dsb 24 h after irradiation with doses up to 150 Gy. For T47D-B8, MCF7-Bus and HeLa cells, damage measured 24 h after irradiation was higher than the number of dsb initially induced (dashed lines). Data were fitted by nonlinear regression.
Residual dsbs
Residual damage was measured in more detail 24 h after irradiation. In order to record the exact number of dsb, GFGE would be the favorite method; however, the minimum amount DNA released after 24 h cannot be properly resolved. We thus applied CFGE and came up with heterogeneous results (Figure 5B). Four tumour cell lines (SCC4451, LNCaP, MCF7 and MCF7-BB) showed very little residual damage of 8–13 Gy-Eq 24 h after 150 Gy, while in DU145 and RT112 clearly more dsb remained unrepaired. T47D-B8, MCF7-BUS and HeLa cells presented values that even exceeded the initial numbers of dsb induced. The respective gels revealed a DNA smear down to fragment sizes of about 5 kb (not shown). In those cases, the residual dsb rather reflect apoptotic degradation than incomplete repair.
Cell cycle distribution
Constant-field gel electrophoresis measurements are known to be dependent on the cell cycle distribution. S-phase cells show a smaller FDR than G1 cells even for an identical number of dsb (Dahm-Daphi and Dikomey, 1995). Replication forks are suggested to hinder DNA from migration. DNA flow cytometry of RT112 cells 24 h after irradiation showed a cell cycle distribution varying substantially with dose (Figure 6). In particular, the fraction of S-phase cells increased up to 72% and declined thereafter. An appreciable variation in cell cycle distribution was also observed for most of the other strains (Table 1). After 150 Gy, some cell lines showed either more (LNCaP, MCF-7, MCF7-Bus) or fewer cells in S phase (T47D-B8, MCF7-BB) than the respective controls. However, even when the cell cycle distribution was the same at 0 and 150 Gy (DU145, SCC4451), a variation might have occurred at other doses, as observed in RT112. In conclusion, the measurement of residual damage is variably influenced by the cell cycle and, thus, do not solely reflect the actual number of dsb.
Figure 6.
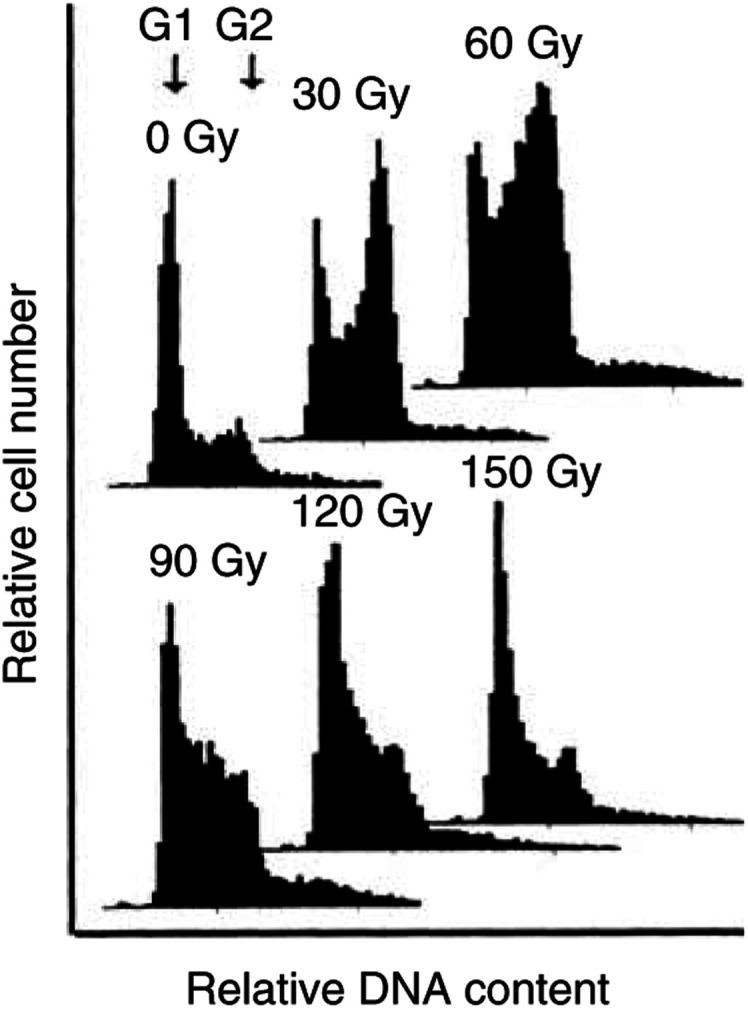
Cell cycle distribution in RT112 cells 24 h after exposure to doses up to 150 Gy. Ethanol-fixed cells were PI stained and subjected to DNA flow cytometry.
Correlation between clonogenic radiosensitivity and initial or residual dsbs
Figure 7 shows the relationship between the clonogenic radiosensitivity and the number of dsb induced (A) or 24 h after irradiation with 150 Gy (B). The cell killing (Dbar) was found to be significantly correlated with the number of induced dsb (r2=0.833, P=0.0015). LNCaP cells were excluded, since the data point was exterior to the range of 2 s.d. However, the correlation was even significant when LNCaP was included (r2=0.47, P=0.041). The data indicate that at least for eight out of nine tumour cells, the variation in sensitivity could result from differences in the initial damage.
Figure 7.

Relationship between dsb and cellular radiosensitivity. (A) Number of dsb induced per Gy and per Da (as calculated from Figure 4) and (B) number of dsb measured 24 h after 150 Gy (taken from Figure 5B) were plotted vs cellular radiosensitivity expressed as Dbar (from Table 1).
The relationship between residual dsb and sensitivity gave a nonsignificant trend. This trend, however, was presumably not meaningful, since an increase in the number of residual dsb was associated with a decrease in sensitivity. In contrast to the initial damage, residual dsb as determined by CFGE appeared not to be an appropriate indicator of the clonogenic radiosensitivity.
DISCUSSION
The present study was aimed to define the role of initial and residual dsb on the radiosensitivity of human tumour cells.
Relationship between induced damage and cellular radiosensitivity
For the nine tumuor cell lines tested, the number of dsb induced was found to vary by a factor of 2 from 5.75 to 11.0 × 10⁻¹² dsb/Gy/Da (Table 2), which in principle agreed with most previous studies (Kelland et al, 1988; McMillan et al, 1990; Schwartz et al, 1990, 1991; Ruiz de Almodovar et al, 1994; Zaffaroni et al, 1994; Whitaker et al, 1995; Woudstra et al, 1998; Eastham et al, 2001) using either PFGE or neutral filter elution. Some authors did not mention differences in particular; however, variations were in the same order of magnitude as the above reports (Giaccia et al, 1992; Olive et al, 1994; McKay and Kefford, 1995). There was only one report (Olive et al, 1994) that found differences among six tumour cell lines using neutral filter elution but factually not by PFGE. Our result is important for three reasons. Firstly, the technique used is superior to others (see below) and, second, the variation in damage induction appears to be a property of tumour, but not of normal cells (see below). Most importantly, for eight out of the nine tumour cell lines the variation in the frequency of induced dsb showed a significant correlation with the respective variation in radiosensitivity (Figure 7A). Cell lines with a high number of dsb induced found to be much more sensitive than cell lines with a low number of induced dsb. This was similarly found by Ruiz de Almodovar et al (McMillan et al, 1990; Ruiz de Almodovar et al, 1994; Whitaker et al, 1995), other studies showed an insignificant trend (Schwartz et al, 1988; Giaccia et al, 1992; Zaffaroni et al, 1994; McKay and Kefford, 1995; Woudstra et al, 1998). In our study, one (LNCaP, Figure 7A) out of the nine cell lines fell off the general relationship between initial damage and cell survival indicating that the cellular radiosensitivity is eventually not only determined by the number of induced dsb but also by other still unknown factors.
The variations in the dsb induction frequency found for tumour cells are most likely due to different chromatin structures. High condensation of chromatin structure and tight DNA–protein association should efficiently protect from oxygen radical attack to DNA, and vice versa. Such structural variations among tumour cells have in fact been shown by means of the Halo-assay (Schwartz and Vaughan, 1989; Lynch et al, 1991; Woudstra et al, 1998). However, direct evidence for chromatin structure being responsible for differences in the dsb induction among tumour cells is lacking yet. It should be noted that the large differences in the dsb induction observed are mainly due to the three extreme values. This may indicate that not all tumour cell lines have an altered chromatin structure.
Contrary to tumour cells, the seven normal fibroblasts tested showed only scarce variation in the number of dsb induced, which confirmed previous results of five and twelve fibroblast lines (Wurm et al, 1994; Dikomey et al, 2000). Taken all together, it can be assumed that the number of dsb induced varies substantially in tumour cells, but not in normal human cells. The latter might reflect the general interindividual stability of the human genome.
Graded vs CFGE
Most measurements of dsb were performed with neutral filter elution, PFGE or CFGE, which all rely on quantification of overall fragments released from the bulk DNA. The newly applied GFGE has now the advantage to allow the direct determination of the number of dsb. It is shown here, for the first time, that this number was in fact correlated with the initial slope (up to 20 Gy) of the FDR curve of CFGE. However, this does not mean that the initial slope can reliably taken as an indicator for the amount of initial damage. In many cases, the variation in the initial slopes of FDR curves may not be large enough to reveal significant differences between the cell lines. The initial slope further depend on S-phase cells and on the retention factor fret. High fractions of replicating cells and high retention values decrease the slope and apparently the number of induced dsb. This might well be the reason why only three out of 13 studies found a relationship between induced damage and tumour cell radiosensitivity (Kelland et al, 1988; Schwartz et al, 1988, 1990, 1991; McMillan et al, 1990; Giaccia et al, 1992; Olive et al, 1994; Ruiz de Almodovar et al, 1994; Zaffaroni et al, 1994; McKay and Kefford, 1995; Whitaker et al, 1995; Woudstra et al, 1998; Eastham et al, 2001). In conclusion, GFGE is the preferable method over a standard FDR assay to measure dsb induction in tumour cells.
Number of induced dsb
The mean dsb induction frequency of all 16 cell lines was 8.1 × 10⁻¹² dsb/Gy/Da. (Table 2). This value confirmed our previous results (Dahm-Daphi and Dikomey, 1995; El-Awady et al, 2001) and also agreed well with other data (range 8–15 × 10−12 dsb/Gy/Da) based on PFGE, from which a number of dsb can be calculated when it is combined with either 125I-decay, analysis of fragment size distribution after high doses, or restriction digest (Blöcher and Pohlit, 1982; Ager and Dewey, 1990; Iliakis et al, 1991a, 1991b; Lawrence et al, 1993; Cedervall et al, 1994, 1995; Löbrich et al, 1994a, 1994b; Rothkamm and Löbrich, 1999, 2003). Only, Ruiz de Almodovar et al (1994) found a much higher induction frequency of about 66 dsb × 10−12/Gy/Da.
Residual dsb
The amount of nonrepaired damage showed a broad variation among the nine tumour cell lines. However, it was shown that apoptosis (Chukhlovin et al, 1995) and also cell cycle progression could have an impact on dsb measurements, which means that the residual damage recorded does not exclusively reflect repair capacity. In line with that we did not find a correlation between residual damage and cell survival, which also agreed with other reports (Kelland et al, 1988; Olive et al, 1994; McKay and Kefford, 1995; Nunez et al, 1995; Whitaker et al, 1995; Woudstra et al, 1996). Surprisingly, four studies found such a correlation but only when the residual damage was measured 1–2 h after irradiation (Schwartz et al, 1988, 1990; Giaccia et al, 1992; Zaffaroni et al, 1994). It may well be that the impact of cell cycle and apoptosis was minimum after such short repair intervals and the data, thus, reflect mainly the amount of dsb induced and initial repair efficiency. Of note, for our data, the association between induced damage and radiosensitivity appears to be close, which means that the impact of the repair capacity should be only marginal.
The recently introduced technique to visualise sites of histone γ-H2AX phosphorylation (Rogakou et al, 1998) needs much lower doses than gel electropheresis to monitor dsb repair (Rothkamm and Löbrich, 2003) and may thus reduce apoptosis and cell cycle pertubation, although this technique is generally also sensitive to DNA degradation (Rogakou et al, 2000) and stalled replication (Ward and Chen, 2001). However, it needs to be shown whether recording of γ-H2AX will be an advantage over conventional gel electrophoresis for monitoring residual damage in tumour cells.
In contrast to tumour cells, for normal human and rodent fibroblasts, the variation in cellular sensitivity did not result from differences in the induction, but the repair of dsb (Dahm-Daphi et al, 1994; Kiltie et al, 1997; Zhou et al, 1997a, 1997b; Dikomey et al, 1998, 2000). These results suggest that the mechanisms affecting radiosensitivity are different for tumour and normal cell lines.
CONCLUSION
Tumour cells vary considerably in their amount of induced damage. These differences are most likely due to variations of chromatin structure and they may largely account for tumour cell survival. The number of residual damage was also different among the cell lines studied, but we could now show that those measurements do not only depend on the repair capacity per se but also on the cell cycle progression and in some cases on DNA degradation, presumably due to apoptosis.
References
- Ager DD, Dewey WC (1990) Calibration of pulsed field gel electrophoresis for measurement of double-strand breaks. Int J Radiat Biol 58: 249–259 [DOI] [PubMed] [Google Scholar]
- Ager DD, Dewey WC, Gardiner K, Harvey W, Johnson RT, Waldren CA (1990) Measurement of radiation-induced DNA double-strand breaks by pulsed-field gel electrophoresis. Radiat Res 121: 181–187 [PubMed] [Google Scholar]
- Björk-Eriksson T, West C, Karlson E, Mercke C (2000) Tumor radiosensitivity (SF2) is a prognostic factor for local control in head and neck cancers. Int J Radiat Oncol, Biol, Phys 46: 13–19 [DOI] [PubMed] [Google Scholar]
- Blöcher D (1990) In CHEF electrophoresis a linear induction of dsb correspond to a nonlinear fraction of extracted DNA with dose. Int J Radiat Biol 57: 7–12 [DOI] [PubMed] [Google Scholar]
- Blöcher D, Einspenner M, Zajackowski J (1989) CHEF electrophoresis, a sensitive technique for the determination of double-strand breaks. Int J Radiat Biol 56: 437–448 [DOI] [PubMed] [Google Scholar]
- Blöcher D, Pohlit W (1982) DNA double strand breaks in Ehrlich ascites tumour cells at low doses of X-ray. II. Can cell death be attributed to double strand breaks? Int J Radiat Biol 42: 329–338 [DOI] [PubMed] [Google Scholar]
- Borgmann K, Röper B, El-Awadi RA, Brackrock S, Bigalke M, Dörk T, Alberti W, Dikomey E, Dahm-Daphi J (2002) Indicators of late normal tissue response after radiotherapy for head and neck cancer: fibroblasts, lymphocytes, genetics, DNA repair, and chromosome aberrations. Radiother Oncol 64: 141–152 [DOI] [PubMed] [Google Scholar]
- Bryant PE (1984) Enzymatic restriction of mammalian cell DNA using PvuII and BamHI: evidence for the double-strand break origin of chromosomal aberrations. Int J Radiat Biol 46: 57–65 [DOI] [PubMed] [Google Scholar]
- Carle GF, Frank M, Olson M (1986) Electrophoretic separations of large DNA molecules by periodic inversion of the electric field. Science 232: 65–68 [DOI] [PubMed] [Google Scholar]
- Cedervall B, Sirzea F, Brodin O, Lewensohn R (1994) Less initial rejoining of X-ray-induced DNA double-strand breaks in cells of a small cell (U-1285) compared to a large cell (U-1810 lung carcinoma cell line. Radiat Res 139: 34–39 [PubMed] [Google Scholar]
- Cedervall B, Wong R, Albright N, Dynlacht J, Lambin P, Dewey WC (1995) Methods for the quantification of DNA double-strand breaks determined from the distribution of DNA fragment sizes measured by pulsed-field gel electrophoresis. Radiat Res 143: 8–16 [PubMed] [Google Scholar]
- Chu G (1991) Bag model for DNA migration during pulsed-field electrophoresis. Proc Nat Acad Sci USA 88: 11071–11075 [DOI] [PMC free article] [PubMed] [Google Scholar]
- Chukhlovin A, Dahm-Daphi J, Gehrken G, Zander AR, Dikomey E (1995) Comparative study of induction and repair of DNA double-strand breaks in X-irradiated alveolar macrophages and resting peripheral blood lymphocytes using constant-field gel electrophoresis. Int J Radiat Biol 68: 163–168 [DOI] [PubMed] [Google Scholar]
- Dahm-Daphi J, Dikomey E (1995) Separation of DNA fragments induced by ionizing irradiation using a graded-field gel electrophoresis. Int J Radiat Biol 67: 161–168 [DOI] [PubMed] [Google Scholar]
- Dahm-Daphi J, Dikomey E (1996) Rejoining of DNA double-strand breaks in X-irradiated CHO cells studied by constant- and graded-field gel electrophoresis. Int J Radiat Biol 69: 615–621 [DOI] [PubMed] [Google Scholar]
- Dahm-Daphi J, Dikomey E, Pyttlik C (1994) Relationship between non-reparable strand breaks and cell survival studied in CHO, CHO K1 and the radiosensitive mutants xrs1 and xrs5. Int J Radiat Biol 65: 657–663 [DOI] [PubMed] [Google Scholar]
- Deacon J, Peckham MJ, Steel GG (1984) The radioresponsiveness of human tumours and the initial slope of the cell survival curve. Radiother Oncol 2: 317–323 [DOI] [PubMed] [Google Scholar]
- Dikomey E, Brammer I, Johansen J, Bentzen SM, Overgaard J (2000) Relationship between DNA double-strand breaks, cell killing, and fibrosis studied in confluent skin fibroblasts derived from breast cancer patients. Int J Radiat Oncol Biol Phys 46: 481–490 [DOI] [PubMed] [Google Scholar]
- Dikomey E, Dahm-Daphi J, Brammer I, Martensen R, Kaina B (1998) Correlation between cellular radiosensitivity and non-repaired double-strand breaks studied in nine mammalian cell lines. Int J Radiat Biol 73: 269–278 [DOI] [PubMed] [Google Scholar]
- Dikomey E, Flentje M, Dahm-Daphi J (1995) Comparison between the alkaline unwinding technique and neutral filter elution uding CHO, V79 and EAT cells. Int J Radiat Biol 67: 269–275 [DOI] [PubMed] [Google Scholar]
- Eastham AM, Atkinson J, West CML (2001) Relationships between clonogenic cell survival, DNA damage and chromosomal radiosensitivity in nine human cervix carcinoma cell lines. Int J Radiat Biol 77: 295–302 [DOI] [PubMed] [Google Scholar]
- El-Awady RA, Dikomey E, Dahm-Daphi J (2001) Heat effects on DNA repair after ionizing radiation. Hyperthermia commonly increases the number of non-repaired double strand breaks and structural rearrangements. Nucleic Acid Res 29: 1960–1966 [DOI] [PMC free article] [PubMed] [Google Scholar]
- Fertil B, Dertinger H, Courdi A, Malaise EP (1984) Mean inactivation dose: a useful concept for intercomparison of human cell survival curves. Radiat Res 99: 73–84 [PubMed] [Google Scholar]
- Fertil B, Malaise EP (1985) Intrinsic radiosensitivity of human cell lines is correlated with radioresponsiveness of human tumors: analysis of 101 published survival curves. Int J Radiat Oncol Biol Phys 11: 1699–1707 [DOI] [PubMed] [Google Scholar]
- Giaccia AJ, Schwartz J, Shieh J, Brown JM (1992) The use of asymmetric field inversion gel electrophoresis to predict tumor cell radiosensitivity. Radiother Oncol 24: 231–238 [DOI] [PubMed] [Google Scholar]
- Horoszewicz GS, Leong S, Kawinski E, Karr JP, Rosenthal H, Chu TK, Mirand EA, Murphy GP (1983) LNCaP model of human prostatic carcinoma. Cancer Res 43: 1809–1818 [PubMed] [Google Scholar]
- Hutchinson F (1989) On the measurement of DNA double-strand breaks by neutral elution. Radiat Res 120: 182–186 [PubMed] [Google Scholar]
- Iliakis GE, Cicilioni O, Metzger L (1991a) Measurement of DNA double-strand breaks in CHO cells at various stages of the cell cycle using pulsed field gel electrophoresis: calibration by means of 1251 decay. Int J Radiat Biol 59: 343–357 [DOI] [PubMed] [Google Scholar]
- Iliakis GE, Metzger L, Denko N, Stamato TD (1991b) Detection of DNA double-strand breaks in synchronous cultures of CHO cells by means of asymmetric field inversion gel electrophoresis. Int J Radiat Biol 59: 321–341 [DOI] [PubMed] [Google Scholar]
- Kelland LR, Edwards SM, Steel GG (1988) Induction and rejoining of DNA double-strand breaks in human cervix carcinoma cell lines of differing radiosensitivity. Radiat Res 116: 526–538 [PubMed] [Google Scholar]
- Kiltie AE, Orton CJ, Ryan AJ, Roberts SA, Marples B, Davidson SE, Hunter RD, Margison GP, West CML, Hendry JH (1997) A correlation between residual DNA double-strand breaks and clonogenic measurements of radiosensitivity in fibroblasts from preradiotherapy cervix cancer patients. Int J Radiat Oncol Biol Phys 39: 1137–1144 [DOI] [PubMed] [Google Scholar]
- Kraxenberger A, Friedl AA, Kellerer AM (1994) Computer simulation of pulsed field gel runs allows the quantitation of radiation-induced double-strand breaks in yeast. Electrophoresis 15: 128–136 [DOI] [PubMed] [Google Scholar]
- Lawrence TS, Normolle DP, Davis MA, Maybaum J (1993) The use of biphasic linear ramped pulsed field gel electrophoresis to quantify DNA damage based on fragment size distribution. Int J Radiat Oncol Biol Phys 27 (3): 659–663 [DOI] [PubMed] [Google Scholar]
- Löbrich M, Ikpeme S, Kiefer J (1993) Analysis of the inversion effect in pulsed field gel electrophoresis by a two-dimensional contour-clamped homogeneous electric field system. Anal Biochem 208: 65–73 [DOI] [PubMed] [Google Scholar]
- Löbrich M, Ikpeme S, Kiefer J (1994a) DNA double-strand break measurement in mammalian cells by pulsed-field gel electrophoresis: an approach using restriction enzymes and gene probing. International J Radiat Biol 65: 623–630 [DOI] [PubMed] [Google Scholar]
- Löbrich M, Rydberg B, Cooper PK (1994b) DNA double-strand breaks induced by high-energy neon and iron ions in human fibroblasts. II. Probing individual NotI fragments by hybridization. Radiat Res 139: 142–151 [PubMed] [Google Scholar]
- Lynch TH, Anderson P, Wallace DM, Kondratowicz GM, Beaney RP, Vaughan ATM (1991) A correlation between nuclear supercoiling and the response of patients with bladder cancer to radiotherapy. Br J Cancer 64: 867–871 [DOI] [PMC free article] [PubMed] [Google Scholar]
- Masters JRW, Hepurn PJ, Walker L, Highman WJ, Trejdosiewicz LK, Hill Bt, Riddle PR, Franks LM (1986) Tissue culture models of transitional cell carcinoma: characterization of 22 human urothelial cell lines. Cancer Res 4: 3630–3636 [PubMed] [Google Scholar]
- McKay MJ, Kefford RF (1995) The spectrum of in vitro radiosensitivity in four human melanoma cell lines is not accounted for by differential induction or rejoining of DNA double-strand breaks. Int J Radiat Oncol Biol Phys 31: 345–352 [DOI] [PubMed] [Google Scholar]
- McMillan TJ, Cassoni AM, Edwards S, Holmes A, Peacock JH (1990) The relationship of DNA double-strand break induction to radiosensitivity in human tumour cell lines. Int J Radiat Biol 58: 427–438 [DOI] [PubMed] [Google Scholar]
- McMillan TJ, Tobi S, Mateos S, Lemon C (2001) The use of DNA double-strand break quantification in radiotherapy. Int J Radiat Oncol Biol Phys 49: 373–377 [DOI] [PubMed] [Google Scholar]
- Nunez MI, Villalobos M, Olea N, Valenzuela MT, Pedraza V, McMillan TJ, Ruiz de Almodovar JM (1995) Radiation-induced DNA double-strand break rejoining in human tumour cells. Br J Cancer 71: 311–316 [DOI] [PMC free article] [PubMed] [Google Scholar]
- Okayasu R, Bloecher D, Iliakis G (1988) Variation through the cell cycle in the dose–response of DNA neutral filter elution in X-irradiated synchronous CHO-cells. Int J Radiat Biol 53: 729–747 [DOI] [PubMed] [Google Scholar]
- Okayasu R, Iliakis G (1989) Linear DNA elution dose–response curves obtained in CHO cells with non-unwinding filter elution after appropriate selection of the lysis conditions. Int J Radiat Biol 55: 569–581 [DOI] [PubMed] [Google Scholar]
- Olive PL, Banath JP, MacPhail HS (1994) Lack of a correlation between radiosensitivity and DNA double-strand break induction or rejoining in six human tumor cell lines. Cancer Res 54: 3939–3946 [PubMed] [Google Scholar]
- Pfeiffer P, Goedecke W, Obe G (2000) Mechanisms of DNA double-strand break repair and their potential to induce chromosomal aberrations. Mutagenesis 15: 289–302 [DOI] [PubMed] [Google Scholar]
- Rogakou EP, Nieves-Neira W, Boon C, Pommier Y, Bonner WM (2000) Initiation of DNA fragmentation during apoptosis induces phosphorylation of H2AX histone at serin 139. J Biol Chem 275: 9390–9395 [DOI] [PubMed] [Google Scholar]
- Rogakou EP, Pilch DR, Orr AH, Ivanova VS, Bonner WM (1998) DNA double-stranded breaks induce histone H2AX phosphorylation on Serine 139. J Biol Chem 273: 5858–5868 [DOI] [PubMed] [Google Scholar]
- Rothkamm K, Löbrich M (1999) Misrejoining of DNA double-strand breaks in primary and transformed human and rodent cells: a comparison between the HPRT region and other genomic locations. Mutat Res 433: 193–205 [DOI] [PubMed] [Google Scholar]
- Rothkamm K, Löbrich M (2003) Evidence for a lack of DNA double-strand break repair in human cells exposed to very low doses. Proc Nat Acad Sci USA 100: 5057–5062 [DOI] [PMC free article] [PubMed] [Google Scholar]
- Ruiz de Almodovar JM, Nunez MI, McMillan TJ, Olea N, Mort C, Villalobos M, Pedraza V, Steel GG (1994) Initial radiation-induced DNA damage in human tumour cell lines: a correlation with intrinsic cellular radiosensitivity. Br J Cancer 69: 457–462 [DOI] [PMC free article] [PubMed] [Google Scholar]
- Scherer WF, Syverton GT, Gey GO (1953) Studies on the propagation in vitro of poliomyelitis virus. J Exp Med 97: 695–709 [DOI] [PMC free article] [PubMed] [Google Scholar]
- Schwartz JL, Mustafi R, Beckett MA, Czyzewski EA, Farhang E, Grdina DJ, Rotmensch J, Weichselbaum RR (1991) Radiation-induced DNA double-strand break frequencies in human squamous cell carcinoma cell lines of different radiation sensitivities. Int J Radiat Biol 59: 1341–1352 [DOI] [PubMed] [Google Scholar]
- Schwartz JL, Mustafi R, Beckett MA, Weichselbaum RR (1990) Prediction of the radiation sensitivity of human squamous cell carcinoma cells using DNA filter elution. Radiat Res 123: 1–6 [PubMed] [Google Scholar]
- Schwartz JL, Rotmensch J, Giovanazzi S, Cohen MB, Weichselbaum RR (1988) Faster repair of DNA double-strand breaks in radioresistant human tumor cells. Int J Radiat Oncol Biol Phys 15: 907–912 [DOI] [PubMed] [Google Scholar]
- Schwartz JL, Vaughan ATM (1989) Association among DNA/chromosome break rejoining rates, chromatin structure alterations, and radiation sensitivity in human tumor cell lines. Cancer Res 49: 5054–5057 [PubMed] [Google Scholar]
- Siles E, Villalobos M, Valenzuela MT, Nunez MI, Gordon A, McMillan TJ, Pedraza V, Ruiz de Almodovar JM (1995) Relationship between p53 status and radiosensitivity in human tumour cell lines. Br J Cancer 73: 581–588 [DOI] [PMC free article] [PubMed]
- Soto AM, Murai JT, Siteri PK, Sonnenschein C (1986) Control of cell proliferation: evidence for negative control on estrogen-sensitive T47D human breast cancer cells. Cancer Res 46: 2271–2275 [PubMed] [Google Scholar]
- Soule D, Vazquez L, Long A, Albert S, Brennan M (1973) Human cell line from a pleural effusion derived from a breast carcinoma. J Nat Cancer Inst 51: 1409–1413 [DOI] [PubMed] [Google Scholar]
- Stamato TD, Denko N (1990) Asymmetric field inversion gel electrophoresis: a new method for detecting DNA double-strand breaks in mammalian cells. Radiat Res 121: 196–205 [PubMed] [Google Scholar]
- Stausbol-Gron B, Overgaard J (1999) Relationship between tumor cell in vitro radiosensitivity and clinical outcome after curative radiotherapy for squamous cell carcinoma of the head and neck. Radiother Oncol 50: 47–55 [DOI] [PubMed] [Google Scholar]
- Stone KR, Michey DD, Wunderli H, Mickey GH, Paulson DF (1978) Isolation of a human prostate carcinoma cell line (DU145). Int J Cancer 21: 274–281 [DOI] [PubMed] [Google Scholar]
- Ward IM, Chen J (2001) Histone H2AX is phosphorylated in an ATR-dependent manner in response to replicational stress. J Biol Chem 276: 47759–47762 [DOI] [PubMed] [Google Scholar]
- Ward JF (1988) DNA damage produced by ionizing radiation in mammalian cells: identities, mechanisms of formation, and reparability. Prog Nucleic Acid Res Mol Biol 35: 95–125 [DOI] [PubMed] [Google Scholar]
- West CML, Davidson SE, Burt PA, Hunter RD (1995) The intrinsic radiosensitivity of cervical carcinoma: correlations with clinical data. Int J Radiat Oncol Biol Phys 31: 841–846 [DOI] [PubMed] [Google Scholar]
- West CML, Davidson SE, Roberts SA, Hunter RD (1993) Intrinsic radiosensitivity and prediction of patient response to radiotherapy for carcinoma of the cervix. Br J Cancer 68: 819–823 [DOI] [PMC free article] [PubMed] [Google Scholar]
- Whitaker SJ, Ung YC, McMillan TJ (1995) DNA double-strand break induction and rejoining as determinants of human tumour cell radiosensitivity. A pulsed-field gel electrophoresis study. Int J Radiat Biol 67: 7–18 [DOI] [PubMed] [Google Scholar]
- Wlodek D, Olive PL (1990) Physical bases for detection of DNA double-strand breaks using neutral filter elution. Radiat Res 124: 326–333 [PubMed] [Google Scholar]
- Woudstra EC, Brunsting JF, Roesink JM, Konings AWT, Kampinga HH (1996) Radiation induced DNA damage and damage repair in three human tumour cell lines. Mutat Res 362: 51–59 [DOI] [PubMed] [Google Scholar]
- Woudstra EC, Driessen C, Konings AWT, Kampinga HH (1998) DNA damage induction and tumour cell radiosensitivity: PFGE and halo measurements. Int J Radiat Biol 73: 495–502 [DOI] [PubMed] [Google Scholar]
- Wurm R, Burnet NG, Duggal N, Yarnold JR, Peacock JH (1994) Cellular radiosensitivity and DNA damage in primary human fibroblasts. Int J Radiat Oncol Biol Phys 30: 625–633 [DOI] [PubMed] [Google Scholar]
- Zaffaroni N, Orland L, Villa R, Bearzatto A, Rofstad EK, Silvestrini R (1994) DNA double-strand break repair and radiation response in human tumour primary cultures. Int J Radiat Biol 66: 279–285 [DOI] [PubMed] [Google Scholar]
- Zhou PK, Hendry JH, Margison GP (1997a) Comparative measurements of radiation-induced DNA double-strand breaks by graded voltage and pulsed-field gel electrophoresis. Int J Radiat Biol 71: 95–100 [DOI] [PubMed] [Google Scholar]
- Zhou PK, Sproston ARM, Marples B, West CML, Margison GP, Hendry JH (1997) The radiosensitivity of human fibroblast cell lines correlates with residual levels of DNA double-strand breaks. Radiother Oncol 47: 271–276 [DOI] [PubMed] [Google Scholar]
- Zölzer F, Hillebrandt S, Streffer C (1995) Radiation induced G1-Block and p53 status in six human cell lines. Radiother Oncol 37: 20–28 [DOI] [PubMed] [Google Scholar]