

Abstract
We demonstrate an integrated approach to the study of a transcriptional regulatory cascade involved in the progression of breast cancer and we identify a protein associated with disease progression. Using chromatin immunoprecipitation and genome tiling arrays, whole genome mapping of transcription factor-binding sites was combined with gene expression profiling to identify genes involved in the proliferative response to estrogen (E2). Using RNA interference, selected ERα and c-MYC gene targets were knocked down to identify mediators of E2-stimulated cell proliferation. Tissue microarray screening revealed that high expression of an epigenetic factor, the E2-inducible histone variant H2A.Z, is significantly associated with lymph node metastasis and decreased breast cancer survival. Detection of H2A.Z levels independently increased the prognostic power of biomarkers currently in clinical use. This integrated approach has accelerated the identification of a molecule linked to breast cancer progression, has implications for diagnostic and therapeutic interventions, and can be applied to a wide range of cancers.
Keywords: breast, cancer, chromatin, estrogen, histone variant
Introduction
Cancer is caused by the accumulation of genetic mutations combined with changes in the epigenetic state of affected cells. These changes result in the initiation and progression of tumors, which can be described, in part, by the gene expression profiles of the cancer cells in question, a unique gene expression ‘signature,' reflecting the activation or suppression of biological pathways important in generating the cancer phenotype (Perou et al, 1999; Sorlie et al, 2001; van de Vijver et al, 2002; Sotiriou et al, 2003). Importantly, gene expression profiling of tumors produces gene lists that do not necessarily contribute to a measured clinical distinction, such as the presence or absence of distant metastases. In fact, the lack of overlap in gene lists from different studies is an indication that, while capable of predicting patient survival, the lists are only weakly informative with regard to mechanisms of oncogenesis. Many genes with statistical significance in a gene expression signature will not serve as viable candidates for the development of prognostic assays or anticancer treatments (Ein-Dor et al, 2005; Fan et al, 2006). Use of genomic screening techniques to explore cancer cell physiology must therefore be followed by hypothesis testing to validate the genes that are important for accurate prognosis and to determine which are involved in the initiation and/or progression of disease.
Estrogens (E2) are steroid hormones that play critical roles in the initiation, development, and metastasis of breast and uterine cancers (Yager and Davidson, 2006). The E2 response in breast cancer cells is predominantly mediated by the estrogen receptor-α (ERα), a ligand-activated transcription factor. ERα regulates transcription of target genes through direct binding to its cognate recognition sites, known as estrogen response elements (EREs), or by modulating the activity of other DNA-bound transcription factors at alternative DNA sequences (Bjornstrom and Sjoberg, 2005). The proto-oncogene c-myc is upregulated by ERα in response to E2 (Dubik and Shiu, 1992) and encodes a transcription factor, c-MYC (henceforth MYC), which regulates a cascade of gene targets whose products mediate cellular transformation (Ponzielli et al, 2005). Synergy between MYC and ERα at a subset of E2-responsive promoters has been reported, suggesting a cooperative role between ERα and MYC in breast cancer progression (Cheng et al, 2006).
Endocrine therapy, often effective for ERα-positive breast tumors, impairs the hormone–receptor complex or inhibits E2 production. Unfortunately, a significant fraction (∼20–50%) of ERα-positive breast tumors fails to respond (EBCTC, 1998), or eventually develops resistance, to antiestrogen treatments (Schiff et al, 2005). The lack of integrated and comprehensive approaches to study pathways regulated by E2 has delayed our understanding of the progression to hormone resistance in cancer.
Using an E2-dependent breast cancer cell model, MCF7 cells, we employed an integrated genomic approach that combined E2-stimulated gene expression profiling and genome-wide transcription factor-binding site detection for two essential transducers of the E2 response, ERα and MYC. Recent reports have similarly identified ERα-binding sites and E2-activated gene expression in this cell model (Frasor et al, 2003; Carroll et al, 2005, 2006; Laganiere et al, 2005). However, integration of genomic screening data must be followed by functional and clinical studies to develop useful tools for diagnosing and treating cancer. Therefore, validation of direct transcription factor-regulated gene targets, using gene-specific knockdown in cell proliferation assays, was followed by clinical correlation using primary cancer specimens with associated data regarding patient outcomes. We demonstrate that hormone-stimulated MYC enhances production of an epigenetic factor, histone variant H2A.Z, the expression of which correlates with increased probability of metastasis and decreased patient survival. This integrated systems approach is potentially applicable to the study of other oncogenic pathways.
Results
Genome-wide identification of ERα- and MYC-binding sites in MCF7 cells
Recent studies have performed location analysis for ERα in MCF7 cells although MYC-binding sites have been identified only in selected cell types (such as lymphoma or leukemic cell lines), and not using whole genome arrays (Fernandez et al, 2003; Mao et al, 2003; Cawley et al, 2004). To validate previously reported data, and to generate MCF7-specific MYC-binding profiles, tiling microarrays spanning the entire nonrepetitive human genome were used to perform an unbiased search for direct targets of ERα and MYC. To recapitulate the phenotype of E2-dependent tumors, MCF7 cells were stimulated to proliferate with E2 before chromatin immunoprecipitation (ChIP).
We identified a total of 1615 ERα-bound regions (P<1e−5) throughout the human genome (Supplementary Table 1). The distribution of ERα-binding regions ranged from proximal (<1 kb) to the nearest transcription start site (TSS) of a gene to over 500 kb from the closest TSS (Figure 1A). Similarly, we detected 311 MYC-bound regions across the human genome in MCF7 cells (Supplementary Table 2). The distribution of MYC-bound loci in relation to annotated TSSs is depicted in Figure 1B. A total of 62.4% of ERα-bound regions detected in our study were confirmed in an independently derived data set using similar methods (Carroll et al, 2006) (common sites are indicated in Supplementary Table 1).
Figure 1.

Genomic distribution of ERα- and MYC-binding sites. The distributions of 1615 ERα- (A) and 311 MYC- (B) binding sites in E2-stimulated MCF7 cells relative to known genes. Where multiple genomic probes indicated a transcription factor-bound region, the center of each ERα- or MYC-binding region was designated as the bound position. Within annotated genes, binding sites were classified as follows: within 5′ untranslated regions (5′ UTR), within coding sequences (CDS), within 5′-most intron or the first intron, within other introns, and within 3′ untranslated regions (3′ UTR). ERα or MYC binding in intergenic regions was further classified based on the distance to the nearest annotated gene (0–10, 10–50, and >50 kb).
We examined ERα- and MYC-binding regions for the presence of predicted transcription factor-binding motifs and detected statistically significant enrichment of canonical EREs (AGGTCAnnnTGACCT) in ERα-bound regions and E-boxes (CACGTG) in MYC-bound regions (Supplementary Figures 1–3). Although we observed strong enrichment of EREs within ERα-bound regions of the genome, a significant proportion of ERα-bound regions may not contain a recognizable canonical ERE (Supplementary Figure 3).
It is known that ERα may exert effects at non-ERE-containing chromatin targets through protein–protein interactions with DNA-bound transcription factors, including the Fos and Jun family complexes (i.e. AP-1) (Webb et al, 1999; Cheung et al, 2005). Consistent with this observation, AP-1 sites were found to be highly enriched in ERα-bound regions (Supplementary Figure 1). We confirmed significant enrichment of binding sites for the forkhead transcription factor FOXA1 (Supplementary Figure 1). These data are consistent with a recently proposed model in which a subset of ERα regulatory regions are first targeted for transcriptional regulation by FOXA1 (Carroll et al, 2005; Laganiere et al, 2005). Additionally, we discovered significant enrichment of binding sites for the GATA factor, CREB1, and MSX1 (Supplementary Figure 1). Similar computational analyses were performed for MYC-bound regions and significant binding site enrichment was detected for CREB1, CTCF, AP-2γ, Sp1, and ERα (Supplementary Figure 2).
We compared binding motif enrichment in ERα-bound regions with and without predicted EREs. We found that AP-1-, Forkhead-, GATA factor-, and CREB1-binding motifs are significantly enriched in ERα-bound regions with and without EREs (at a P-value cutoff of 0.01; data not shown). Interestingly, the MYC-binding motif (E-box) is only significantly enriched in ERα-bound regions containing EREs (P=1.27E−04) but not at loci without EREs (P=5.90E−01; data not shown). C/EBPβ and MSK1 sites are enriched in regions without EREs (P=5.10E−03 and P=2.10E−03, respectively) but not in regions containing EREs (P=6.97E−01 and P=7.59E−02, respectively; data not shown). These results provide hypotheses regarding alternative gene regulatory mechanisms at ERα-bound loci depending on the presence or absence of an ERE motif at these loci. For example, ERα localization to sites containing C/EBPβ- or MSK1-binding motifs may principally occur via tethering to C/EBPβ or MSK1, or to associated cofactors. By contrast, ERα and MYC may preferentially bind target sites that contain both EREs and E-boxes, consistent with the significant colocalization of ERα- and MYC-binding regions identified by ChIP-Chip (Supplementary Figure 4). This observation is consistent with recent claims that MYC can synergize with ERα at E2-responsive promoters and suggests that these factors may physically interact to stabilize the transcriptional apparatus (Cheng et al, 2006).
To further predict combinatorial interactions between transcription factors, pairwise transcription factor-binding motif enrichment in ERα- or MYC-bound loci was assessed. The results demonstrated significant co-occurrence of EREs and E-boxes in both ERα- and MYC-bound regions and suggested new relationships, such as ERE plus NF-κB-binding motifs in ERα-bound regions and E-box plus CREB1 motifs in MYC-bound regions (Figure 2). Together, these data suggest that some ERα- and/or MYC-bound loci represent diverse cis-regulatory modules wherein multiple transcription factors may converge with ERE-bound ERα and/or E-Box-bound MYC to exert gene regulatory functions.
Figure 2.

Pairwise transcription factor-binding motif enrichment at ERα- or MYC-bound sites. Possible combinatorial interactions between transcription factors were tested by the enrichment of co-occurrence of transcription factor-binding motifs in ERα- (A) or MYC- (B) bound regions identified by ChIP-chip. Logo representations of the position weight matrix or the binding motif for each transcription factor are indicated in Supplementary Figures S1 and S2. Red stars indicate statistically significant enrichment of binding motifs for the single transcription factors (see Supplementary Figure S1 for ERα-bound regions and Supplementary Figure S2 for MYC-bound regions). The enrichment of each pair of transcription factors is indicated by the P-value after a Bonferroni multiple testing correction (see color legend).
Distribution and cross-species conservation of ERα- and MYC-binding sites
We examined the genome-wide patterns of ERα and MYC binding to determine whether these factors tend to be localized similarly within or near annotated genes. Both factors are symmetrically distributed 5′ and 3′ of TSSs (Figure 3A), suggesting that the orientation (5′ versus 3′) of response elements with respect to the TSS of promoters does not determine in vivo binding and may not influence transcription factor function. However, ERα-binding sites were relatively uniformly distributed from 10 kb downstream to 10 kb upstream of TSSs, whereas MYC bound more proximally, with peak binding observed within 1 kb of target TSSs (Figure 3A). These results demonstrate that MYC displays a binding preference for core promoters or promoter-proximal regions. We observed that a high proportion (77.7%) of ERα-bound targets were located greater than 10 kb from the nearest TSS (Figure 3B), whereas 23.8% reside greater than 100 kb from any annotated TSS in human genome.
Figure 3.

ERα- and MYC-binding site distributions proximal to TSSs. (A) Histograms of ERα- (upper panel) and MYC- (lower panel) binding sites residing within the downstream 10 kb or upstream 10 kb genomic regions relative to annotated TSSs. Where multiple genomic probes indicated a transcription factor-bound region, the center of each ERα- or MYC-binding region was designated as the bound position. Negative and positive values indicate transcription factor-binding regions located 5′ or 3′ of neighboring TSSs, respectively. (B) The proportion of ERα- or MYC-binding sites within a given distance (up to 10 kb) from a known TSS. Both orientations (5′ and 3′) relative to each TSS are considered.
We examined the evolutionary rates of regulatory regions bound by ERα and MYC and found that these differ. ERα-binding regions sustained relatively high sequence conservation between human and mouse or human and rat (about 75 million year divergence times) as compared to alignments of genomic background, whereas MYC-binding regions did not show sequence conservation above background levels (Supplementary Figure 5). The evolutionary conservation of ERα-bound sites supports their putative roles as functional cis-regulatory elements.
Interestingly, in primate genomes, those regions closer to gene start sites, in which many MYC sites predominate, appear to undergo more rapid evolution (Keightley et al, 2005). Our results indicate that mutation accumulation has reached saturating levels between humans and rodents for MYC-bound loci, whereas evolutionary comparisons are still informative for ERα-bound regions.
Integrated analysis of expression data with ERα- and MYC-binding regions
It is likely that only a subset of cis-regulatory elements are transcription factor-bound and/or functional in a given cell type under a given cellular milieu (Harbison et al, 2004). Combining gene expression data in the presence and absence of an activated transcription factor with data from transcription factor localization identifies the activated or repressed genes that are likely to be direct targets (Gao et al, 2004).
We measured gene expression changes in MCF7 cells after 4, 12, and 24 h of E2 treatment (Figure 4 and Supplementary Table 3). Gene expression profiling was combined with direct ERα-binding site localization to reveal that 5.1% of ERα-binding sites were within 10 kb of the TSS of any E2-responsive gene (Supplementary Table 4), consistent with the observation that ERα often binds far from target TSSs (Figures 1A and 3B). Nevertheless, these results revealed significant enrichment of receptor binding near regulated genes when compared to expectations generated by a random distribution model (P<5.4e−6). When we considered ERα-binding sites within 200 kb of any TSS, we found that 39% were in the vicinity of an E2-responsive gene (P<4.1e−12). The 61% of ERα-binding sites that were greater than 200 kb from any E2-responsive TSS may be regulating genes from extreme distances, may be regulating genes that are not currently annotated or may be inactive in MCF7 cells.
Figure 4.

Time course of E2-responsive genes in MCF7 cells. Time course of significantly up- and downregulated genes in MCF7 cells after stimulation with 10 nM 17β-estradiol (E2) is shown. Overlapping gene counts for three time points (4, 12, and 24 h) are shown for upregulated (A) and downregulated (B) genes (all P<0.01).
A systems-level analysis of E2 targets was performed by combining global protein–protein interaction data with our data from ERα and MYC location analyses and our measured E2-dependent changes in gene expression (Figure 5) (Peri et al, 2003; Stark et al, 2006). Several interesting modules involved in cellular proliferation were identified within the E2 signaling network. Enrichment for modules related to nucleic acid and protein metabolism is highlighted (Figure 5). The complete set of pairwise interactions of proteins involved in the E2 signaling cascade is presented in Supplementary Table 5. Presented in this way, the data suggest new functional relationships between primary and secondary responders in the E2 cascade, possibly influenced by protein–protein interactions. Here we discuss our findings generated by this systems-level analysis, focusing on E2 signaling cascade connections that we uncovered within the cell cycle, within other major cellular signaling modules, and associated with chromatin remodeling.
Figure 5.

A protein–protein interaction network of E2 signaling targets. (A) Overview of the protein–protein interaction network of E2 signaling targets. The nodes represent target genes that are E2-regulated, or harbor ERα-binding sites within 50 kb of their TSSs, or harbor MYC-binding sites within 20 kb of their TSSs (see color legend). The node size correlates with the degree of node connectivity. The edges denote protein–protein interactions derived from Human Protein Reference Database (HPRD) (Peri et al, 2003) and the BioGRID database (Stark et al, 2006). The network was visualized using Cytoscape (Shannon et al, 2003). (B, C) Expanded views of representative modules in the protein–protein interaction network of E2 signaling targets. Modules or highly connected subnetworks are identified with MCODE (Bader and Hogue, 2003). The modules shown in panels B and C are functionally related to key cellular processes involved in nucleic acid and protein metabolism. Enhancement of these functional modules may be necessary for rapid cellular growth and proliferation stimulated by E2 in breast cancer cells.
Multifaceted estrogen-mediated regulation of the cell cycle
To better understand E2-mediated signaling networks, we measured the associations of ERα and MYC gene targets with hundreds of a priori defined gene sets (such as signaling pathways and cancer gene signatures) available in databases including Gene Ontology (GO) (Ashburner et al, 2000), KEGG (Kanehisa et al, 2006), BioCarta (www.Biocarta.com), and GeneMAPP (Doniger et al, 2003) (Supplementary Table 6). The list of all transcription factor-bound sites corresponding to E2-regulated genes is provided in Supplementary Table 4, which indicates, for each E2-responsive gene, the distance to the nearest transcription factor-bound locus. Our working definition of a cis-regulatory element corresponding to a given E2-responsive gene (criteria P<0.01 for at least one time point performed at least in triplicate; see Supplementary information) was limited to a transcription factor-bound locus within 200 kb of the TSS for that gene. Our analysis indicates widespread E2-mediated direction of biochemical pathways relevant to cell survival and proliferation.
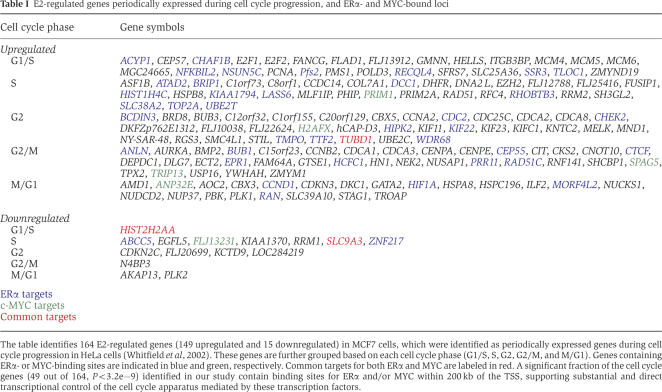
We found that ERα directly regulated genes in all phases of the cell cycle and that MYC directly regulated a different but overlapping set of factors (Supplementary Figure 6). We detected significant overlap with over 800 cell cycle genes previously described in HeLa cells (164 out of 888, P<1e−16) (Whitfield et al, 2002) (Table I). Accordingly, when our E2-responsive gene list was compared to GO categories, we found significant enrichment for terms directly connected to cell cycle progression, including ‘M phase of mitotic cell cycle,' ‘nuclear division,' and ‘DNA replication and chromosome cycle' (Supplementary Table 6).
Table 1.
 |
Prior work has focused on E2-mediated control of the cyclin D1–CDK4/CDK6 complex during G1 and on the activity of the cyclin E–CDK2 complex in the G1/S transition (Doisneau-Sixou et al, 2003; Caldon et al, 2006). Our genomic studies confirmed direct transcriptional activation of CCND1 by ERα and confirmed CDK4 as a direct target of MYC (Supplementary Figure 6). However, we also observed novel targets such as the significant downregulation of CDK6 mRNA after E2 treatment (Supplementary Table 3). Lower levels of CDK6 in breast cancer cells compared with normal mammary epithelial cells have been reported, and ectopic expression of CDK6 surprisingly inhibits proliferation of mammary epithelial cells (Lucas et al, 2004). We also observed upregulation of members of the E2F transcription factor family and of their heterodimerization partner TFDP1 (Supplementary Figure 6), and our results suggest direct transcriptional regulation of TFDP1 by ERα and MYC and regulation of E2F6 by ERα.
E2 similarly regulates the transition of G2 to M. CDC2 was significantly upregulated by E2 and ERα binding near CDC2 was detected. E2-stimulated expression and ERα binding were also detected for BUB1, which is involved in spindle checkpoint function, and E2-regulated gene expression was observed for spindle checkpoint genes BUB3, MAD2L1, CDC20, PLK1, PLK4, KNTC2, and STK6 (Supplementary Table 3). Mitotic checkpoint defects have been suggested to explain conditions of chromosomal instability (Kops et al, 2005) although mutations in those checkpoint genes are relatively uncommon in human tumors (Olesen et al, 2001). Interestingly, elevated expression of MAD2L1 and BUB1 has been correlated with advanced tumor status and poor clinical outcomes in breast cancer (van ‘t Veer et al, 2002) and neuroblastoma (Hernando et al, 2004). Levels of many mitotic checkpoint proteins are also higher in breast cancer cell lines than in normal mammary epithelial cells (Yuan et al, 2006). Similarly, we found that the gene for δ-tubulin (TUBD1), a component of centrioles and the mitotic spindle, is upregulated by E2 and the gene has nearby binding sites for both ERα and MYC. Vinca alkaloids and taxanes, which target α- and β-tubulins, are effective therapies limited by widespread toxicities to normal cells. To date, no targeted therapy has been developed for δ-tubulin.
Finally, the ras-related nuclear protein (Ran) gene is stimulated by E2 and targeted by ERα (Supplementary Table 4 and Supplementary Figure 7). RAN plays a central role in spindle assembly, nuclear envelope reassembly after mitosis, and directs the flow of proteins into and out of the cell nucleus. These results demonstrate that E2 affects the cell cycle at multiple levels.
Intersection of the estrogen cascade with cell signaling pathways
Some of the pleiotropic effects of ERα signaling are due to cross-talk with signaling pathways including those responding to growth factors and/or involving MAPK, PI3K, and PKA (Bjornstrom and Sjoberg, 2005). We investigated the extent of cross-talk between ERα signaling and many other known pathways curated in BioCarta and GenMAPP. Epidermal growth factor (EGF) signaling and insulin-like growth factor 1 (IGF-1) signaling were among the top pathways to be significantly enriched in our data set. Representative genes responsive to E2 and harboring ERα- or MYC-binding sites involved in these pathways are shown in Supplementary Tables 4 and 6.
We identified a significant enrichment of E2 target genes in the pathway of the mammalian target of rapamycin (mTOR) (Supplementary Table 6). mTOR is a conserved Ser/Thr kinase-activated protein important in the pathogenesis of cancer, cardiovascular disease, and metabolic disorders (Choo and Blenis, 2006). We detected ERα binding and significant E2-stimulated expression of the gene for RHEB, a protein that promotes TOR signaling. We detected both ERα- and MYC-binding sites near the gene for the ribosomal protein S6 kinase (RPS6KB1), a critical target of TOR signaling whose activity leads to increased protein synthesis and cell proliferation. Amplification of the region of DNA encoding this gene and overexpression of this kinase are seen in some breast cancers and are associated with poor prognosis and metastasis (van der Hage et al, 2004). These results indicate that cross-talk between E2-stimulated ERα and growth factor signaling pathways occurs at multiple levels including the regulated expression of genes essential for growth factor signaling.
Estrogen-regulated expression of chromatin factors
Epigenetic alterations play critical roles in tumorigenesis and cancer progression (Lund and van Lohuizen, 2004; Feinberg et al, 2006). We identified targets of E2 involved in many aspects of epigenetic regulation (Figure 6). Members of the Polycomb group involved in transcriptional silencing, including EZH2 and EED, both components of the Polycomb repressive complex 2 (PRC2), were upregulated by E2 (Figure 6). In addition, E2 activated the expression of other genes associated with PRC2 activity, including HDAC2, DNMT1, and HMGB1. HDAC2 has been shown to interact with EED in vivo and DNMT1 can be recruited to target genes by interacting with EZH2. The Drosophila homologue of HMGB1, Dsp1, plays an essential role in recruiting Polycomb proteins to target chromatin. Although the specific targets of Polycomb complexes in breast epithelial cells are largely unknown, the overexpression of components associated with PRC2 by E2 is intriguing because high levels of EZH2 have been associated with increased cancer cell proliferation, tumor invasiveness, and poor prognosis in breast cancer (Kleer et al, 2003).
Figure 6.

Targets of E2 signaling participate in epigenetic regulation. Targets of E2 signaling involved in epigenetic regulation of gene expression were observed. These chromatin factors include the components in Polycomb group (PcG) complexes, DNA methyltransferases and methyl-DNA-binding proteins, histone modifiers, histone chaperones, variant histones, and proteins maintaining higher-order chromatin structure. Gene expression changes upon E2 treatment are color-coded (log2-transformed fold changes). Genes for which ERα or MYC binding was detected (ChIP-chip sites) are indicated and the location of the binding site relative to the TSS is depicted (see color legend).
Histone modifiers including HDAC3 and HAT1 were E2 responsive (Figure 6) and HAT1 harbors an ERα-binding site. Two methyl-DNA-binding proteins involved in gene silencing, MeCP2 and MBD3, demonstrated E2-regulated gene expression and MeCP2 was ERα-bound. E2 regulated the histone chaperones CHAF1B, targeted by ERα, and ASF1B. CAF-1 and ASF1B cooperate to deposit histones into newly synthesized DNA at replication forks. The upregulation of these histone chaperones and DNMT1, the principal maintenance DNA methyltransferase recruited to DNA replication foci, may be necessary to regulate epigenetic inheritance of histone modifications and DNA methylation patterns in proliferating MCF7 cells in response to E2. These gene products may provide a novel epigenetic signature of cellular proliferation, as recently suggested for CHAF1B (Polo et al, 2004).
Variant histones have been suggested to produce an additional layer of epigenetic gene regulation. E2 enhanced the expression of two H2A variants, H2A.X and H2A.Z, and MYC-binding sites were detected for both genes (Figure 6). E2 also enhanced expression of several proteins involved in regulating and/or maintaining higher-order chromatin structure, including heterochromatin protein HP1α, the boundary element-binding protein CTCF, and the high-mobility group proteins HMGB1 and HMGN1 (Figure 6), suggesting active epigenetic reprogramming in breast cancer cells.
RNAi of ERα and MYC targets in MCF7 cells
We selected a subset of E2-inducible targets of ERα and MYC for functional analysis and compared these to several genes with no reported or detectable role in E2 signaling. RNAi targets also included known oncogenes, transcription factors and cofactors, and regulators of the cell cycle. RNAi-mediated depletion of ERα resulted in marked reduction in MCF7 growth, demonstrating the essential role of this receptor in the maintenance of these cells (Figure 7). RNAi-mediated depletion of MYC showed more modest effects on cell proliferation. Impaired cell proliferation was observed after RNAi of RAN, required for DNA synthesis and spindle assembly, Supervillin (SVIL), which serves as a nuclear receptor coactivator and an actin-binding protein, the transcription factor FOXA1 (discussed above), the chromatin factors GATA1 and GATA3, and the variant histone H2A.Z (Figure 7).
Figure 7.

The effect of gene knockdown on basal and E2-stimulated cell proliferation in MCF7 cells. (A) RNAi-mediated gene knockdown was performed for selected genes of interest, listed, including those that are E2-regulated, that harbor ERα- and/or MYC-binding sites, or that are implicated in the cellular response to E2. (B) The location of ChIP-identified ERα and/or MYC transcription factor-binding sites relative to the TSS of each targeted gene (A) (see color legend). Gray color indicates that no ERα- or MYC-binding region was detected within 200 kb to the TSS of the gene. (C) E2-regulated genes identified by gene expression profiling in our study are indicated (Expression), as well as genes curated in the Dragon Estrogen Responsive Genes Database (ERGDB) (Tang et al, 2004). (D) Proliferation assays in MCF7 cells after knocking down each gene from panel A using RNAi. We measured the cellular proliferation of gene-specific RNAi cells versus control cells (treated with the control siRNA) under both E2-depleted (i.e. vehicle-treated) and E2-stimulated conditions. BrdU incorporation rates are normalized to the data from RNAi control cells grown in E2-depleted conditions (error bars denote one 1 s.d.). RNAi control cells grown in 10 nM E2-treated conditions have roughly 1.5-fold higher proliferation rates than those in E2-depleted conditions. One-way ANOVA was applied to test the significance of the proliferation changes for RNAi knockdown cells versus the RNAi control cells under hormone-stimulated or basal conditions. **P<0.01, *P<0.05.
Reduction in cell proliferation ranged from minor but statistically significant effects to nearly complete loss of cell growth. In most cases, the inhibition of cell proliferation was observed in both E2-stimulated and vehicle-treated MCF7 cells and some E2-dependent growth enhancement was preserved. These results are consistent with our observation that E2-stimulated proliferation is mediated by genes in multiple pathways, in series and in parallel, such that elimination of any single gene product may not entirely ablate the proliferative response.
Histone variant H2A.Z as a novel epigenetic marker of breast cancer progression
GATA3 and FOXA1 expressions have been shown to correlate with breast cancer response to therapy and overall patient survival (Lacroix and Leclercq, 2004; Mehra et al, 2005). We reasoned that some of the gene targets that we identified may similarly serve as useful prognostic tools. In particular, we were interested in focusing on chromatin remodeling factors because of the proposed role in epigenetic dysregulation in cancer progression (Lund and van Lohuizen, 2004; Feinberg et al, 2006). We therefore investigated the E2-stimulated gene for histone variant H2A.Z which was bound by MYC in our ChIP-chip assay and which demonstrated a statistically significant effect on cellular proliferation in the RNAi screen (Figure 7). Furthermore, H2A.Z has never been reported to play a role in oncogenesis although previous studies have implicated it in chromatin remodeling, genomic stability, chromosome segregation, and gene transcription (Adam et al, 2001).
The H2A.Z gene promoter harbors two adjacent canonical E-boxes (CACGTG) bound by MYC (Figure 8A). ChIP-PCR confirmed that MYC is recruited to the H2A.Z promoter after E2 treatment (Figure 8B), leading to increased gene and protein expression in MCF7 cells (Figure 8C). Thus, H2A.Z is induced by E2 partly via the activation of MYC.
Figure 8.

H2A.Z is a target of the E2 cascade and is associated with breast cancer progression. (A) The H2A.Z promoter harbors two canonical E-boxes (5′-CACGTG-3′), which serve as MYC response elements. (B) ChIP-PCR demonstrates that MYC is recruited to the H2A.Z promoter in MCF7 cells after E2 (10 nM) exposure. (C) Western blot demonstrates the induction of H2A.Z protein level in MCF7 cells in response to E2 (10 nM). (D) Immunohistochemical staining of tissue arrays for H2A.Z protein. Tissue microarrays were stained with an antibody specific for H2A.Z (brown and arrows) and counterstained with hematoxylin (blue and arrowheads). Three representative tumor samples with differing H2A.Z protein levels are shown (from upper to lower panel: low, moderate, and high staining). For each tissue shown on the left (× 60 magnification), the inset is highlighted in the corresponding right panel (× 180 magnification). (E) Kaplan–Meier curves of overall patient survival for 517 breast cancer patients with corresponding variations in H2A.Z tumor expression (low (L): 98 patients; moderate (M): 326 patients; and high (H): 93 patients). The P-value is calculated based on the log-rank test.
We next interrogated a primary breast tumor-containing tissue array representing over 500 unique samples (Figure 8D). The intensity of H2A.Z immunostaining in these samples was highly correlated with the presence of metastasis to lymph nodes (Table II) and decreased patient survival demonstrated by the Kaplan–Meier survival analysis (Figure 8E). Similar results were observed when H2A.Z protein levels were analyzed using a newly established tissue microarray staining and scoring technology (Camp et al, 2002), as well as when measuring H2A.Z mRNA levels using an independent cohort of 295 tumor samples from a published transcriptome study (van de Vijver et al, 2002) (Supplementary Figure 7).
Table 2.
High H2A.Z expression is an independent marker associated with decreased patient survival
| Variable | Univariate analysis |
Multivariate analysis |
||
|---|---|---|---|---|
| Hazard ratio (95% CI) | P-value | Hazard ratio (95% CI) | P-value | |
| Nodal status | <0.0001 | <0.0001 | ||
| Positive | 2.31 (1.82–2.96) | 2.03 (1.52–2.73) | ||
| Nuclear grade | 0.0018 | 0.38 | ||
| High (3/3) | 1.52 (1.17–1.96) | 1.14 (0.84–1.53) | ||
| H2A.Z expression | 0.0004 | 0.027 | ||
| High | 1.73 (1.29–2.31) | 1.44 (1.04–1.97) | ||
| E2 receptor status | 0.060 | 0.63 | ||
| Negative (0/3) | 1.25 (1.00–1.59) | 1.07 (0.81–1.42) | ||
| Progesterone receptor status | 0.042 | 0.20 | ||
| Negative (0/3) | 1.28 (1.01–1.62) | 1.20 (0.91–1.59) | ||
| HER2/neu status | 0.19 | 0.052 | ||
| Positive (2–3/3) | 1.23 (0.90–1.65) | 1.45 (1.00–2.06) | ||
| Tumor size (per cm) | 1.15 (1.10–1.20) | <0.0001 | 1.10 (1.04–1.16) | 0.0010 |
CI, confidence interval.
Univariate and multivariate analyses of overall breast cancer patient survival were performed based on Cox proportional-hazards regression models. Hazard ratios with 95% CIs are indicated. Statistically significant observations (P<0.05) are in boldface.
The predictive value of H2A.Z protein expression on breast cancer survival was assessed by univariate and multivariate analyses based on Cox proportional-hazards regression models (Table II). Univariate analysis confirmed that high expression of H2A.Z is significantly associated with shortened overall survival. The multivariate analysis showed that H2A.Z expression is retained as an independent predictor of survival and provides significant prognostic information independent of standard clinicopathologic measures. Because H2A.Z expression remained significant in a multivariate analysis with factors including lymph node status, grade, and tumor size, it added prognostic information beyond what these factors alone provide.
Discussion
This integrated analysis of genome-wide transcription factor-binding sites combined with comprehensive gene expression profiling data sets enabled the identification of direct gene targets for ERα and MYC, both mediators of the E2 proliferative response. Overlay of these data with protein–protein interaction maps and GO annotation revealed enrichment for several biological modules. RNAi, when combined with cell proliferation assays, enabled confirmation of functional contributors to the E2-stimulated proliferative response. Complete genome coverage enabled powerful bioinformatic analyses to detect enriched sequence motifs within the identified regulatory regions.
A significant fraction of ERα-binding sites (nearly 80%) were located greater than 10 kb from any annotated TSS. Nye et al (2002) demonstrated that ERα displays the ability to alter large-scale chromatin structure when tethered or directly bound to DNA (Nye et al, 2002). Together, these observations imply long-range interactions between ERα regulatory regions and target promoters, closely tied to higher-order chromatin conformational changes (such as chromatin decondensation, compaction, and territory formation). Some chromatin changes are initiated by unliganded ERα (Apo-ERα) and may maintain targets in a state that is poised for rapid gene activation once stimulated by E2 (Metivier et al, 2004).
Large-scale processive/propagated changes in chromatin structure (i.e. chromatin opening) have yet to be shown to independently activate gene transcription in mammalian cells but may potentiate additional gene activation events. Alternatively, distant binding sites may physically participate in coregulator recruitment to target promoters via DNA linking or looping (Bulger and Groudine, 1999). A recent study showed that half of conserved noncoding elements with great regulatory potential were located more than 250 kb away from their associated genes (Vavouri et al, 2006). Long-range intrachromosomal, or recently characterized interchromosomal, interactions may contribute to regulatory complexity in higher eukaryotes (Spilianakis et al, 2005; Ling et al, 2006).
Importantly, our analysis shows that fewer than half of chromatin fragments associated with ERα contain near-consensus ERE sequences. This result suggests that the majority of chromatin regions targeted by ERα consist of cis-regulatory modules wherein ERα is tethered to DNA by interacting transcription factors or binds to highly variant EREs.
Our data extend the current understanding of E2-mediated regulation of the cell cycle by significantly expanding the list of direct and indirect targets of ERα and MYC whose products participate in diverse cellular pathways relevant to cancer cell proliferation and viability. We intend to pursue our characterization of newly defined gene targets of ERα and MYC with a view to better characterizing the essential participants that support oncogenesis, metastasis, and resistance to hormonal therapy and chemotherapy. Our approach will continue to include widespread functional analysis of candidate genes using RNAi in proliferation assays; promising candidates can then be tested using primary tumor samples from tissue arrays.
Blocking the ERα pathway with antiestrogens provides an important therapy in the management of receptor-positive cancers, including ∼70% of breast cancers. Unfortunately, this therapy is hindered by the subsequent development of tumors resistant to antiestrogen treatment, a process that can involve an E2-autonomous MYC (Rodrik et al, 2005). However, resistance to antiestrogens also appears to be mediated via bidirectional cross-talk between liganded or apo-ERα and participants in the intracellular signaling cascades engendered by growth factor receptors such as Her-2/neu (ERBB2) (Schiff et al, 2005). Previous studies suggest that the full mitogenic effects of polypeptide growth factors such as EGF, IGF-I, and TGF-α in some cells require the presence of a functional ERα (Curtis et al, 1996). Our data indicate an additional level of cross-talk between E2 and growth factors: many genes for participants in growth factor signal transduction cascades are directly regulated by ERα and/or MYC (Supplementary Table 6).
Because of the heterogeneity of tumor gene expression signatures (Pan et al, 2005), and the poor correlation between tumor gene signatures and genes mechanistically essential for tumorigenesis, it has been difficult to identify gene targets that might enable the development of new cancer therapies (Ein-Dor et al, 2005). Our integrated analysis of ERα and MYC permitted rapid identification of the mechanism of H2A.Z induction by E2 in breast cancer cells and motivated quantitation of this chromatin protein in primary breast tumors. H2A.Z is a novel target of E2 action in breast cancer cells, correlates with aggressiveness of the tumor, and may serve as an important prognostic marker when assessing primary tumors as well as a target for directed therapy. The observed association between H2A.Z overexpression and poor clinical outcomes implies that a variant histone replacement pattern is a marker for, and possibly a cause of, increased tumor aggressiveness.
Although MYC stimulates H2A.Z expression (Figure 8A–C), H2A.Z protein has been reported to downregulate the expression of c-myc in a promyelocytic cell line in a process that provokes RNA polymerase II stalling at the gene promoter (Farris et al, 2005). This effect is reversible upon replacement of H2A.Z with the core histone H2A. These data suggest the potential for feedback regulatory loops between MYC and H2A.Z gene expression. H2A.Z was recently shown to mediate localization of genes to the nuclear periphery in a process that may confer memory of previous transcriptional states to promote rapid gene reactivation (Brickner et al, 2007). In addition, H2A.Z participates in the CTCF-containing boundary/insulator complex (Yusufzai et al, 2004). It is thus intriguing to note that, in MCF7 cells, E2-stimulated expression and ERα binding was detected for the CTCF gene, which, in turn, regulates MYC gene expression and can inhibit apoptosis (Docquier et al, 2005). Complex patterns of feedback regulation, or dysregulation, between these players may help dictate the proliferative phenotype in some breast cancer cells. The factors that determine H2A.Z placement throughout the mammalian genome are not well characterized.
Finally, GATA3 and ERα were recently shown to participate directly in reciprocal positive regulatory loops (Eeckhoute et al, 2007), and clinical studies indicate that GATA3 is a good prognostic marker and predicts hormone responsiveness in breast tumors (Mehra et al, 2005). The significant enrichment of binding motifs of GATA family transcription factors in ERα-bound regions supports a hypothesis of transcription factor synergy in breast cancer cells. We found that a significant number of GATA3-induced genes in human 293T cells (Usary et al, 2004; Oh et al, 2006) are also direct targets of ERα identified by ChIP (85 out of 295, P<1e−16; data not shown). When knocking down GATA3 expression by RNAi, we observed severe proliferation defects in MCF7 cells (Figure 7), consistent with a role for GATA3 in regulating ERα production and function.
GATA3 plays an important role in establishing long-range chromatin changes during Th2 cell differentiation (Spilianakis and Flavell, 2004). These observations suggest that GATA3 may modulate ERα regulatory activity on a subset of genes essential for cellular proliferation, possibly via modifying regional chromatin. The power to detect cis-regulatory modules acting at important genomic loci should pave the way to developing new diagnostic and therapeutic strategies in oncology.
Materials and methods
Cell culture
MCF7 cells (ATCC) were grown as described (Carroll et al, 2005) and cells were changed to E2-depleted, phenol-free media for 72 h before E2 treatments.
Reverse transfection with siRNAs
Reverse transfection with Dharmafect (Dharmacon) was carried out by using 50 nM of control or gene-specific siRNA in each well of a 96-well plate and 5000 cells/well according to the manufacturer's protocol. Cells were treated with 1 nM E2 or vehicle for 24 h. Gene-specific siRNA oligonucleotide sequences are listed in Supplementary information.
Cell proliferation and BrdU incorporation assays
Cellular proliferation was measured using 5-bromo-2′-deoxyuridine (BrdU) incorporation into DNA of replicating cells. The BrdU assay was performed using an enzyme-linked immunosorbent assay-based chemiluminescent kit (Roche) according to the manufacturer's protocol.
Western blotting
Cell lysates in 1% SDS lysis buffer were quantified using the Micro BCA Protein Assay Kit (Pierce), and 40 mg of total protein per well was separated by SDS–PAGE, transferred to PVDF membranes, and probed with antibodies against H2A.Z (Upstate, no. 07-594 at 1:5000) or loading control β-actin (Abcam, ab6276 at 1:10 000). Secondary antibodies (conjugated with horseradish peroxidase) were incubated at a dilution of 1:3000, and blots were developed using Amersham ECL Plus™ Western Blotting Detection Reagents according to the manufacturer's protocol (GE Healthcare).
Gene expression profiling
Gene expression profiling and analysis were performed as described previously (Rifkin et al, 2003). Briefly, total RNA was isolated using Trizol (Invitrogen) according to the manufacturer's instructions. Poly-A mRNA was purified from total RNA and cDNAs were prepared from 2 mg poly-A RNA and labeled using the Powerscript fluorescent labeling kit (BD Biosciences) and monofunctional Cy3 and Cy5 dyes (Amersham/Pharmacia) as per the manufacturer's protocol. The OHU21K human oligonucleotide array (Yale's Keck Facility) was hybridized at 64°C in a hybridization buffer consisting of 2.83 × SSC, 0.5 mg/μl polyadenylic acid (Sigma), and 0.18% SDS. The arrays were washed and scanned in an Axon 4000 array scanner as described previously (Rifkin et al, 2003). Each hormone treatment was performed at least three times and hybridizations included dye swaps. Data analysis using MAANOVA and WinABAGEL v.3.6 are described in Supplementary information.
ChIP-chip experiments
MCF7 cells were E2-deprived for 3 days and then were treated with 10 nM E2 (45 min and 2 h for mapping ERα- and MYC-binding sites, respectively) at 80% confluence. An E2 exposure for 45 min has been demonstrated to produce maximal ERα binding to chromatin (Shang et al, 2000; Carroll et al, 2005). ∼5 × 10⁶ cells per ChIP were crosslinked with 1% formaldehyde for 10 min at 37°C and then quenched with 125 mM glycine. The cells were washed with cold PBS and scraped into PBS with protease inhibitors (Roche). Cell pellets were resuspended in ChIP lysis buffer (1% SDS, 10 mM EDTA, 50 mM Tris–HCl (pH 8.1)) and sonicated (Fisher Sonic Dysmembrinator). The sheared chromatin was submitted to a clarification spin and the supernatant then used for ChIP or reserved as ‘input'. Antibodies used were anti-ERα (Ab-1, Ab-3, and AB-10; Lab Vision), anti-ERα (MC-20), anti-MYC (N-262), normal rabbit IgG (sc-2027) (all Santa Cruz), and mouse IgG (Upstate, no. 12-371). For ChIP-PCR assays, forward and reverse primer sequences in the H2A.Z promoter were 5′-GCTACATACCGAGGAGACTTCA-3′ and 5′-AGGGAAGAAACAGAGCGAGCTA-3′. For ChIP-chip, both ChIP DNA and input DNA were subjected to the linker-mediated amplification and ChIP and input DNA samples were further fragmented with DNase I and then end-labeled with biotin. The resulting samples were hybridized to Affymetrix GeneChip® Human Tiling 2.0R Arrays as per the Affymetrix® ChIP protocol. Independent biological triplicates were performed for each transcription factor and for the control (input). Data analysis is described in Supplementary information.
Tissue array immunohistochemistry
Detailed description of the multiple tumor tissue array design, immunohistochemistry scoring, and data analysis is provided in Supplementary information. Briefly, for immunohistochemistry, tissue array slides were deparaffinized by rinsing with xylene, followed by two washes with 100% EtOH and two washes with water. The slides were then boiled in sodium citrate buffer (pH 6.0) for antigen retrieval. To block endogenous peroxidase activity, the slides were incubated with 2.5% hydrogen peroxide in methanol for 30 min at room temperature. The slides were then washed with Tris-buffered saline (TBS), incubated in 0.3% BSA/1 × TBS for 30 min at room temperature to reduce nonspecific background, and then stained with antibody against H2A.Z (Upstate, no. 07-594) at 1:5000 dilution in BSA/TBS at 4°C overnight. The slides were rinsed three times in 1 × TBS/0.05% Tween 20. Bound antibody was detected by applying anti-rabbit horseradish peroxidase-labeled polymer secondary antibody from the DAKO EnVision kit. The slides were washed with 1 × TBS/0.05% Tween 20 and incubated for 10 min in 3,3′-diaminobenzidine in buffered substrate (Dako). Counterstaining was performed with hematoxylin and slides were mounted with Immunomount (Shandon).
Supplementary Material
Supplementary Information
Supplementary Table 1
Supplementary Table 2
Supplementary Table 3
Supplementary Table 4
Supplementary Table 5
Supplementary Table 6
Acknowledgments
We are grateful to M Kauer, Z Gauhar, and R Kittler for critical reading of the manuscript, to L Charette for assistance with the tissue microarrays, to S Westman and S Mane for support of Affymetrix array hybridization and scanning, and to C Perou for providing GATA3 target gene list. This research was supported by grants to KPW from the WM Keck Foundation, the Arnold and Mabel Beckman Foundation, and the NIH. CBK was supported by grants from the ASRM, the RSDP (NIH-5K12HD00849), and the Society for Gynecologic Investigation.
References
- Adam M, Robert F, Larochelle M, Gaudreau L (2001) H2A.Z is required for global chromatin integrity and for recruitment of RNA polymerase II under specific conditions. Mol Cell Biol 21: 6270–6279 [DOI] [PMC free article] [PubMed] [Google Scholar]
- Ashburner M, Ball CA, Blake JA, Botstein D, Butler H, Cherry JM, Davis AP, Dolinski K, Dwight SS, Eppig JT, Harris MA, Hill DP, Issel-Tarver L, Kasarskis A, Lewis S, Matese JC, Richardson JE, Ringwald M, Rubin GM, Sherlock G (2000) Gene ontology: tool for the unification of biology. The Gene Ontology Consortium. Nat Genet 25: 25–29 [DOI] [PMC free article] [PubMed] [Google Scholar]
- Bader GD, Hogue CW (2003) An automated method for finding molecular complexes in large protein interaction networks. BMC Bioinformatics 4: 2. [DOI] [PMC free article] [PubMed] [Google Scholar]
- Bjornstrom L, Sjoberg M (2005) Mechanisms of estrogen receptor signaling: convergence of genomic and nongenomic actions on target genes. Mol Endocrinol 19: 833–842 [DOI] [PubMed] [Google Scholar]
- Brickner DG, Cajigas I, Fondufe-Mittendorf Y, Ahmed S, Lee PC, Widom J, Brickner JH (2007) H2A.Z-mediated localization of genes at the nuclear periphery confers epigenetic memory of previous transcriptional state. PLoS Biol 5: e81. [DOI] [PMC free article] [PubMed] [Google Scholar]
- Bulger M, Groudine M (1999) Looping versus linking: toward a model for long-distance gene activation. Genes Dev 13: 2465–2477 [DOI] [PubMed] [Google Scholar]
- Caldon CE, Daly RJ, Sutherland RL, Musgrove EA (2006) Cell cycle control in breast cancer cells. J Cell Biochem 97: 261–274 [DOI] [PubMed] [Google Scholar]
- Camp RL, Chung GG, Rimm DL (2002) Automated subcellular localization and quantification of protein expression in tissue microarrays. Nat Med 8: 1323–1327 [DOI] [PubMed] [Google Scholar]
- Carroll JS, Liu XS, Brodsky AS, Li W, Meyer CA, Szary AJ, Eeckhoute J, Shao W, Hestermann EV, Geistlinger TR, Fox EA, Silver PA, Brown M (2005) Chromosome-wide mapping of estrogen receptor binding reveals long-range regulation requiring the forkhead protein FoxA1. Cell 122: 33–43 [DOI] [PubMed] [Google Scholar]
- Carroll JS, Meyer CA, Song J, Li W, Geistlinger TR, Eeckhoute J, Brodsky AS, Keeton EK, Fertuck KC, Hall GF, Wang Q, Bekiranov S, Sementchenko V, Fox EA, Silver PA, Gingeras TR, Liu XS, Brown M (2006) Genome-wide analysis of estrogen receptor binding sites. Nat Genet 38: 1289–1297 [DOI] [PubMed] [Google Scholar]
- Cawley S, Bekiranov S, Ng HH, Kapranov P, Sekinger EA, Kampa D, Piccolboni A, Sementchenko V, Cheng J, Williams AJ, Wheeler R, Wong B, Drenkow J, Yamanaka M, Patel S, Brubaker S, Tammana H, Helt G, Struhl K, Gingeras TR (2004) Unbiased mapping of transcription factor binding sites along human chromosomes 21 and 22 points to widespread regulation of noncoding RNAs. Cell 116: 499–509 [DOI] [PubMed] [Google Scholar]
- Cheng AS, Jin VX, Fan M, Smith LT, Liyanarachchi S, Yan PS, Leu YW, Chan MW, Plass C, Nephew KP, Davuluri RV, Huang TH (2006) Combinatorial analysis of transcription factor partners reveals recruitment of c-MYC to estrogen receptor-alpha responsive promoters. Mol Cell 21: 393–404 [DOI] [PubMed] [Google Scholar]
- Cheung E, Acevedo ML, Cole PA, Kraus WL (2005) Altered pharmacology and distinct coactivator usage for estrogen receptor-dependent transcription through activating protein-1. Proc Natl Acad Sci USA 102: 559–564 [DOI] [PMC free article] [PubMed] [Google Scholar]
- Choo AY, Blenis J (2006) TORgeting oncogene addiction for cancer therapy. Cancer Cell 9: 77–79 [DOI] [PubMed] [Google Scholar]
- Curtis SW, Washburn T, Sewall C, DiAugustine R, Lindzey J, Couse JF, Korach KS (1996) Physiological coupling of growth factor and steroid receptor signaling pathways: estrogen receptor knockout mice lack estrogen-like response to epidermal growth factor. Proc Natl Acad Sci USA 93: 12626–12630 [DOI] [PMC free article] [PubMed] [Google Scholar]
- Docquier F, Farrar D, D'Arcy V, Chernukhin I, Robinson AF, Loukinov D, Vatolin S, Pack S, Mackay A, Harris RA, Dorricott H, O'Hare MJ, Lobanenkov V, Klenova E (2005) Heightened expression of CTCF in breast cancer cells is associated with resistance to apoptosis. Cancer Res 65: 5112–5122 [DOI] [PubMed] [Google Scholar]
- Doisneau-Sixou SF, Sergio CM, Carroll JS, Hui R, Musgrove EA, Sutherland RL (2003) Estrogen and antiestrogen regulation of cell cycle progression in breast cancer cells. Endocr Relat Cancer 10: 179–186 [DOI] [PubMed] [Google Scholar]
- Doniger SW, Salomonis N, Dahlquist KD, Vranizan K, Lawlor SC, Conklin BR (2003) MAPPFinder: using Gene Ontology and GenMAPP to create a global gene-expression profile from microarray data. Genome Biol 4: R7. [DOI] [PMC free article] [PubMed] [Google Scholar]
- Dubik D, Shiu RP (1992) Mechanism of estrogen activation of c-myc oncogene expression. Oncogene 7: 1587–1594 [PubMed] [Google Scholar]
- Eeckhoute J, Keeton EK, Lupien M, Krum SA, Carroll JS, Brown M (2007) Positive cross-regulatory loop ties GATA-3 to estrogen receptor alpha expression in breast cancer. Cancer Res 67: 6477–6483 [DOI] [PubMed] [Google Scholar]
- Ein-Dor L, Kela I, Getz G, Givol D, Domany E (2005) Outcome signature genes in breast cancer: is there a unique set? Bioinformatics 21: 171–178 [DOI] [PubMed] [Google Scholar]
- Fan C, Oh DS, Wessels L, Weigelt B, Nuyten DS, Nobel AB, van't Veer LJ, Perou CM (2006) Concordance among gene-expression-based predictors for breast cancer. N Engl J Med 355: 560–569 [DOI] [PubMed] [Google Scholar]
- Farris SD, Rubio ED, Moon JJ, Gombert WM, Nelson BH, Krumm A (2005) Transcription-induced chromatin remodeling at the c-myc gene involves the local exchange of histone H2A.Z. J Biol Chem 280: 25298–25303 [DOI] [PubMed] [Google Scholar]
- Feinberg AP, Ohlsson R, Henikoff S (2006) The epigenetic progenitor origin of human cancer. Nat Rev Genet 7: 21–33 [DOI] [PubMed] [Google Scholar]
- Fernandez PC, Frank SR, Wang L, Schroeder M, Liu S, Greene J, Cocito A, Amati B (2003) Genomic targets of the human c-Myc protein. Genes Dev 17: 1115–1129 [DOI] [PMC free article] [PubMed] [Google Scholar]
- Frasor J, Danes JM, Komm B, Chang KC, Lyttle CR, Katzenellenbogen BS (2003) Profiling of estrogen up- and down-regulated gene expression in human breast cancer cells: insights into gene networks and pathways underlying estrogenic control of proliferation and cell phenotype. Endocrinology 144: 4562–4574 [DOI] [PubMed] [Google Scholar]
- Gao F, Foat BC, Bussemaker HJ (2004) Defining transcriptional networks through integrative modeling of mRNA expression and transcription factor binding data. BMC Bioinformatics 5: 31. [DOI] [PMC free article] [PubMed] [Google Scholar]
- Group EBCTC (1998) Tamoxifen for early breast cancer: an overview of the randomised trials. Early Breast Cancer Trialists' Collaborative Group. Lancet 351: 1451–1467 [PubMed] [Google Scholar]
- Harbison CT, Gordon DB, Lee TI, Rinaldi NJ, Macisaac KD, Danford TW, Hannett NM, Tagne JB, Reynolds DB, Yoo J, Jennings EG, Zeitlinger J, Pokholok DK, Kellis M, Rolfe PA, Takusagawa KT, Lander ES, Gifford DK, Fraenkel E, Young RA (2004) Transcriptional regulatory code of a eukaryotic genome. Nature 431: 99–104 [DOI] [PMC free article] [PubMed] [Google Scholar]
- Hernando E, Nahle Z, Juan G, Diaz-Rodriguez E, Alaminos M, Hemann M, Michel L, Mittal V, Gerald W, Benezra R, Lowe SW, Cordon-Cardo C (2004) Rb inactivation promotes genomic instability by uncoupling cell cycle progression from mitotic control. Nature 430: 797–802 [DOI] [PubMed] [Google Scholar]
- Jeng MH, Shupnik MA, Bender TP, Westin EH, Bandyopadhyay D, Kumar R, Masamura S, Santen RJ (1998) Estrogen receptor expression and function in long-term estrogen-deprived human breast cancer cells. Endocrinology 139: 4164–4174 [DOI] [PubMed] [Google Scholar]
- Kanehisa M, Goto S, Hattori M, Aoki-Kinoshita KF, Itoh M, Kawashima S, Katayama T, Araki M, Hirakawa M (2006) From genomics to chemical genomics: new developments in KEGG. Nucleic Acids Res 34: D354–D357 [DOI] [PMC free article] [PubMed] [Google Scholar]
- Keightley PD, Lercher MJ, Eyre-Walker A (2005) Evidence for widespread degradation of gene control regions in hominid genomes. PLoS Biol 3: e42. [DOI] [PMC free article] [PubMed] [Google Scholar]
- Kleer CG, Cao Q, Varambally S, Shen R, Ota I, Tomlins SA, Ghosh D, Sewalt RG, Otte AP, Hayes DF, Sabel MS, Livant D, Weiss SJ, Rubin MA, Chinnaiyan AM (2003) EZH2 is a marker of aggressive breast cancer and promotes neoplastic transformation of breast epithelial cells. Proc Natl Acad Sci USA 100: 11606–11611 [DOI] [PMC free article] [PubMed] [Google Scholar]
- Kops GJ, Weaver BA, Cleveland DW (2005) On the road to cancer: aneuploidy and the mitotic checkpoint. Nat Rev Cancer 5: 773–785 [DOI] [PubMed] [Google Scholar]
- Lacroix M, Leclercq G (2004) About GATA3, HNF3A, and XBP1, three genes co-expressed with the oestrogen receptor-alpha gene (ESR1) in breast cancer. Mol Cell Endocrinol 219: 1–7 [DOI] [PubMed] [Google Scholar]
- Laganiere J, Deblois G, Lefebvre C, Bataille AR, Robert F, Giguere V (2005) Location analysis of estrogen receptor alpha target promoters reveals that FOXA1 defines a domain of the estrogen response. Proc Natl Acad Sci USA 102: 11651–11656 [DOI] [PMC free article] [PubMed] [Google Scholar]
- Ling JQ, Li T, Hu JF, Vu TH, Chen HL, Qiu XW, Cherry AM, Hoffman AR (2006) CTCF mediates interchromosomal colocalization between Igf2/H19 and Wsb1/Nf1. Science 312: 269–272 [DOI] [PubMed] [Google Scholar]
- Lucas JJ, Domenico J, Gelfand EW (2004) Cyclin-dependent kinase 6 inhibits proliferation of human mammary epithelial cells. Mol Cancer Res 2: 105–114 [PubMed] [Google Scholar]
- Lund AH, van Lohuizen M (2004) Epigenetics and cancer. Genes Dev 18: 2315–2335 [DOI] [PubMed] [Google Scholar]
- Mao DY, Watson JD, Yan PS, Barsyte-Lovejoy D, Khosravi F, Wong WW, Farnham PJ, Huang TH, Penn LZ (2003) Analysis of Myc bound loci identified by CpG island arrays shows that Max is essential for Myc-dependent repression. Curr Biol 13: 882–886 [DOI] [PubMed] [Google Scholar]
- Mehra R, Varambally S, Ding L, Shen R, Sabel MS, Ghosh D, Chinnaiyan AM, Kleer CG (2005) Identification of GATA3 as a breast cancer prognostic marker by global gene expression meta-analysis. Cancer Res 65: 11259–11264 [DOI] [PubMed] [Google Scholar]
- Metivier R, Penot G, Carmouche RP, Hubner MR, Reid G, Denger S, Manu D, Brand H, Kos M, Benes V, Gannon F (2004) Transcriptional complexes engaged by apo-estrogen receptor-alpha isoforms have divergent outcomes. EMBO J 23: 3653–3666 [DOI] [PMC free article] [PubMed] [Google Scholar]
- Nye AC, Rajendran RR, Stenoien DL, Mancini MA, Katzenellenbogen BS, Belmont AS (2002) Alteration of large-scale chromatin structure by estrogen receptor. Mol Cell Biol 22: 3437–3449 [DOI] [PMC free article] [PubMed] [Google Scholar]
- Oh DS, Troester MA, Usary J, Hu Z, He X, Fan C, Wu J, Carey LA, Perou CM (2006) Estrogen-regulated genes predict survival in hormone receptor-positive breast cancers. J Clin Oncol 24: 1656–1664 [DOI] [PubMed] [Google Scholar]
- Olesen SH, Thykjaer T, Orntoft TF (2001) Mitotic checkpoint genes hBUB1, hBUB1B, hBUB3 and TTK in human bladder cancer, screening for mutations and loss of heterozygosity. Carcinogenesis 22: 813–815 [DOI] [PubMed] [Google Scholar]
- Pan KH, Lih CJ, Cohen SN (2005) Effects of threshold choice on biological conclusions reached during analysis of gene expression by DNA microarrays. Proc Natl Acad Sci USA 102: 8961–8965 [DOI] [PMC free article] [PubMed] [Google Scholar]
- Peri S, Navarro JD, Amanchy R, Kristiansen TZ, Jonnalagadda CK, Surendranath V, Niranjan V, Muthusamy B, Gandhi TK, Gronborg M, Ibarrola N, Deshpande N, Shanker K, Shivashankar HN, Rashmi BP, Ramya MA, Zhao Z, Chandrika KN, Padma N, Harsha HC et al. (2003) Development of human protein reference database as an initial platform for approaching systems biology in humans. Genome Res 13: 2363–2371 [DOI] [PMC free article] [PubMed] [Google Scholar]
- Perou CM, Jeffrey SS, van de Rijn M, Rees CA, Eisen MB, Ross DT, Pergamenschikov A, Williams CF, Zhu SX, Lee JC, Lashkari D, Shalon D, Brown PO, Botstein D (1999) Distinctive gene expression patterns in human mammary epithelial cells and breast cancers. Proc Natl Acad Sci USA 96: 9212–9217 [DOI] [PMC free article] [PubMed] [Google Scholar]
- Polo SE, Theocharis SE, Klijanienko J, Savignoni A, Asselain B, Vielh P, Almouzni G (2004) Chromatin assembly factor-1, a marker of clinical value to distinguish quiescent from proliferating cells. Cancer Res 64: 2371–2381 [DOI] [PubMed] [Google Scholar]
- Ponzielli R, Katz S, Barsyte-Lovejoy D, Penn LZ (2005) Cancer therapeutics: targeting the dark side of Myc. Eur J Cancer 41: 2485–2501 [DOI] [PubMed] [Google Scholar]
- Rifkin SA, Kim J, White KP (2003) Evolution of gene expression in the Drosophila melanogaster subgroup. Nat Genet 33: 138–144 [DOI] [PubMed] [Google Scholar]
- Rodrik V, Zheng Y, Harrow F, Chen Y, Foster DA (2005) Survival signals generated by estrogen and phospholipase D in MCF-7 breast cancer cells are dependent on Myc. Mol Cell Biol 25: 7917–7925 [DOI] [PMC free article] [PubMed] [Google Scholar]
- Schiff R, Massarweh SA, Shou J, Bharwani L, Arpino G, Rimawi M, Osborne CK (2005) Advanced concepts in estrogen receptor biology and breast cancer endocrine resistance: implicated role of growth factor signaling and estrogen receptor coregulators. Cancer Chemother Pharmacol 56 (Suppl 1): 10–20 [DOI] [PubMed] [Google Scholar]
- Shang Y, Hu X, DiRenzo J, Lazar MA, Brown M (2000) Cofactor dynamics and sufficiency in estrogen receptor-regulated transcription. Cell 103: 843–852 [DOI] [PubMed] [Google Scholar]
- Shannon P, Markiel A, Ozier O, Baliga NS, Wang JT, Ramage D, Amin N, Schwikowski B, Ideker T (2003) Cytoscape: a software environment for integrated models of biomolecular interaction networks. Genome Res 13: 2498–2504 [DOI] [PMC free article] [PubMed] [Google Scholar]
- Smith CL, O'Malley BW (2004) Coregulator function: a key to understanding tissue specificity of selective receptor modulators. Endocr Rev 25: 45–71 [DOI] [PubMed] [Google Scholar]
- Sorlie T, Perou CM, Tibshirani R, Aas T, Geisler S, Johnsen H, Hastie T, Eisen MB, van de Rijn M, Jeffrey SS, Thorsen T, Quist H, Matese JC, Brown PO, Botstein D, Eystein Lonning P, Borresen-Dale AL (2001) Gene expression patterns of breast carcinomas distinguish tumor subclasses with clinical implications. Proc Natl Acad Sci USA 98: 10869–10874 [DOI] [PMC free article] [PubMed] [Google Scholar]
- Sotiriou C, Neo SY, McShane LM, Korn EL, Long PM, Jazaeri A, Martiat P, Fox SB, Harris AL, Liu ET (2003) Breast cancer classification and prognosis based on gene expression profiles from a population-based study. Proc Natl Acad Sci USA 100: 10393–10398 [DOI] [PMC free article] [PubMed] [Google Scholar]
- Spilianakis CG, Flavell RA (2004) Long-range intrachromosomal interactions in the T helper type 2 cytokine locus. Nat Immunol 5: 1017–1027 [DOI] [PubMed] [Google Scholar]
- Spilianakis CG, Lalioti MD, Town T, Lee GR, Flavell RA (2005) Interchromosomal associations between alternatively expressed loci. Nature 435: 637–645 [DOI] [PubMed] [Google Scholar]
- Stark C, Breitkreutz BJ, Reguly T, Boucher L, Breitkreutz A, Tyers M (2006) BioGRID: a general repository for interaction datasets. Nucleic Acids Res 34: D535–D539 [DOI] [PMC free article] [PubMed] [Google Scholar]
- Tang S, Han H, Bajic VB (2004) ERGDB: estrogen responsive genes database. Nucleic Acids Res 32: D533–D536 [DOI] [PMC free article] [PubMed] [Google Scholar]
- Usary J, Llaca V, Karaca G, Presswala S, Karaca M, He X, Langerod A, Karesen R, Oh DS, Dressler LG, Lonning PE, Strausberg RL, Chanock S, Borresen-Dale AL, Perou CM (2004) Mutation of GATA3 in human breast tumors. Oncogene 23: 7669–7678 [DOI] [PubMed] [Google Scholar]
- van ‘t Veer LJ, Dai H, van de Vijver MJ, He YD, Hart AA, Mao M, Peterse HL, van der Kooy K, Marton MJ, Witteveen AT, Schreiber GJ, Kerkhoven RM, Roberts C, Linsley PS, Bernards R, Friend SH (2002) Gene expression profiling predicts clinical outcome of breast cancer. Nature 415: 530–536 [DOI] [PubMed] [Google Scholar]
- van de Vijver MJ, He YD, van't Veer LJ, Dai H, Hart AA, Voskuil DW, Schreiber GJ, Peterse JL, Roberts C, Marton MJ, Parrish M, Atsma D, Witteveen A, Glas A, Delahaye L, van der Velde T, Bartelink H, Rodenhuis S, Rutgers ET, Friend SH et al. (2002) A gene-expression signature as a predictor of survival in breast cancer. N Engl J Med 347: 1999–2009 [DOI] [PubMed] [Google Scholar]
- van der Hage JA, van den Broek LJ, Legrand C, Clahsen PC, Bosch CJ, Robanus-Maandag EC, van de Velde CJ, van de Vijver MJ (2004) Overexpression of P70 S6 kinase protein is associated with increased risk of locoregional recurrence in node-negative premenopausal early breast cancer patients. Br J Cancer 90: 1543–1550 [DOI] [PMC free article] [PubMed] [Google Scholar]
- Vavouri T, McEwen GK, Woolfe A, Gilks WR, Elgar G (2006) Defining a genomic radius for long-range enhancer action: duplicated conserved non-coding elements hold the key. Trends Genet 22: 5–10 [DOI] [PubMed] [Google Scholar]
- Webb P, Nguyen P, Valentine C, Lopez GN, Kwok GR, McInerney E, Katzenellenbogen BS, Enmark E, Gustafsson JA, Nilsson S, Kushner PJ (1999) The estrogen receptor enhances AP-1 activity by two distinct mechanisms with different requirements for receptor transactivation functions. Mol Endocrinol 13: 1672–1685 [DOI] [PubMed] [Google Scholar]
- Whitfield ML, Sherlock G, Saldanha AJ, Murray JI, Ball CA, Alexander KE, Matese JC, Perou CM, Hurt MM, Brown PO, Botstein D (2002) Identification of genes periodically expressed in the human cell cycle and their expression in tumors. Mol Biol Cell 13: 1977–2000 [DOI] [PMC free article] [PubMed] [Google Scholar]
- Yager JD, Davidson NE (2006) Estrogen carcinogenesis in breast cancer. N Engl J Med 354: 270–282 [DOI] [PubMed] [Google Scholar]
- Yuan B, Xu Y, Woo JH, Wang Y, Bae YK, Yoon DS, Wersto RP, Tully E, Wilsbach K, Gabrielson E (2006) Increased expression of mitotic checkpoint genes in breast cancer cells with chromosomal instability. Clin Cancer Res 12: 405–410 [DOI] [PubMed] [Google Scholar]
- Yusufzai TM, Tagami H, Nakatani Y, Felsenfeld G (2004) CTCF tethers an insulator to subnuclear sites, suggesting shared insulator mechanisms across species. Mol Cell 13: 291–298 [DOI] [PubMed] [Google Scholar]
Associated Data
This section collects any data citations, data availability statements, or supplementary materials included in this article.
Supplementary Materials
Supplementary Information
Supplementary Table 1
Supplementary Table 2
Supplementary Table 3
Supplementary Table 4
Supplementary Table 5
Supplementary Table 6