

Abstract
Schizophrenia is one of the most debilitating neuropsychiatric disorders, affecting 0.5–1.0% of the population worldwide. Its pathology, attributed to defects in synaptic transmission, remains elusive. The dystrobrevin-binding protein 1 (DTNBP1) gene, which encodes a coiled-coil protein, dysbindin, is a major susceptibility gene for schizophrenia. Our previous results have demonstrated that the sandy (sdy) mouse harbors a spontaneously occurring deletion in the DTNBP1 gene and expresses no dysbindin protein (Li, W., Q. Zhang, N. Oiso, E.K. Novak, R. Gautam, E.P. O'Brien, C.L. Tinsley, D.J. Blake, R.A. Spritz, N.G. Copeland, et al. 2003. Nat. Genet. 35:84–89). Here, using amperometry, whole-cell patch clamping, and electron microscopy techniques, we discovered specific defects in neurosecretion and vesicular morphology in neuroendocrine cells and hippocampal synapses at the single vesicle level in sdy mice. These defects include larger vesicle size, slower quantal vesicle release, lower release probability, and smaller total population of the readily releasable vesicle pool. These findings suggest that dysbindin functions to regulate exocytosis and vesicle biogenesis in endocrine cells and neurons. Our work also suggests a possible mechanism in the pathogenesis of schizophrenia at the synaptic level.
Introduction
Schizophrenia is one of the most devastating neuropsychiatric diseases. Pharmacological and neuropathological evidence suggests that dysfunction of dopaminergic, glutamatergic, or GABAergic transmission underlies its symptomatology (Lewis et al., 2005; Coyle, 2006; Ross et al., 2006; Snyder, 2006). Genetic epidemiological studies show that schizophrenia has a heritability of ∼80% (Cardno and Gottesman, 2000), and several putative schizophrenia-susceptibility genes have been identified (Norton et al., 2006; Ross et al., 2006). Among these, the dystrobrevin-binding protein 1 (DTNBP1) or dysbindin gene, located on chromosome 6p, is a promising candidate from schizophrenia linkage and association studies (Straub et al., 1995; Wang et al., 1995; O'Donovan et al., 2003; Schwab et al., 2003; Norton et al., 2006; Morris et al., 2008).
Compelling evidence indicates that dysbindin influences neurotransmission and so contributes to the cognitive dysfunctions in schizophrenia. In most patients with schizophrenia, the expression level of dysbindin is reduced in the hippocampus and prefrontal cortex, two regions that have long been associated with psychotic symptoms (Talbot et al., 2004; Weickert et al., 2004; Weickert et al., 2008). However, no protein coding sequence mutations of the dysbindin gene have been found (Ross et al., 2006). Knockdown of dysbindin in cultured cells affects SNAP25 expression and the extracellular glutamate or dopamine levels (Numakawa et al., 2004; Kumamoto et al., 2006). More recently, it has been shown that the sandy (sdy) mouse, which harbors a large deletion within the dysbindin gene and has no dysbindin protein expression (Li et al., 2003), has reduced dopamine levels in the cortex and hippocampus (Murotani et al., 2007). Furthermore, dysbindin is located on the synaptic vesicles, postsynaptic densities (PSDs), and microtubules of apparent glutamatergic neurons in the hippocampus. It binds to snapin (Starcevic and Dell'Angelica, 2004; Talbot et al., 2006), a SNARE-associated protein implicated in neurotransmission (Ilardi et al., 1999). The results of biochemical assays suggest that dysbindin is associated with transmitter release in a population of cultured cells (Numakawa et al., 2004; Kumamoto et al., 2006). These findings, combined with the prevailing hypothesis that schizophrenia is a subtle disease of synaptic transmission (Frankle et al., 2003; Harrison and Weinberger, 2005), prompted us to investigate the role of dysbindin in neurotransmitter release.
In the present study, using real-time measurements (electrochemical amperometry and patch clamp recording) and electron microscopy, we discovered that sdy mice had larger vesicle size, slower quantal release, fewer release events and reduced readily releasable pool (RRP) in single cells of both the adrenal gland and the hippocampus. These results reveal details of the functions of dysbindin in neurotransmitter release and may provide new insights into our understanding of the cognitive abnormalities in schizophrenia at the synaptic level.
Results
Lack of dysbindin changes kinetics of quantal vesicle release in chromaffin cells
Amperometry provides high temporal and spatial resolution in directly detecting vesicular release from various cell types (Wightman et al., 1991; Augustine and Neher, 1992; Chow et al., 1992; Artalejo et al., 1994; Albillos et al., 1997; Chen et al., 2005). Amperometric measurements have another advantage, as they detect exclusively presynaptic release without contamination from the postsynapse. Therefore, taking advantage of amperometric recordings in the adrenal slice, a physiological and widely used model for studying stimulus-secretion coupling (Moser and Neher, 1997; Barbara et al., 1998), we first determined whether dysbindin regulates the characteristics of single vesicle fusion events. Local application of high-K+ solution elicited amperometric spikes in a wild-type (WT) chromaffin cell (Fig. 1 A). Three parameters of amperometric spikes were analyzed: half-height duration (HHD) and rise time (RT), which reflect the fusion kinetics; and quantal size (Q), which reflects the vesicle content released in each spike (Fig. 1 C). The shape of spikes changed markedly, with a longer HHD (WT, 13 ± 1 ms; sdy, 20 ± 2 ms) and a larger Q (WT, 0.52 ± 0.05 pC; sdy, 0.68 ± 0.06 pC) in sdy cells (Fig. 1, B and C). However, no noticeable difference was detected in RT (WT, 3.1 ± 0.4 ms; sdy, 3.2 ± 0.3 ms). These data suggest that dysbindin plays a role in the regulation of single vesicle release kinetics and Q in chromaffin cells.
Figure 1.

Dysbindin-deficient chromaffin cells display slow release kinetics and reduced depolarization-induced secretion. (A) A typical amperometric recording in response to a 20-s stimulus of 80 mM K+ in a WT chromaffin cell. Inset shows a micrograph of a microcarbon fiber electrode (black bar) attached to a chromaffin cell in an adrenal slice during amperometric recording. (B) Averaged traces showing the change in the shape of amperometric spikes in dysbindin-deficient (sdy) mice versus WT mice. (C, left) Three kinetics variables, i.e., HHD, RT, and Q, are defined. (rightmost three panels) Quantitative analyses of HHD, RT, and Q of amperometric spikes from WT (n = 166 events, 11 cells) and sdy mice (n = 131 events, 10 cells). (D) Examples of amperometric current traces (Iamp, top), integrated current signal (∫Iampdt), and membrane current traces (Im) evoked by a 2-s depolarizing pulse from −70 to +0 mV in a WT (gray) and a sdy (black) chromaffin cell. (inset) A micrograph of combined patch-clamp and amperometric recording in a chromaffin cell. (E) Histograms show the amount of secretion (integral of amperometric signal), the number of amperometric spikes, and the amplitude of the voltage-gated Ca2+ and Na+ currents of both cell types. ICa = 324.5 ± 34.6 pA (WT) and 339 ± 40 pA (sdy). INa = 3.0 ± 0.2 nA (WT) and 2.9 ± 0.2 nA (sdy). Data from 19 WT cells and 29 sdy cells are shown. *, P < 0.05; ***, P < 0.001. Error bars indicate the mean ± SEM. Bars, 10 μm.
To test whether dysbindin also regulates the total amount and probability of release, whole-cell patch-clamped cells were stimulated by 2-s depolarization pulses, and amperometric signals and membrane currents were simultaneously monitored. Compared with WT cells, the evoked total amperometric spike charge was reduced by ∼30% in sdy cells (WT, 49 ± 8 pC; sdy, 32 ± 4 pC; Fig. 1, D and E). Similarly, sdy cells displayed a modest reduction in the number of amperometric spikes (WT, 20 ± 3 events per cell; sdy, 14 ± 1 events per cell), which suggests a decreased vesicle release probability caused by dysbindin deficiency (Fig. 1, D and E). In contrast, voltage-gated Na+ and Ca2+ currents were unaffected (Fig. 1, D and E), demonstrating that the observed secretory defects in the absence of dysbindin were not caused by changes in Ca2+ influx. Collectively, these amperometric data suggest that dysbindin regulates large dense-core vesicle (LDCV) secretion in terms of total amount of secretion, vesicular release probability, and the kinetics and size of single fusion events.
Intracellular dialysis of purified full-length dysbindin rescues the sdy phenotype of LDCV secretion
To confirm that the aforementioned phenotype in sdy mice was directly caused by the lack of dysbindin, we intracellularly applied purified full-length dysbindin protein (352 amino acids, RefSeq available from GenBank/EMBL/DDBJ under accession no. NM_025772; Fig. S1, available at http://www.jcb.org/cgi/content/full/jcb.200711021/DC1) into chromaffin cells by patch pipette. Similar to previous approaches in which dialysis of glutamate (Wu et al., 2007) or microinjection of peptide (Ilardi et al., 1999; Zhang and Zhou, 2002; Chen et al., 2005; Krapivinsky et al., 2006) for a certain amount of minutes was sufficient to regulate exocytosis in neurons or chromaffin cells, we recorded vesicle release events after dysbindin application over a period of minutes. After stable whole-cell recording was established, amperometric responses were evoked by a 2-s depolarization every 5 min for ∼30 min. The temporal effect of dysbindin dialysis on the characteristics of single amperometric spikes is shown in Fig. 2 A. Perfusion of 0.2 μg/μl dysbindin for 5 min significantly decreased the HHD and Q in sdy cells. No further difference was observed between the 5- and 10-min time points. As a control, dialysis of heat-denatured dysbindin at the same concentration failed to rescue (Fig. 2 A, gray). The mean signal curve of sdy amperometric spikes recorded after 5 and 10 min of dysbindin dialysis was similar to that of untreated WT cells, clearly showing efficient rescue of the exocytotic kinetics (Fig. 2 B). When exogenous dysbindin was applied in WT cells, no significant change in HHD, RT, or Q was found (Fig. 2 C). This suggests that higher concentrations of dysbindin, i.e., endogenous plus dialyzed dysbindin, do not affect these parameters. Collectively, these data show that dysbindin is involved in the regulation of single vesicle fusion kinetics and Q in chromaffin cells. Note, the absolute HHD times of WT or sdy were slightly different between Figs. 1 and 2, which is probably due to the different stimulation protocols (whole-cell depolarization pulse vs. high KCl application).
Figure 2.

Microdialysis of purified dysbindin protein rescues the slow kinetics and reduced Q but not the probability and total amount of release in sdy mice. (A) Time course of the effects of intracellular dysbindin (black line) or heat-denatured dysbindin (gray line) on the kinetics of amperometric spikes and Q in sdy chromaffin cells. After establishing whole-cell mode, amperometric spikes were elicited every 5 min by a 2-s depolarization from −70 to 0 mV. The first points (−) represent data before dysbindin dialysis in sdy cells. The second, third, and fourth data points correspond to 1, 5, and 10 min after establishing whole-cell recording with 0.2 μg/μl full-length dysbindin or the denatured protein in the patch pipette. Note the appearance of fast kinetics of amperometric spikes at 5 min after dysbindin dialysis and the lack of difference between 5 and 10 min. In WT control, diamond data points indicate the mean values of amperometric spikes obtained at 5 and 10 min without dysbindin treatment. n = 201 spikes (−; 13 cells, 2 sdy mice), 116 spikes (1 min; 11 cells, 2 sdy mice), 94 spikes (5 min), 81 spikes (10 min), and 193 spikes (14 cells, 2 WT mice). (B) Averaged amperometric spikes obtained at 5 and 10 min after establishing whole-cell recording in untreated WT (gray) or sdy cells without (black) or with dysbindin addition (dotted line). Each line was averaged from 100 amperometric spikes, respectively. (C) In WT cells, histograms show the quantitative analyses of single spike properties (HHD, RT, and Q) without (gray) or with (striped) 5 and 10 min of intracellular dialysis of dysbindin. Data were obtained from the same adrenal slices from two WT littermates. n = 112 spikes (9 cells, WT) and 111 spikes (11 cells, WT + dysbindin). (D) Histograms show the amount of catecholamine secretion (∫Iampdt; left), the number of amperometric events per cell (middle), and calcium currents Ica (right) in sdy cells without (black; 13 cells, 2 sdy mice) or with 5 and 10 min dysbindin dialysis (striped; 11 cells, 2 sdy mice). Error bars indicate the mean ± SEM.
Next, we determined whether dialysis of dysbindin rescued the sdy phenotypes of vesicle release probability and total amperometric spike charge. We only found a slight and insignificant increase in the number of amperometric spikes (sdy, 14 ± 1 events per cell; sdy + dysbindin, 19 ± 3 events per cell; Fig. 2 D). In addition, the total charge of amperometric spikes (sdy, 32 ± 4 pC; sdy + dysbindin, 33 ± 6 pC) remained unchanged. Likewise, there was no difference in calcium currents (sdy, 329 ± 30 pA; sdy + dysbindin, 318 ± 36 pA) in this set of experiments. This failure to rescue release probability and total amount of secretion may be due to the lack of dysbindin disrupting the biogenesis of synaptic vesicles, and its addition for a time period of minutes cannot reverse this effect.
Morphological changes in LDCVs of sdy chromaffin cells
Defects in LDCV secretion might result from changes in number, size, or spatial distribution of chromaffin vesicles. To differentiate among these possibilities, we performed electron microscopy on adrenals from WT and sdy mice. The gross morphology of sdy chromaffin cells was similar to that of the WT (Fig. 3 A). The size distribution of LDCVs in sdy mice showed an ∼10% increase in vesicle diameter (Fig. 3 B). Furthermore, counting the total number of vesicles per square micrometer revealed that the vesicle density in sdy cells was markedly lower (by ∼25%) than that of WT cells (Fig. 3 C). However, neither the number of docked vesicles, i.e., those located within 100 nm of the plasma membrane (Fig. 3 A, insets), nor the overall spatial distribution of the vesicles differed between WT and sdy cells (Fig. 3 D), which suggests that dysbindin is not required for effective docking in chromaffin cells. These defects are consistent with our electrochemical data, namely that increases in vesicle size or volume may be reflected in increases in the amount of transmitter released per vesicle (Q; provided that vesicle luminal concentration remains the same; Bruns et al., 2000; Sulzer and Edwards, 2000; Karunanithi et al., 2002), and the reduced vesicle density may contribute to the decreased vesicular release probability.
Figure 3.

Electron micrographs show larger but fewer LDCVs in the absence of dysbindin. (A) Representative electron micrographs of adrenal sections from WT (left) and sdy (right) mice. LDCVs dispersed throughout the cytoplasm in both cell types. (insets) Single morphologically docked vesicles. Bars: (top) 2 μm; (bottom) 500 nm; (insets) 400 nm. (B) Distribution of vesicle diameters shows larger vesicles in sdy cells (black) than in WT (gray). Single Gaussian fittings of the distribution are superimposed on the bar graphs. Mean vesicle diameters were 214 ± 2 nm in the WT and 238 ± 2 nm in sdy (bottom). n = 973 (WT) and 1,095 vesicles (sdy). (C) Histogram shows that the lack of dysbindin (sdy) leads to a reduced number of LDCVs per μm2 as compared with WT cells. WT, 6.6 ± 0.2 vesicles per μm2 (21 cells from two WT mice); sdy, 4.9 ± 0.1 vesicles per μm2 (19 cells from three sdy mice). (D) Distribution of distance between vesicle membrane and plasma membrane. Vesicles located within 100 nm from the plasma membrane were defined as docked vesicles. ***, P < 0.001. Error bars indicate the mean ± SEM.
Kinetics of synaptic transmission are changed in sdy hippocampus
Because the machinery for regulating exocytosis in chromaffin cells and neurons shares many features, including Ca2+ dependence and the kinetics of exocytosis (Morgan and Burgoyne, 1997), we investigated whether the lack of dysbindin alters glutamatergic transmission in ventral hippocampal CA1, a brain structure where abnormalities have been reported in schizophrenia (Weinberger, 1999). Here, the pyramidal neurons receive major excitatory inputs from Schaffer and commissural collaterals of CA3 efferents, and dysbindin expression is high (Talbot et al., 2004, 2006). We compared miniature excitatory postsynaptic currents (mEPSCs), which occur spontaneously and normally correspond to single vesicle fusion events, in ventral hippocampal CA1 pyramidal neurons of WT and sdy mice (Fig. 4 A). The amplitude of mEPSCs was not significantly different (WT, 7.4 ± 0.2 pA; sdy cells, 8.1 ± 0.6 pA; Fig. 4 B), which generally indicates that the responsiveness and number of postsynaptic receptors are not altered in the absence of dysbindin (Nicoll and Malenka, 1999). Consistent with this, the AMPA/NMDA ratio did not differ between the two genotypes (Fig. S2, available at http://www.jcb.org/cgi/content/full/jcb.200711021/DC1). In contrast, the frequency of mEPSCs, an indicator of release probability from presynaptic terminals, was reduced from 11 ± 1 events per min in the WT to 6 ± 1 events per min in sdy, as clearly shown in the cumulative frequency distribution (Fig. 4 C). Analysis of the kinetics of mEPSCs further demonstrated dramatic increases in HHD, RT, decay time constant, and charge in dysbindin-deficient cells (Fig. 4, D and E). These changes depicted slower single vesicle release kinetics but larger quanta in the absence of dysbindin. Collectively, these results suggest that dysbindin modulates the kinetics, amount, and probability of single presynaptic vesicle release in hippocampal CA1 glutamatergic synapses, just as in chromaffin cells. However, unlike in chromaffin cells, we found that the RT was affected in sdy hippocampal neurons. It is possible that this change in RT of mEPSCs is a combined pre- and postsynaptic phenomenon, whereas the quantal analysis by amperometry reflects the pure “presynaptic” release signal without contamination by postsynaptic mechanisms. It is also possible that the function of dysbindin in vesicle exocytosis may be slightly different between neuroendocrine cells and neuronal synapses.
Figure 4.

Both miniature and evoked glutamate release in hippocampal CA1 pyramidal neurons are affected in the absence of dysbindin. (A) Representative mEPSC traces from WT and sdy hippocampal neurons in the presence of 10 μM bicuculline (Bic) and 1 μM tetrodotoxin (TTX). (B) Cumulative probability of mEPSC amplitude in WT (gray) and sdy (black) mice. (inset) The quantitative results of amplitude; no difference was found between WT and sdy mice. (C) Cumulative distribution of mEPSC frequency in WT (gray) and sdy (black) mice. Inset shows that the lack of dysbindin notably decreased the mean frequency of mEPSCs. (D) Histograms display quantitative analysis of HHD, RT, and charge of mEPSCs, showing that the lack of dysbindin slows the kinetics and increases the charge of single vesicle release. Data are from 238 spikes (7 cells, WT) and 112 spikes (6 cells, sdy). (E) Analysis of decay time constant (τ) was performed on averaged mEPSCs obtained from 50 individual events. The decay time was best fitted with a single exponential function. The decay of EPSCs in sdy neurons (black) was slower than that in WT (gray). (F) Averaged evoked EPSC waveforms of WT and sdy cells from 10 traces. (G) Comparison of the amplitude, RT, charge transfer, or decay time constant (τ) of evoked EPSCs between WT (gray) and sdy (black) cells. The lack of dysbindin resulted in reduced amplitude and slower decay time without affecting the amount of release as measured by the charge transfer. Data are from 17 cells (WT) and 16 cells (sdy). *, P < 0.05; ***, P < 0.001. Error bars indicate the mean ± SEM.
Because we discovered changes in spontaneous single vesicle release, it is plausible that action potential–dependent transmitter release may also be affected. We subsequently examined the evoked EPSCs in hippocampal CA1 pyramidal neurons by stimulating Schaffer collateral axons. As shown in Fig. 4 (F and G), the absence of dysbindin caused a reduction in EPSC peak amplitude (WT, 264 ± 33 pA; sdy, 189 ± 15 pA) without affecting the charge transfer (WT, 24 ± 8 nC; sdy, 21 ± 5 nC), a measure of the total amount of glutamate release. The RT of EPSCs (WT, 17 ± 3 ms; sdy, 24 ± 3 ms) was slightly higher in sdy neurons, but the change was statistically insignificant. However, a significant increase in the decay time constant (WT, 104 ± 19 ms; sdy, 190 ± 30 ms) was found in the sdy neurons. This is consistent with the mEPSC analysis (Fig. 4, A–E), where the reduced release probability and larger quantal content compensated each other, causing the total amount of release to be unaltered. Therefore, these results indicate that the absence of dysbindin also impairs the kinetics of evoked glutamate release in hippocampal CA1.
Morphological changes in asymmetrical synapses of sdy hippocampus
Abnormal hippocampal cytoarchitecture, such as synaptic abnormalities in glutamatergic terminals, has been reported in patients with schizophrenia (Harrison and Eastwood, 2001). Because we here found several defects in glutamate vesicle release in hippocampal CA1, combined with the fact that dysbindin reduction occurs in the glutamatergic terminals of the hippocampus in schizophrenia (Talbot et al., 2004), we set out to examine the excitatory asymmetrical synapses on CA1 dendritic spines in sdy mice by electron microscopy. The overall appearance of presynaptic terminals and spines in sdy mice appeared normal and no gross defect was detected (Fig. 5 A, top). Quantitative analysis revealed that the absence of dysbindin resulted in a shift of the vesicle distribution to ∼10% larger size, averaging 43.8 ± 0.1 nm (WT) and 46.9 ± 0.1 nm (sdy; Fig. 5 B). In an attempt to understand whether dysbindin functions in different vesicle pools, we counted the numbers of vesicles in a docked state, those immediately (∼50 nm) next to the active zone membrane (Fig. 5 A, bottom; Pozzo-Miller et al., 1999), and those of the reserve pool, located farther than ∼50 nm from the active zone. We did not find any abnormality in the docked vesicles in sdy mice (Fig. 5 C), which suggests that dysbindin is not involved in the docking process in the hippocampus. In contrast, the density of reserve pool vesicles was reduced by ∼22% in sdy animals (Fig. 5 C), which is consistent with the defect seen in adrenal morphology (Fig. 3). Interestingly, we also discovered decreased width of the synaptic cleft in sdy (Fig. 5 C). This probably reflects a compensatory change following the presynaptic defects within the hippocampus. In addition, sdy synapses exhibited increased thickness of PSDs (Fig. 5 C). Collectively, these results demonstrate that a lack of dysbindin leads to larger but fewer glutamatergic vesicles, narrower synaptic clefts, and thicker PSDs within CA1 asymmetrical synapses, in agreement with our electrophysiological observations of slow dynamics and reduced probability of glutamate release (Fig. 4).
Figure 5.

Dysbindin-deficient excitatory synapses have bigger but fewer vesicles in hippocampal CA1. (A; top) Electron micrographs depicting several asymmetrical synapses within CA1 in the ventral hippocampus. Double arrowheads indicate individual asymmetrical synapses. (bottom) Presynaptic terminals and adjacent dendritic spines. Arrowheads indicate docked vesicles; arrows mark the edges of the active zone/PSD complexes. Bars: (top) 500 nm; (bottom) 100 nm. (B) Distribution of vesicle sizes shows larger vesicles in sdy neurons (black) than in WT (gray). Gaussian fitting was performed. (bottom) The mean vesicle diameter of both cell types (WT, 44 ± 0.1 nm; sdy, 47 ± 0.1 nm; n = 1,015 vesicles from 121 WT synapses and 1,102 vesicles from 103 sdy synapses). (C) Comparison of four parameters, i.e., density of docked synaptic vesicles in active zone (WT, 20.5 ± 0.7 docked vesicles per μm; sdy, 20.2 ± 0.9 docked vesicles per μm), density of reserve pool (RP) vesicles in presynaptic terminal (WT, 110 ± 4 reserve pool vesicles per μm2; sdy, 86 ± 5 reserve pool vesicles per μm2), PSD thickness (WT, 44.2 ± 0.7 nm; sdy, 49 ± 1.0 nm), and synaptic cleft width (WT, 20.5 ± 0.2 nm; sdy, 16.0 ± 0.2 nm) in WT and sdy mice. ***, P < 0.001. Error bars indicate the mean ± SEM.
Smaller RRP size in sdy chromaffin cells and hippocampus
Abnormal vesicle structure and slower vesicle release kinetics in sdy cells might result from defective vesicle endocytosis and recycling (Deak et al., 2004). Therefore, cell membrane capacitance (Cm) measurements, which can be used for endocytosis recording (Smith and Neher, 1997; Zhang et al., 2004), were made in chromaffin cells to determine whether endocytosis was affected in the absence of dysbindin. Compared with WT cells, a 200-ms depolarizing pulse from −70 to +10 mV induced an ∼30% decrease in the ΔCm response in sdy cells (WT, 485 ± 109 fF; sdy, 337 ± 25 fF; Fig. 6 A), reflecting the exocytosis of LDCVs. This result is consistent with the total amount of secretion obtained from amperometric recordings, showing a ∼30% reduction in amperometric spike charge in sdy cells (Fig. 1, D and E). After reaching a peak, the Cm trace declined, representing endocytosis. We found that the kinetics of endocytosis in sdy cells were not significantly different from those in WT cells (decay time constant: WT, 173 ± 69 s; sdy, 186 ± 85 s), which suggests that the endocytosis of LDCVs is normal in dysbindin-deficient chromaffin cells.
Figure 6.

Dysbindin deficiency produces a smaller RRP size of LDCVs in chromaffin cells. (A) Comparison of the kinetics of vesicle endocytosis in WT and sdy chromaffin cells. The cell was stimulated by a 200-ms depolarization from −70 to +10 mV. Depolarization-induced capacitance changes (ΔCm) were larger in WT cells than in sdy cells (P < 0.001). The kinetics of endocytosis in sdy cells was similar to that in WT cells (P > 0.05). n = 7 (WT) and 6 (sdy). (B) Use of a dual-pulse protocol for estimating RRP size. Example of the capacitance responses (top) and Ca2+ currents (bottom) to a dual pulse. Two depolarizations with a 100-ms interval were applied. The depolarizing potentials were adjusted to give a similar amount of Ca2+ influx. (C) Comparison of the RRP size in WT (548.6 ± 92.3 fF) and sdy (287.0 ± 48.5 fF) cells, which were markedly different. n = 10 (WT) and 13 (sdy). (D) Comparison of the refilling kinetics of the RRP in WT and sdy cells. Normalized RRP size values were plotted versus the interpulse interval. Data points up to 10 s were fitted by a monoexponential curve. The interval between pulse pairs was ∼60 s. The time courses of RRP recovery were not significantly different. n = 10 (WT) and 13 (sdy). *, P < 0.05. Error bars indicate the mean ± SEM.
The RRP is generally considered to be the fusion-competent population of vesicles. The size of the RRP in chromaffin cells was estimated by using a dual-pulse protocol (Gillis et al., 1996; Smith et al., 1998), which is designed to elicit and measure secretory depression through two identical Ca2+ current injections given in rapid succession (Fig. 6 B). The RRP size, Bmax, is derived from the equation: Bmax = S/(1 – R2). S represents the sum of the capacitance responses to the first (ΔCm1) and the second (ΔCm2) pulse, and R is defined as the ratio ΔCm2/ΔCm1. A value of R < 1 reflects secretory depression, presumably owing to depletion of the RRP. Analyses were limited to R < 0.7 for an accurate estimate (Gillis et al., 1996; Smith et al., 1998). Typical responses obtained from WT and sdy cells are shown in Fig. 6 B. Analysis showed that the RRP size in sdy cells was only ∼50% of that in WT cells (Fig. 6 C). To investigate the time course of RRP recovery from depletion, a second dual pulse was applied at different time intervals to probe the pool size. The refilling kinetics can be estimated by a monoexponential fit of the interpulse interval versus the normalized RRP size. As shown in Fig. 6 D, the time courses of recovery were similar in WT and sdy cells (time constant of recovery: WT, 3.3 s; sdy, 2.8 s), indicating that dysbindin deficiency does not affect the refilling kinetics of the RRP.
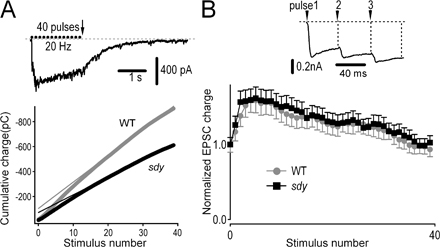
In addition, trains of high-frequency stimuli were applied to estimate the RRP size and the rate of replenishment of the RRP in hippocampal CA1 pyramidal neurons (Schneggenburger et al., 1999). A train of 40 pulses delivered at 20 Hz induced facilitation of EPSCs between the first and fourth pulses, followed by depression (Fig. S3, available at http://www.jcb.org/cgi/content/full/jcb.200711021/DC1). To estimate the RRP size, we plotted the cumulative EPSC charge during the train and extrapolated back to time = 0 to determine the RRP (Schneggenburger et al., 1999). As shown in Fig. S3 A, sdy neurons had a smaller RRP than WT neurons (WT, 105 ± 24 pC; sdy, 73 ± 15 pC). Because the size of the RRP correlates with release probability in hippocampal synapses (Dobrunz and Stevens, 1997; Dobrunz, 2002), this result from chromaffin cells is in agreement with the observation (shown in Fig. 6) that release probability is reduced in sdy synapses. However, the kinetics of replenishment of the RRP were not significantly different in CA1 neurons of either genotype (Fig. S3 B). Collectively, these findings indicate that dysbindin deficiency results in a smaller RRP of vesicles without affecting the refilling kinetics of the RRP in chromaffin cells and hippocampal neurons.
Normal expression levels of key components of synaptic vesicle release machinery in sdy adrenal gland and hippocampus
To understand whether other related proteins are affected in sdy mice, we next investigated the expression levels of major proteins involved in synaptic vesicle release. Western blot analyses of hippocampus and adrenal gland homogenates confirmed that the expression of dysbindin was abolished in the sdy mouse (Fig. 7). Dysbindin in the WT hippocampus existed in two isoforms (50 and 38 kD), and the 38-kD isoform was predominant. In adrenal glands, the 50-kD isoform was the only one, as in kidney (Li et al., 2003). However, we did not find any changes in semiquantitative assays (P > 0.05) in the steady-state levels of a panel of known synaptic proteins, including t-SNAREs (SNAP25 and syntaxin-1), intrinsic membrane proteins of synaptic vesicles (synaptobrevin/VAMP2, synaptotagmin-1, and VGLUT-1), and vesicle-associated proteins (dynamin I, complexin1/2, and munc18-1). Therefore, lack of dysbindin does not cause evident changes in the expression of these proteins. In addition, we did confirm that dysbindin binds to snapin (unpublished data), which is known to bind SNAP25 (Buxton et al., 2003; Ilardi et al., 1999).
Figure 7.

Steady-state levels of synaptic proteins in sdy hippocampus and adrenal. (A) Immunoblotting analysis of hippocampus homogenates (30 μg) from WT and sdy mice showed no major changes in the expression levels of several known synaptic vesicle proteins. Signals were visualized with enhanced chemiluminescence. (B) Immunoblotting analysis of adrenal glands (80 μg) from WT and sdy animals. Dynamin I is not shown in the adrenal gland due to very weak bands under these experimental conditions, whereas VGLUT-1 is not expressed in adrenal glands. The immunoblots shown are representative of three independent experiments.
Discussion
Recent studies have led to the suggestion that dysbindin, a putative susceptibility factor for schizophrenia, may play a role in neurotransmission (Numakawa et al., 2004; Kumamoto et al., 2006; Talbot et al., 2006), but very little is known about the phenotypes at the single vesicle level. In this study, using functional and morphological approaches in a spontaneously occurring dysbindin-deficient animal (sdy), we identified several phenotypes of the dysbindin in neurosecretion at the single vesicle and synaptic levels as follows: (1) the single vesicle catecholamine secretion was slower in kinetics, larger in Q, and lower in release probability/total secretion in sdy chromaffin cells; (2) exogenous dialysis of purified dysbindin partially rescued the abnormalities of secretion; (3) the duration and Q of single synaptic vesicle release were increased in sdy hippocampal CA1 nerve terminals; (4) electron microscopy analyses illustrated larger vesicle size and lower vesicle density in both hippocampal nerve terminals and chromaffin cells; (5) sdy chromaffin cells had a smaller RRP size but normal RRP refilling kinetics; (6) and finally, immunoblot analyses showed that the expression of a panel of known regulatory components of the vesicle exocytosis was not changed in sdy mice.
Our current hypothesis is that dysbindin may play multiple roles in regulating the synaptic vesicle cycle. In general, vesicles go through three steps during exocytosis: docking, priming, and fusion. After exocytosis, vesicle membrane components rapidly and selectively undergo endocytosis and recycling processes that make them competent for the next round (Hannah et al., 1999; Sudhof, 2004). Therefore, changes in the kinetics of single vesicle release in dysbindin-deficient cells suggest that this may affect the fusion process (i.e., fusion pore dynamics), as the slowing of quantal release kinetics (increased HHD and decay time) is consistent with a function of dysbindin in modulating fusion pore closure to allow kiss-and-run exocytosis (Zhou et al., 1996; Burgoyne and Barclay, 2002; Chen et al., 2005). This change in fusion pore dynamics may also contribute to the reduced release probability (Burgoyne et al., 2001; Fisher et al., 2001; Burgoyne and Barclay, 2002). Dysbindin may affect vesicle genesis because the vesicle size and quantal release was larger in sdy cells (Figs. 1–5). Furthermore, dysbindin deficiency reduced the size of the RRP without changing endocytosis or vesicle pool refilling. This result, together with the normal morphology of docked vesicles in sdy mice, also suggests a postdocking function of dysbindin, probably in the priming process (i.e., the stability of release-ready vesicles).
It is conceivable that these functions of dysbindin in the priming and fusion steps may be mediated by its interaction with the SNARE proteins and/or other synaptic vesicle proteins involved in exocytosis (Burgoyne et al., 2001; Burgoyne and Barclay, 2002; Bonanomi et al., 2006). In our experiments, we did not find any changes in the steady-state levels of these exocytotic regulators, including SNARE proteins (SNAP25, syntaxin-1, and VAMP2), synaptotagamin-1, VGLUT1, munc18-1, dynamin-1, and complexin1/2 (Fig. 7). However, we did confirm that snapin is a binding partner of dysbindin (unpublished data; Talbot et al., 2006). Snapin is identified as a ubiquitously expressed SNAP25-binding protein (Ilardi et al., 1999; Buxton et al., 2003). It has been proposed that snapin stabilizes the release-ready vesicles by enhancing the interaction of the SNARE proteins with synaptotagmin during the priming process (Tian et al., 2005). Thus, dysbindin may modulate vesicle priming by its interaction with snapin.
Dysbindin is a subunit of biogenesis of lysosome-related organelle complex-1 (BLOC-1). We previously reported that the sdy mouse displays defects in lysosome-related organelles biogenesis (Li et al., 2003). Therefore, our observed alteration in vesicle structure may arise from deficiency-induced alteration in vesicle structure and reflect defective biogenesis of synaptic vesicles and LDCVs via a BLOC-1–dependent pathway. Besides, dysbindin also binds to the dystrophin-associated protein complex (DPC), a component of the synapse (Benson et al., 2001). DPC is required for proper maturation and function of a subset of inhibitory synapses because the cerebellar synapse is defective in mice lacking α- and β-dystrobrevin (Grady et al., 2006). This might explain the decreased width of the synaptic cleft and increased thickness of PSDs in the sdy hippocampal asymmetrical synapse (Fig. 5). These morphological changes in the postsynapse and synaptic cleft predict a change in postsynaptic function. However, our electrophysiological recordings show no changes at the postsynaptic site in sdy hippocampus (Figs. 4 B and S2). Future work is needed to address this puzzle.
Our results reveal that dysbindin deficiency produces a specific set of “dysbindin-related defects” in neurotransmitter release, including slow fusion kinetics, increased Q, decreased release probability, and smaller RRP. These abnormalities might cause an abnormal efficacy of synaptic transmission in sdy synapses. As it is generally proposed that schizophrenia is a disorder of synaptic transmission (Frankle et al., 2003; Harrison and Weinberger, 2005), our findings present the first description that part of the sdy endophenotypes of transmitter release might contribute to schizophrenia-like traits. However, further studies should be performed for whether/what dysbindin-related defects in exocytosis lead to the cognitive impairments or psychotic symptoms seen in humans.
Schizophrenia is a heterogeneous syndrome with subtle behavioral and psychotic abnormalities. Genetic variation of dysbindin has been associated with negative symptoms in patients with schizophrenia (DeRosse et al., 2006). These negative symptoms are difficult to identify in mice with any known diagnostic laboratory tests (Ross et al., 2006). Therefore, although our initial behavioral observations, including prepulse inhibition, did not show differences between sdy and WT mice (Li et al., 2003), more elaborate tests need to be performed to see whether sdy mice have any equivalent of psychotic symptoms. Nevertheless, our findings have indicated that the sdy mutant, originally identified as a model of Hermansky-Pudlak syndrome type 7 (Li et al., 2003), may also be useful for studying the pathogenesis of schizophrenia, particularly in the area of neurotransmitter release.
Materials and methods
Animals and slice preparations
The sdy mutant and control DBA/2J mice (WT) were originally obtained from the Jackson Laboratory, transferred from R.T. Swank's laboratory at the Roswell Park Cancer Institute (Buffalo, NY) and bred in the animal facility of the Institute of Genetics and Developmental Biology at the Chinese Academy of Sciences. All procedures were approved by the Institutional Animal Care and Use Committee (mouse protocol KYD2005-006) and the Peking University Committee on Ethics in the Care and Use of Laboratory Animals. To ensure the genotypes of sdy/sdy, sdy/+, and +/+, we developed a PCR method of genotyping based on the nature of the deletion mutation in the DTNBP1 gene (Li et al., 2003).
We prepared adrenal medulla slices according to a previous study (Moser and Neher, 1997) with a minor modification. In brief, adrenal glands were removed from 6–10-wk-old DBA/2J or sdy mice and were immediately immersed in ice-cold, low Ca2+ bicarbonate-buffered saline (BBS) containing 125 mM NaCl, 2.5 mM KCl, 0.1 mM CaCl2, 5 mM MgCl2, 1.25 mM NaH2PO4, 26 mM NaHCO3, and 10 mM glucose, pH 7.4, when gassed with 95% O2/5% CO2. After that, a single gland was glued with cyanoacrylate to the stage of a vibratome chamber and covered with the same cold, O2-saturated BBS. Slices (100–200 μm) were cut parallel to the larger base of the gland (Vibratome 1000; Vibrotome). They were then incubated for 30 min at room temperature in normal BBS containing 125 mM NaCl, 2.5 mM KCl, 2 mM CaCl2, 1 mM MgCl2, 1.25 mM NaH2PO4, 26 mM NaHCO3, and 10 mM glucose gassed with 95% O2/5% CO2. Slices could be used for up to 8 h after cutting. For amperometric measurements and whole-cell recordings, slices were transferred to a recording chamber attached to the stage of an upright microscope equipped with an infrared-sensitive charge-coupled device camera (LUMPLanFI/IR 60×, BX51 WI; Olympus) and continuously superfused with normal BBS at room temperature.
Coronal hippocampal slices with a thickness of 300 μm from 12-d-old WT or sdy mice were made in ice-cold low-Ca2+ slicing solution containing 125 mM NaCl, 2.5 mM KCl, 0.1 mM CaCl2, 5 mM MgCl2, 1.25 mM NaH2PO4, 25 mM NaHCO3, 0.4 mM l-ascorbic acid, and 12.5 mM glucose, pH 7.4, when gassed with 95% O2/5% CO2. The slices were incubated for 1 h at room temperature in standard oxygenated external solution containing 125 mM NaCl, 2.5 mM KCl, 2 mM CaCl2, 1.3 mM MgCl2, 1.25 mM NaH2PO4, 25 mM NaHCO3, 0.4 mM l-ascorbic acid, and 12.5 mM glucose, pH 7.4.
Patch clamp recordings and amperometry in adrenal slices
We performed whole-cell recordings in adrenal slices using an EPC9/2 amplifier and Pulse software (HEKA Elektronik). The intracellular pipette solution contained 145 mM CsCl, 8 mM NaCl, 1 mM MgCl2, 10 mM H-Hepes, 2 mM Mg2ATP, and 0.2 mM Na2GTP, pH 7.2, adjusted with CsOH. For experiments using intracellular dialysis of dysbindin peptide, the internal solution contained dysbindin or heat-denatured dysbindin. Recordings were made at room temperature.
Highly sensitive and low-noise 5-μm carbon fiber electrodes (CFEs; ProCFE; Dagan) were used to measure quantal release of catecholamines from chromaffin cells. The amperometric current (Iamp) was measured at a holding potential of 780 mV. Amperometric signals were low-pass filtered at 0.3 kHz and digitized at 1 kHz. The CFE surface was positioned in contact with the membrane of a clean cell, and the close proximity of the electrode surface to the cell surface was confirmed by a slight deformation in the outline of the cell. High-K+ solution, one secretagogue used in our experiments, was applied using a perfusion system with a fast exchange time (PCR-2B, Instituto Nacional de Biodiversidad).
For analysis of the kinetic properties of amperometric spikes (Fig. 1 A), including the HHD, RT, and Q, only events > 5 SD of the noise were used (Zhou and Misler, 1996). Data analysis was performed using Igor software (WaveMetrix) with a custom-made macro program (Zhou and Misler, 1996).
Miniature and evoked EPSC recording in hippocampal slices
mEPSCs were recorded in ventral hippocampal CA1 pyramidal neurons under a voltage clamp using an EPC-9 amplifier as described previously (Huang et al., 2007). The intracellular pipette solution contained 120 mM cesium-gluconate, 20 mM CsCl2, 0.3 mM CaCl2, 4 mM NaCl, 0.5 mM EGTA, 10 mM H-Hepes, 0.3 mM Na2GTP, 14 mM phosphocreatine, and 4 mM Mg2ATP, pH 7.2, with CsOH. 1 μM tetrodotoxin and 10 μM bicuculline were added to the external solution. Each individual mEPSC event was fully characterized by the parameters of amplitude, frequency, HHD, charge, RT, and decay time. These parameters were analyzed using the MiniAnalysis program (Synaptosoft, Inc.). Averaged mEPSC waveforms were obtained by averaging 50 individual events using Igor software.
Evoked EPSCs were elicited by electrical stimulation of the Schaffer collaterals with a bipolar silver electrode placed in the stratum radiatum ∼150 μm away from the recorded CA1 pyramidal neuron. A single pulse (0.5 ms at 50 μA) was generated by a Grass stimulator (S88; Grass Technologies) and delivered through an isolation unit. EPSCs were recorded at −70 mV in the presence of 10 μM bicuculline. EPSC amplitudes were determined by subtracting the baseline current (obtained by averaging the period 3 ms before the stimulus) from the peak current of the EPSC. Kinetic analyses (charge, RT, and decay time) were performed using Igor software with a custom-made macro program.
Purification of dysbindin
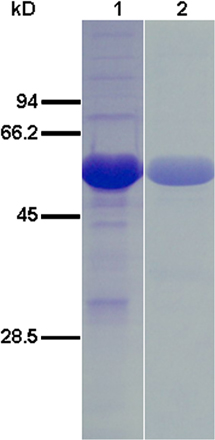
We amplified mouse full-length dysbindin cDNA (isoform 1, RefSeq available from GenBank/EMBL/DDBJ under accession no. NM_025772) by RT-PCR from DBA/2J total brain RNA with the introduction of NdeI and XhoI restriction sites at the 5′ and 3′ ends, respectively. The PCR product was purified with the Gel Extraction mini kit (Watson BioTechnologies, Inc.), cloned into a pGEM T Easy vector (Promega), and verified by sequencing. We then subcloned the DNA fragment into the NdeI–XhoI–cleaved plasmid p28 (a gift from W. Gong, Institute of Biophysics, Chinese Academy of Sciences, Beijing, China). The p28-dysbindin construct was expressed in Escherichia coli Rosetta (DE3). The recombinant protein contains six histidine residues at the N terminus. The cells were harvested by centrifugation and resuspended in a lysis buffer containing 20 mM Tris-HCl, pH 8.0. The cell lysate was loaded on a nickel-nitrilotriacetic acid column (QIAGEN), and His-tagged dysbindin was eluted with 0.05 M imidazole. We further purified it by gel filtration on a Superdex 200 column (GE Healthcare). The peak fractions were tested for purity by SDS-PAGE (Fig. S1) and the protein solution was exchanged using a centrifugal filter device (Amicon Ultra-4; Millipore). The dysbindin concentration was determined by a protein assay (Bio-Rad Laboratories).
Electron microscopy
Electron microscopy was performed as described previously (Huang et al., 2007), with a slight modification. In brief, for chromaffin cells, adrenal glands were removed from anesthetized 8-wk-old WT and sdy mice and fixed with 3% glutaraldehyde in 0.1 M phosphate buffer, pH 7.4, overnight at 4°C. The samples were then treated with 1% OsO4 in 0.1 M phosphate buffer, pH 7.4, for 2 h at 4°C, and serially dehydrated in ethanol followed by flat-embedding in Epon812 and polymerization at 60°C for 48 h. Ultrathin sections (∼60 nm) were stained with uranyl acetate and lead citrate. The sections were examined on an electron microscope (JEM-1230; JEOL Ltd.) at 100 kV, and digital images were captured with a charge-coupled device camera system and analyzed with Image J software (National Institutes of Health). The number, size and spatial distribution of LDCVs were measured in sections of randomly selected cells from three different animals for both genotypes. The same single sections were analyzed at least twice independently, and the results were essentially identical. The quantitative analysis was performed as described previously (Colliver et al., 2000; Voets et al., 2001; Grabner et al., 2005). The area of each vesicle was measured and the diameter was calculated from the vesicle area using the equation: diameter = 2 × (area/π)0.5. The mean values were compared using a Student's t test (SPSS 10.0; SPSS) and are displayed in Fig. 3.
For hippocampal electron microscopy examination, 8-wk-old mice (three WT and three sdy) under deep pentobarbital anesthesia were perfused through the heart with 2.5% glutaraldehyde and 2% paraformaldehyde in 0.1 M phosphate buffer, pH 7.4. The brains were removed and the hippocampus was sliced transverse to its longitudinal axis at 1 mm thickness. The blocks were trimmed to contain the hippocampal CA1 pyramidal cell bodies and their apical dendrites in the stratum radiatum. The blocks were immersed in 4% glutaraldehyde in 0.1 M phosphate buffer, pH 7.4, overnight at 4°C and the procedure described here was followed. Only asymmetrical, i.e., glutamatergic, synapses with clearly identifiable PSDs were analyzed. The quantitative analysis was performed according to previously published literature (Pozzo-Miller et al., 1999) and is displayed in Fig. 5.
Immunoblotting
Hippocampus and adrenal glands from sdy mice were homogenized in a lysis buffer containing 50 mM Tris-HCl, pH 7.4, 150 mM NaCl, 1% Triton X-100, and a protein inhibitor cocktail (Sigma-Aldrich). The extracts were centrifuged at 15,000 g for 30 min and the concentration of the solubilized protein was determined by a protein assay (Bio-Rad Laboratories). For detection of various proteins in tissue homogenates, equal amounts of tissue homogenates were loaded on 12% SDS-PAGE gels and Western blot analyses were performed with specific antibodies in 3% BSA in PBS with 0.1% Tween 20. A standard ECL plus staining procedure (GE Healthcare) was followed. Three independent immunoblotting experiments were performed for each set of samples. For semiquantitative analysis, protein bands detected by ECL plus were scanned with an imager (EC3; UVP, LLC) and analyzed using Image J, normalized to the quantities of actin. A Student's t test was used to compare the band intensities.
Antibodies
Rabbit polyclonal dysbindin antibody (1:200) was a gift from D.J. Blake (University of Oxford, Oxford, UK). The mouse monoclonal antibodies against SNAP25 (1:500), syntaxin 1 (1:500), and dynamin I (1:500), and rabbit polyclonal anti-complexin (1:500) were obtained from Santa Cruz Biotechnology, Inc. Other antibodies used in this study included monoclonal mouse anti-synaptotagmin 1 (1:500; Assay Designs), rabbit polyclonal anti-VAMP2 (1:1,000; AbCam), mouse monoclonal anti-munc18-1 (1:1,000; BD Biosciences), mouse monoclonal VGLUT-1 (1:300; Millipore), and mouse monoclonal anti–β-actin (1:5,000; Sigma-Aldrich).
All values throughout the text are presented as mean ± SEM. Either a Student's t test or the Kolmogorov-Smirnov test was used to compare means when appropriate. Differences of P < 0.05 were considered statistically significant.
Online supplemental material
Fig. S1 shows the Coomassie blue staining of the purified recombinant dysbindin protein. Fig. S2 shows that the AMPA/NMDA ratio of evoked EPSCs is unaffected in sdy hippocampal neurons. Fig. S3 shows the measurements of RRP size and kinetics of replenishment of RRP in sdy and WT hippocampal neurons. Online supplemental material is available at http://www.jcb.org/cgi/content/full/jcb.200711021/DC1.
Supplementary Material
Acknowledgments
We thank Dr. Richard T. Swank for providing the sdy mutant mice, Drs. Tomas Hokfelt and David Z. Xu for advice on electron microscopy data analysis, Dr. Iain Bruce for reading the manuscript, and Dr. Zhi-An Hu for help.
This work was supported by grants from the National Basic Research Program of China (2006CB500800, 2006CB504100, 2006CB500700, 2007CB512100, and 2007CB947200), the 863 Program of China (2006AA02A407), and the National Natural Science Foundation of China (30330210, 30328013, 30770788, 30730049, and 30525007) to Z. Zhou, W. Li, C.X. Zhang, or X. He.
X.-W. Chen and Y.-Q. Feng contributed equally to this paper.
X.-W. Chen's present address is Department of Physiology, Third Military Medical University, Chongqing 400038, China.
Abbreviations used in this paper: DTNBP1, dystrobrevin-binding protein 1; HHD, half-height duration; LDCV, large dense-core vesicle; mEPSC, miniature excitatory postsynaptic current; PSD, postsynaptic density; Q, quantal size; RRP, readily releasable pool; RT, rise time; sdy, sandy; WT, wild type.
References
- Albillos, A., G. Dernick, H. Horstmann, W. Almers, G. Alvarez de Toledo, and M. Lindau. 1997. The exocytotic event in chromaffin cells revealed by patch amperometry. Nature. 389:509–512. [DOI] [PubMed] [Google Scholar]
- Artalejo, C.R., M.E. Adams, and A.P. Fox. 1994. Three types of Ca2+ channel trigger secretion with different efficacies in chromaffin cells. Nature. 367:72–76. [DOI] [PubMed] [Google Scholar]
- Augustine, G.J., and E. Neher. 1992. Calcium requirements for secretion in bovine chromaffin cells. J. Physiol. 450:247–271. [DOI] [PMC free article] [PubMed] [Google Scholar]
- Barbara, J.G., J.C. Poncer, R.A. McKinney, and K. Takeda. 1998. An adrenal slice preparation for the study of chromaffin cells and their cholinergic innervation. J. Neurosci. Methods. 80:181–189. [DOI] [PubMed] [Google Scholar]
- Benson, M.A., S.E. Newey, E. Martin-Rendon, R. Hawkes, and D.J. Blake. 2001. Dysbindin, a novel coiled-coil-containing protein that interacts with the dystrobrevins in muscle and brain. J. Biol. Chem. 276:24232–24241. [DOI] [PubMed] [Google Scholar]
- Bonanomi, D., F. Benfenati, and F. Valtorta. 2006. Protein sorting in the synaptic vesicle life cycle. Prog. Neurobiol. 80:177–217. [DOI] [PubMed] [Google Scholar]
- Bruns, D., D. Riedel, J. Klingauf, and R. Jahn. 2000. Quantal release of serotonin. Neuron. 28:205–220. [DOI] [PubMed] [Google Scholar]
- Burgoyne, R.D., and J.W. Barclay. 2002. Splitting the quantum: regulation of quantal release during vesicle fusion. Trends Neurosci. 25:176–178. [DOI] [PubMed] [Google Scholar]
- Burgoyne, R.D., R.J. Fisher, M.E. Graham, L.P. Haynes, and A. Morgan. 2001. Control of membrane fusion dynamics during regulated exocytosis. Biochem. Soc. Trans. 29:467–472. [DOI] [PubMed] [Google Scholar]
- Buxton, P., X.M. Zhang, B. Walsh, A. Sriratana, I. Schenberg, E. Manickam, and T. Rowe. 2003. Identification and characterization of Snapin as a ubiquitously expressed SNARE-binding protein that interacts with SNAP23 in non-neuronal cells. Biochem. J. 375:433–440. [DOI] [PMC free article] [PubMed] [Google Scholar]
- Cardno, A.G., and I.I. Gottesman. 2000. Twin studies of schizophrenia: from bow-and-arrow concordances to star wars Mx and functional genomics. Am. J. Med. Genet. 97:12–17. [PubMed] [Google Scholar]
- Chen, X.K., L.C. Wang, Y. Zhou, Q. Cai, M. Prakriya, K.L. Duan, Z.H. Sheng, C. Lingle, and Z. Zhou. 2005. Activation of GPCRs modulates quantal size in chromaffin cells through G(betagamma) and PKC. Nat. Neurosci. 8:1160–1168. [DOI] [PubMed] [Google Scholar]
- Chow, R.H., L. von Ruden, and E. Neher. 1992. Delay in vesicle fusion revealed by electrochemical monitoring of single secretory events in adrenal chromaffin cells. Nature. 356:60–63. [DOI] [PubMed] [Google Scholar]
- Colliver, T.L., S.J. Pyott, M. Achalabun, and A.G. Ewing. 2000. VMAT-mediated changes in quantal size and vesicular volume. J. Neurosci. 20:5276–5282. [DOI] [PMC free article] [PubMed] [Google Scholar]
- Coyle, J.T. 2006. Glutamate and schizophrenia: beyond the dopamine hypothesis. Cell. Mol. Neurobiol. 26:365–384. [DOI] [PMC free article] [PubMed] [Google Scholar]
- Deak, F., S. Schoch, X. Liu, T.C. Sudhof, and E.T. Kavalali. 2004. Synaptobrevin is essential for fast synaptic-vesicle endocytosis. Nat. Cell Biol. 6:1102–1108. [DOI] [PubMed] [Google Scholar]
- DeRosse, P., B. Funke, K.E. Burdick, T. Lencz, J.M. Ekholm, J.M. Kane, R. Kucherlapati, and A.K. Malhotra. 2006. Dysbindin genotype and negative symptoms in schizophrenia. Am. J. Psychiatry. 163:532–534. [DOI] [PubMed] [Google Scholar]
- Dobrunz, L.E. 2002. Release probability is regulated by the size of the readily releasable vesicle pool at excitatory synapses in hippocampus. Int. J. Dev. Neurosci. 20:225–236. [DOI] [PubMed] [Google Scholar]
- Dobrunz, L.E., and C.F. Stevens. 1997. Heterogeneity of release probability, facilitation, and depletion at central synapses. Neuron. 18:995–1008. [DOI] [PubMed] [Google Scholar]
- Fisher, R.J., J. Pevsner, and R.D. Burgoyne. 2001. Control of fusion pore dynamics during exocytosis by Munc18. Science. 291:875–878. [DOI] [PubMed] [Google Scholar]
- Frankle, W.G., J. Lerma, and M. Laruelle. 2003. The synaptic hypothesis of schizophrenia. Neuron. 39:205–216. [DOI] [PubMed] [Google Scholar]
- Gillis, K.D., R. Mossner, and E. Neher. 1996. Protein kinase C enhances exocytosis from chromaffin cells by increasing the size of the readily releasable pool of secretory granules. Neuron. 16:1209–1220. [DOI] [PubMed] [Google Scholar]
- Grabner, C.P., S.D. Price, A. Lysakowski, and A.P. Fox. 2005. Mouse chromaffin cells have two populations of dense core vesicles. J. Neurophysiol. 94:2093–2104. [DOI] [PMC free article] [PubMed] [Google Scholar]
- Grady, R.M., D.F. Wozniak, K.K. Ohlemiller, and J.R. Sanes. 2006. Cerebellar synaptic defects and abnormal motor behavior in mice lacking alpha- and beta-dystrobrevin. J. Neurosci. 26:2841–2851. [DOI] [PMC free article] [PubMed] [Google Scholar]
- Hannah, M.J., A.A. Schmidt, and W.B. Huttner. 1999. Synaptic vesicle biogenesis. Annu. Rev. Cell Dev. Biol. 15:733–798. [DOI] [PubMed] [Google Scholar]
- Harrison, P.J., and S.L. Eastwood. 2001. Neuropathological studies of synaptic connectivity in the hippocampal formation in schizophrenia. Hippocampus. 11:508–519. [DOI] [PubMed] [Google Scholar]
- Harrison, P.J., and D.R. Weinberger. 2005. Schizophrenia genes, gene expression, and neuropathology: on the matter of their convergence. Mol. Psychiatry. 10:40–68. [DOI] [PubMed] [Google Scholar]
- Huang, H.P., S.R. Wang, W. Yao, C. Zhang, Y. Zhou, X.W. Chen, B. Zhang, W. Xiong, L.Y. Wang, L.H. Zheng, et al. 2007. Long latency of evoked quantal transmitter release from somata of locus coeruleus neurons in rat pontine slices. Proc. Natl. Acad. Sci. USA. 104:1401–1406. [DOI] [PMC free article] [PubMed] [Google Scholar]
- Ilardi, J.M., S. Mochida, and Z.H. Sheng. 1999. Snapin: a SNARE-associated protein implicated in synaptic transmission. Nat. Neurosci. 2:119–124. [DOI] [PubMed] [Google Scholar]
- Karunanithi, S., L. Marin, K. Wong, and H.L. Atwood. 2002. Quantal size and variation determined by vesicle size in normal and mutant Drosophila glutamatergic synapses. J. Neurosci. 22:10267–10276. [DOI] [PMC free article] [PubMed] [Google Scholar]
- Krapivinsky, G., S. Mochida, L. Krapivinsky, S.M. Cibulsky, and D.E. Clapham. 2006. The TRPM7 ion channel functions in cholinergic synaptic vesicles and affects transmitter release. Neuron. 52:485–496. [DOI] [PubMed] [Google Scholar]
- Kumamoto, N., S. Matsuzaki, K. Inoue, T. Hattori, S. Shimizu, R. Hashimoto, A. Yamatodani, T. Katayama, and M. Tohyama. 2006. Hyperactivation of midbrain dopaminergic system in schizophrenia could be attributed to the down-regulation of dysbindin. Biochem. Biophys. Res. Commun. 345:904–909. [DOI] [PubMed] [Google Scholar]
- Lewis, D.A., T. Hashimoto, and D.W. Volk. 2005. Cortical inhibitory neurons and schizophrenia. Nat. Rev. Neurosci. 6:312–324. [DOI] [PubMed] [Google Scholar]
- Li, W., Q. Zhang, N. Oiso, E.K. Novak, R. Gautam, E.P. O'Brien, C.L. Tinsley, D.J. Blake, R.A. Spritz, N.G. Copeland, et al. 2003. Hermansky-Pudlak syndrome type 7 (HPS-7) results from mutant dysbindin, a member of the biogenesis of lysosome-related organelles complex 1 (BLOC-1). Nat. Genet. 35:84–89. [DOI] [PMC free article] [PubMed] [Google Scholar]
- Morgan, A., and R.D. Burgoyne. 1997. Common mechanisms for regulated exocytosis in the chromaffin cell and the synapse. Semin. Cell Dev. Biol. 8:141–149. [DOI] [PubMed] [Google Scholar]
- Morris, D.W., K. Murphy, N. Kenny, S.M. Purcell, K.A. McGhee, S. Schwaiger, J.M. Nangle, G. Donohoe, S. Clarke, P. Scully, et al. 2008. Dysbindin (DTNBP1) and the biogenesis of lysosome-related organelles complex 1 (BLOC-1): main and epistatic gene effects are potential contributors to schizophrenia susceptibility. Biol. Psychiatry. 63:24–31. [DOI] [PubMed] [Google Scholar]
- Moser, T., and E. Neher. 1997. Rapid exocytosis in single chromaffin cells recorded from mouse adrenal slices. J. Neurosci. 17:2314–2323. [DOI] [PMC free article] [PubMed] [Google Scholar]
- Murotani, T., T. Ishizuka, S. Hattori, R. Hashimoto, S. Matsuzaki, and A. Yamatodani. 2007. High dopamine turnover in the brains of Sandy mice. Neurosci. Lett. 421:47–51. [DOI] [PubMed] [Google Scholar]
- Nicoll, R.A., and R.C. Malenka. 1999. Expression mechanisms underlying NMDA receptor-dependent long-term potentiation. Ann. N. Y. Acad. Sci. 868:515–525. [DOI] [PubMed] [Google Scholar]
- Norton, N., H.J. Williams, and M.J. Owen. 2006. An update on the genetics of schizophrenia. Curr. Opin. Psychiatry. 19:158–164. [DOI] [PubMed] [Google Scholar]
- Numakawa, T., Y. Yagasaki, T. Ishimoto, T. Okada, T. Suzuki, N. Iwata, N. Ozaki, T. Taguchi, M. Tatsumi, K. Kamijima, et al. 2004. Evidence of novel neuronal functions of dysbindin, a susceptibility gene for schizophrenia. Hum. Mol. Genet. 13:2699–2708. [DOI] [PubMed] [Google Scholar]
- O'Donovan, M.C., N.M. Williams, and M.J. Owen. 2003. Recent advances in the genetics of schizophrenia. Hum. Mol. Genet. 12:R125–R133. [DOI] [PubMed] [Google Scholar]
- Pozzo-Miller, L.D., W. Gottschalk, L. Zhang, K. McDermott, J. Du, R. Gopalakrishnan, C. Oho, Z.H. Sheng, and B. Lu. 1999. Impairments in high-frequency transmission, synaptic vesicle docking, and synaptic protein distribution in the hippocampus of BDNF knockout mice. J. Neurosci. 19:4972–4983. [DOI] [PMC free article] [PubMed] [Google Scholar]
- Ross, C.A., R.L. Margolis, S.A. Reading, M. Pletnikov, and J.T. Coyle. 2006. Neurobiology of schizophrenia. Neuron. 52:139–153. [DOI] [PubMed] [Google Scholar]
- Schneggenburger, R., A.C. Meyer, and E. Neher. 1999. Released fraction and total size of a pool of immediately available transmitter quanta at a calyx synapse. Neuron. 23:399–409. [DOI] [PubMed] [Google Scholar]
- Schwab, S.G., M. Knapp, S. Mondabon, J. Hallmayer, M. Borrmann-Hassenbach, M. Albus, B. Lerer, M. Rietschel, M. Trixler, W. Maier, and D.B. Wildenauer. 2003. Support for association of schizophrenia with genetic variation in the 6p22.3 gene, dysbindin, in sib-pair families with linkage and in an additional sample of triad families. Am. J. Hum. Genet. 72:185–190. [DOI] [PMC free article] [PubMed] [Google Scholar]
- Smith, C., and E. Neher. 1997. Multiple forms of endocytosis in bovine adrenal chromaffin cells. J. Cell Biol. 139:885–894. [DOI] [PMC free article] [PubMed] [Google Scholar]
- Smith, C., T. Moser, T. Xu, and E. Neher. 1998. Cytosolic Ca2+ acts by two separate pathways to modulate the supply of release-competent vesicles in chromaffin cells. Neuron. 20:1243–1253. [DOI] [PubMed] [Google Scholar]
- Snyder, S.H. 2006. Dopamine receptor excess and mouse madness. Neuron. 49:484–485. [DOI] [PubMed] [Google Scholar]
- Starcevic, M., and E.C. Dell'Angelica. 2004. Identification of snapin and three novel proteins (BLOS1, BLOS2, and BLOS3/reduced pigmentation) as subunits of biogenesis of lysosome-related organelles complex-1 (BLOC-1). J. Biol. Chem. 279:28393–28401. [DOI] [PubMed] [Google Scholar]
- Straub, R.E., C.J. MacLean, F.A. O'Neill, J. Burke, B. Murphy, F. Duke, R. Shinkwin, B.T. Webb, J. Zhang, D. Walsh, et al. 1995. A potential vulnerability locus for schizophrenia on chromosome 6p24-22: evidence for genetic heterogeneity. Nat. Genet. 11:287–293. [DOI] [PubMed] [Google Scholar]
- Sudhof, T.C. 2004. The synaptic vesicle cycle. Annu. Rev. Neurosci. 27:509–547. [DOI] [PubMed] [Google Scholar]
- Sulzer, D., and R. Edwards. 2000. Vesicles: equal in neurotransmitter concentration but not in volume. Neuron. 28:5–7. [DOI] [PubMed] [Google Scholar]
- Talbot, K., W.L. Eidem, C.L. Tinsley, M.A. Benson, E.W. Thompson, R.J. Smith, C.G. Hahn, S.J. Siegel, J.Q. Trojanowski, R.E. Gur, et al. 2004. Dysbindin-1 is reduced in intrinsic, glutamatergic terminals of the hippocampal formation in schizophrenia. J. Clin. Invest. 113:1353–1363. [DOI] [PMC free article] [PubMed] [Google Scholar]
- Talbot, K., D.S. Cho, W.Y. Ong, M.A. Benson, L.Y. Han, H.A. Kazi, J. Kamins, C.G. Hahn, D.J. Blake, and S.E. Arnold. 2006. Dysbindin-1 is a synaptic and microtubular protein that binds brain snapin. Hum. Mol. Genet. 15:3041–3054. [DOI] [PubMed] [Google Scholar]
- Tian, J.H., Z.X. Wu, M. Unzicker, L. Lu, Q. Cai, C. Li, C. Schirra, U. Matti, D. Stevens, C. Deng, et al. 2005. The role of Snapin in neurosecretion: snapin knock-out mice exhibit impaired calcium-dependent exocytosis of large dense-core vesicles in chromaffin cells. J. Neurosci. 25:10546–10555. [DOI] [PMC free article] [PubMed] [Google Scholar]
- Voets, T., R.F. Toonen, E.C. Brian, H. de Wit, T. Moser, J. Rettig, T.C. Sudhof, E. Neher, and M. Verhage. 2001. Munc18-1 promotes large dense-core vesicle docking. Neuron. 31:581–591. [DOI] [PubMed] [Google Scholar]
- Wang, S., C.E. Sun, C.A. Walczak, J.S. Ziegle, B.R. Kipps, L.R. Goldin, and S.R. Diehl. 1995. Evidence for a susceptibility locus for schizophrenia on chromosome 6pter-p22. Nat. Genet. 10:41–46. [DOI] [PubMed] [Google Scholar]
- Weickert, C.S., R.E. Straub, B.W. McClintock, M. Matsumoto, R. Hashimoto, T.M. Hyde, M.M. Herman, D.R. Weinberger, and J.E. Kleinman. 2004. Human dysbindin (DTNBP1) gene expression in normal brain and in schizophrenic prefrontal cortex and midbrain. Arch. Gen. Psychiatry. 61:544–555. [DOI] [PubMed] [Google Scholar]
- Weickert, C.S., D.A. Rothmond, T.M. Hyde, J.E. Kleinman, and R.E. Straub. 2008. Reduced DTNBP1 (dysbindin-1) mRNA in the hippocampal formation of schizophrenia patients. Schizophr. Res. 98:105–110. [DOI] [PMC free article] [PubMed] [Google Scholar]
- Weinberger, D.R. 1999. Cell biology of the hippocampal formation in schizophrenia. Biol. Psychiatry. 45:395–402. [DOI] [PubMed] [Google Scholar]
- Wightman, R.M., J.A. Jankowski, R.T. Kennedy, K.T. Kawagoe, T.J. Schroeder, D.J. Leszczyszyn, J.A. Near, E.J. Diliberto Jr., and O.H. Viveros. 1991. Temporally resolved catecholamine spikes correspond to single vesicle release from individual chromaffin cells. Proc. Natl. Acad. Sci. USA. 88:10754–10758. [DOI] [PMC free article] [PubMed] [Google Scholar]
- Wu, X.S., L. Xue, R. Mohan, K. Paradiso, K.D. Gillis, and L.G. Wu. 2007. The origin of quantal size variation: vesicular glutamate concentration plays a significant role. J. Neurosci. 27:3046–3056. [DOI] [PMC free article] [PubMed] [Google Scholar]
- Zhang, C., and Z. Zhou. 2002. Ca(2+)-independent but voltage-dependent secretion in mammalian dorsal root ganglion neurons. Nat. Neurosci. 5:425–430. [DOI] [PubMed] [Google Scholar]
- Zhang, C., W. Xiong, H. Zheng, L. Wang, B. Lu, and Z. Zhou. 2004. Calcium- and dynamin-independent endocytosis in dorsal root ganglion neurons. Neuron. 42:225–236. [DOI] [PubMed] [Google Scholar]
- Zhou, Z., and S. Misler. 1996. Amperometric detection of quantal secretion from patch-clamped rat pancreatic beta-cells. J. Biol. Chem. 271:270–277. [DOI] [PubMed] [Google Scholar]
- Zhou, Z., S. Misler, and R.H. Chow. 1996. Rapid fluctuations in transmitter release from single vesicles in bovine adrenal chromaffin cells. Biophys. J. 70:1543–1552. [DOI] [PMC free article] [PubMed] [Google Scholar]
Associated Data
This section collects any data citations, data availability statements, or supplementary materials included in this article.