Abstract
Hyperphosphatemia and vascular calcification have emerged as cardiovascular risk factors among those with chronic kidney disease. This study examined the mechanism by which phosphorous stimulates vascular calcification, as well as how controlling hyperphosphatemia affects established calcification. In primary cultures of vascular smooth muscle cells derived from atherosclerotic human aortas, activation of osteoblastic events, including increased expression of bone morphogenetic protein 2 (BMP-2) and the transcription factor RUNX2, which normally play roles in skeletal morphogenesis, was observed. These changes, however, did not lead to matrix mineralization until the phosphorus concentration of the media was increased; phosphorus stimulated expression of osterix, a second critical osteoblast transcription factor. Knockdown of osterix with small interference RNA (siRNA) or antagonism of BMP-2 with noggin prevented matrix mineralization in vitro. Similarly, vascular BMP-2 and RUNX2 were upregulated in atherosclerotic mice, but significant mineralization occurred only after the induction of renal dysfunction, which led to hyperphosphatemia and increased aortic expression of osterix. Administration of oral phosphate binders or intraperitoneal BMP-7 decreased expression of osterix and aortic mineralization. It is concluded that, in chronic kidney disease, hyperphosphatemia stimulates an osteoblastic transcriptional program in the vasculature, which is mediated by osterix activation in cells of the vascular tunica media and neointima.
Chronic kidney disease (CKD) is a fatal illness, and cardiovascular complications are the major causes of morbidity and mortality.1,2 The causes of the excess cardiovascular mortality associated with CKD are unknown, because the role of the standard risk factors associated with cardiovascular mortality do not account for the increased risk in CKD.2 There is strong epidemiologic evidence that serum phosphorus is an independent risk factor for cardiovascular events and mortality in CKD.3,4 The serum phosphorus has been linked to another cardiovascular risk factor, vascular calcification (VC),3,5,6 an important cause of vascular stiffness in CKD leading to increased pulse wave velocity, increased cardiac work, left ventricular hypertrophy, and decreased coronary artery blood flow.6–8
Phosphorus has been further implicated as a cause of VC through studies in vitro that have demonstrated that it induces phenotypic changes in vascular smooth muscle cells (VSMC) by increasing gene transcription of proteins involved in osteoblast function–bone formation9 and stimulating matrix mineralization.10–12 In the uremic calcifying environment, expression of the contractile proteins of VSMC, such as α-smooth muscle actin, SM22, and heavy-chain myosin, are suppressed,13 whereas osteoblastic lineage markers such as osteocalcin, osteopontin, and the bone morphogenetic proteins 2 and 4 (BMP-2 and -4) are increased.9,14–16 Furthermore, the osteoblast specific transcription factor RUNX2, which directs skeletal bone formation,17 is expressed in the vasculature of patients with end-stage CKD.9,18
We recently discovered an animal model of CKD-stimulated VC in the atherosclerotic LDL receptor–deficient (LDLR−/−) mouse fed high dietary fat.19 The CKD in this model is associated with hyperphosphatemia, and we demonstrated that hyperphosphatemia is a direct cause of VC in CKD.20 This was the first demonstration in vivo that hyperphosphatemia is causative of a cardiovascular complication of the disease. Furthermore, we demonstrated that the skeleton in CKD is a significant contributor to hyperphosphatemia,20,21 along with intestinal absorption of ingested phosphorus and diminished renal excretion. This establishes a direct link between skeletal remodeling and VC in CKD through the serum phosphorus. The mechanism of phosphorus action at the level of the vasculature remains to be demonstrated despite recent progress suggesting direct actions of the ion.11,22
Here we report experiments analyzing the actions of hyperphosphatemia control on decreasing established calcification and the mechanism of phosphorus action. Human aortic smooth muscle cell cultures isolated from atherosclerotic aortas demonstrated a BMP-2–and -4–activated osteoblastic gene transcription program.23 Phosphorus stimulated mineralization of the extracellular matrix (ECM) of these cultures analogous to bone formation in vitro. Mineralization was blocked by a BMP antagonist, noggin, in the presence of high phosphorus. Phosphorus added critical stimulation of the osteoblastic mineralization program through increased expression of the osteoblast-specific transcription factor osterix.24,25 Inhibition of mineralization was produced by decreasing osterix expression in the presence of high media phosphate. The data in vitro were perfectly matched in vivo by CKD in part by stimulating the high phosphorus signal. High fat–fed atherosclerotic LDLR−/− mice expressed BMP-4 and RUNX2 and had some low-level aortic mineralization. CKD stimulated hyperphosphatemia, osterix expression, and aortic mineralization. Mineralization was partially reversible by treatment of hyperphosphatemia or with BMP-7 (which also corrected hyperphosphatemia), associated with silencing of osterix expression.
RESULTS
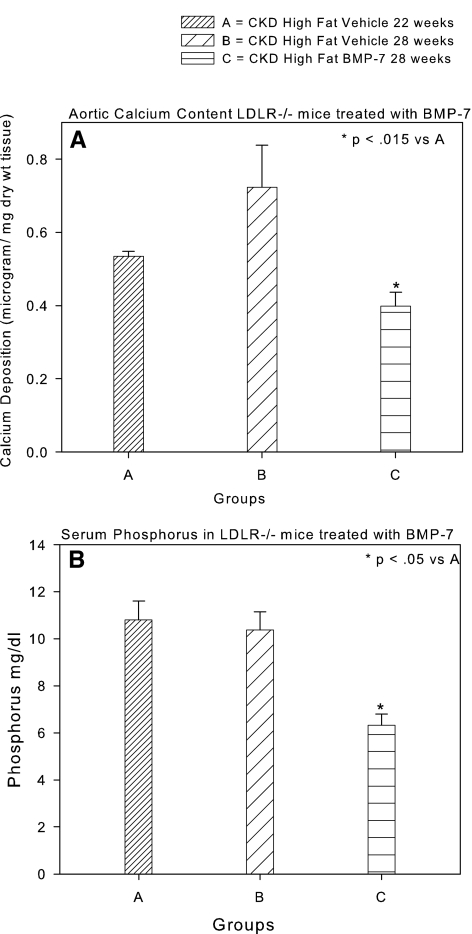
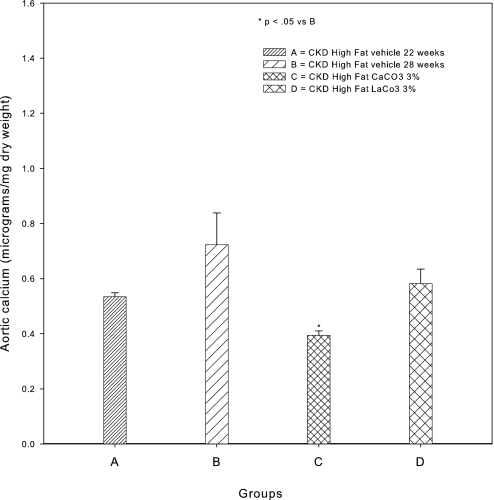
VC in the LDLR−/− mouse fed high-fat diets has been shown to be a clinically relevant model of VC in type 2 diabetes,26,27 and it is a model of stimulation of VC by CKD.19 Previous studies demonstrated that BMP-7 prevented the development of aortic calcification in LDLR−/− mice that had CKD and were fed high-fat diets in part through stimulation of bone formation, leading to control of hyperphosphatemia by increased skeletal deposition.19,20 To examine the actions of BMP-7 and hyperphosphatemia control on treating established VC, we undertook a “treatment study” experimental design, wherein therapy was begun at the time our previous prevention studies ended and continued for a period of 6 wk. Quantification of aortic calcium (Ca) in high fat–fed mice with CKD induced at 14 wk and killed at 22 wk postnatal demonstrated CKD-stimulated calcification similar to our previous experimental plans19,20 (Figure 1A). Therapy with the vehicle for 6 wk beginning at weeks 22 to 28 postnatal resulted in further accumulation of vascular Ca (Figure 1A). Therapy with BMP-7, 10 μg/kg intraperitoneally weekly, the same dosage used in previous prevention trials,19,20 for the period 22 to 28 wk produced a significant reduction of aortic calcification compared with the 22-wk start point (Figure 1A) and correction of hyperphosphatemia (Figure 1B). Because BMP-7 has actions directly on the vasculature28,29 in addition to decreasing hyperphosphatemia, we needed to analyze the effects of control of hyperphosphatemia alone. We initially chose sevelamer CO3, a nonabsorbable binder of intestinal lumen phosphate and bile salts, to correct hyperphosphatemia, but we demonstrated that this binder, although effective (Table 1), had pleiotropic actions.30 Thus, we chose CaCO3, whose actions may be limited to phosphate binding when well mixed in the food and when the serum Ca is not affected. LaCO3, another non–Ca-containing phosphate binder used clinically, was also studied. CaCO3 added to the diet significantly decreased VC compared with the 22-wk start point animals, similar to the BMP-7 effects (Figure 2). The treatment actions of CaCO3 were similar to our published studies demonstrating prevention of VC when hyperphosphatemia was prevented by CaCO3.20 CaCO3 did not affect the serum Ca (Table 1). LaCO3 also prevented the increase in VC from 22 to 28 wk, similar to CaCO3, but did not reduce vascular Ca levels below those observed at 22 wk. Sevelamer CO3 therapy reduced the serum cholesterol, but none of the other treatments affected the hypercholesterolemia of the LDLR−/− mice.
Figure 1.
Effects of BMP-7, 10 μg/kg intraperitoneally once weekly, on VC in CKD by BMP-7. (A) VC increased from 22 to 28 wk in vehicle-treated mice, but aortic Ca decreased in mice treated with BMP-7. (B) The serum phosphorus was unchanged between 22 and 28 wk but was reduced to normal levels by treatment with BMP-7. Data are group means ± SEM (n = 4 to 7).
Table 1.
Biochemical parameters in the various groups of micea
| Parameter | Group 1 | Group 2 | Group 3 | Group 4 | Group 5 | Group 6 | Group 7 |
|---|---|---|---|---|---|---|---|
| Mouse strain | LDLR−/− | LDLR−/− | LDLR−/− | LDLR−/− | LDLR−/− | LDLR−/− | LDLR−/− |
| Diet | Fat | Fat | Fat | Fat | Fat | Fat | Fat |
| Surgery | CKD | CKD | CKD | CKD | CKD | CKD | CKD |
| Weeks postnatal | 22 | 28 | 28 | 28 | 28 | 28 | 28 |
| Treatment | BMP-7 | Sevelamer 1% | Sevelamer 3% | CaCO3 3% | Lanthanum 3% | ||
| n | 7 | 7 | 4 | 6 | 5 | 5 | 5 |
| Presurgical weight | 21.740 ± 0.751 | 17.600 ± 0.390 | 20.050 ± 0.674 | 22 | 22 | 19.950 ± 0.712 | 17.400 ± 0.702 |
| Weight at killing | 21.640 ± 0.954 | 18.300 ± 0.839 | 21.470 ± 0.383 | 29 | 28 | 20.500 ± 0.694 | 19.500 ± 0.687 |
| Ca (mg/dl) | 10.550 ± 0.396 | 7.800 ± 0.214 | 8.370 ± 0.229 | 10.400 ± 0.230 | 13.000 ± 0.900 | 6.900 ± 0.589 | 8.200 ± 0.300 |
| Phosphorus (mg/dl) | 10.800 ± 0.802 | 10.940 ± 1.092 | 6.325 ± 0.471 | 8.400 ± 0.900 | 6.200 ± 0.400 | ND | 9.700 ± 0.400 |
| BUN (mg/dl) | 53.540 ± 3.930 | 62.710 ± 3.740 | 52.500 ± 5.172 | 67.000 ± 7.500 | 59.000 ± 7.400 | 58.000 ± 10.625 | 40.000 ± 5.300 |
| Glucose (mg/dl) | 288.0 ± 122.8 | 247.0 ± 24.0 | 191.0 ± 13.8 | 291.0 ± 21.0 | 337.0 ± 68.0 | 124.0 ± 13.2 | 201.0 ± 19.0 |
| Cholesterol (mg/dl) | 1210.0 ± 526.2 | 1188.0 ± 129.6 | 911.6 ± 93.7 | 656.0 ± 137.0 | 675.0 ± 56.8 | ND | 889.0 ± 80.0 |
Effects of CaCO3 on serum Pi, glucose, and cholesterol were reported by Davies et al.20 BUN, blood urea nitrogen; ND, not done (serum used in development of a new assay for fetuin).
Figure 2.
Effects of CaCO3 and LaCO3, both 3% mixed in the diet, on VC in CKD. Whereas VC significantly increased from 22 to 28 wk in vehicle-treated mice, aortic Ca was decreased below levels at 22 wk in mice treated with 3% CaCO3. there was no significant change from 22 wk in the 3% LaCO3-treated mice. Data are group means ± SEM (n = 4 to 5).
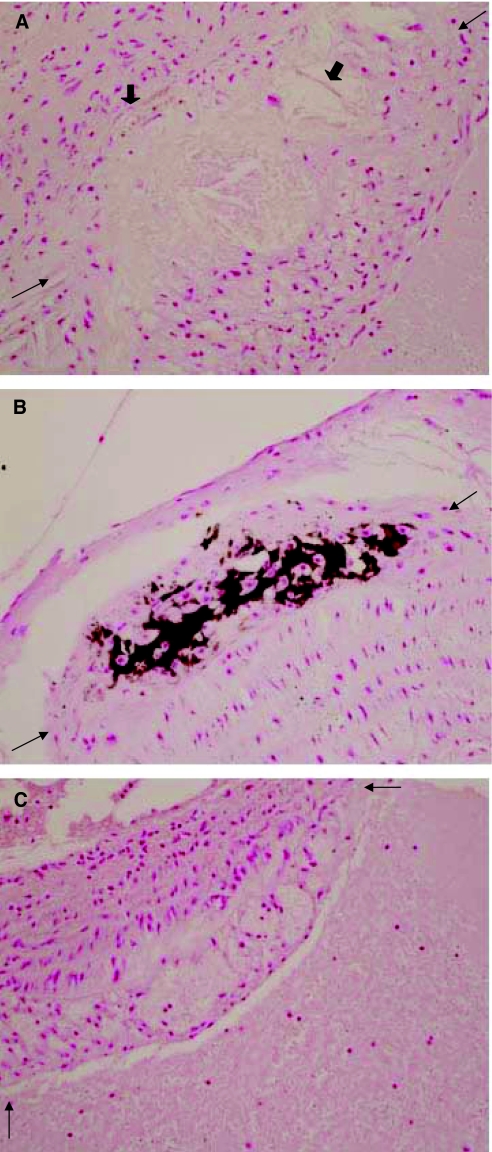
Although we were unable to quantify the effects of the treatments reported here on aortic atherosclerotic lesions because the aortas of the experimental animals were destroyed by the technique of quantifying the aortic Ca content, we enrolled additional mice to the study for qualitative analysis of aortas. VC was largely aortic atherosclerotic plaque associated (Figure 3), and punctate calcifications in the tunica media were observed. Treatment with BMP-7, CaCO3, or LaCO3 diminished plaque-associated Ca deposition, but they did not decrease the size of the atherosclerotic lesions (Figure 3).
Figure 3.
Sections of the proximal aorta demonstrating large calcified atherosclerotic plaques in the LDLR−/− high fat–fed mice. (A) Large lipid-laden plaque (between arrows) in proximal aorta of a sham-operated high fat–fed LDLR−/− mouse. Thick arrows identify focal calcifications in the base of the plaque. (B) A large calcified plaque (between arrows) in the proximal aorta of a CKD high fat–fed LDLR−/− mouse. (C) A large lipid-laden plaque (between arrows) in the proximal aorta of a BMP-7–treated CKD high fat–fed LDLR−/− mouse. The stain is alizarin red. Magnification, ×400.
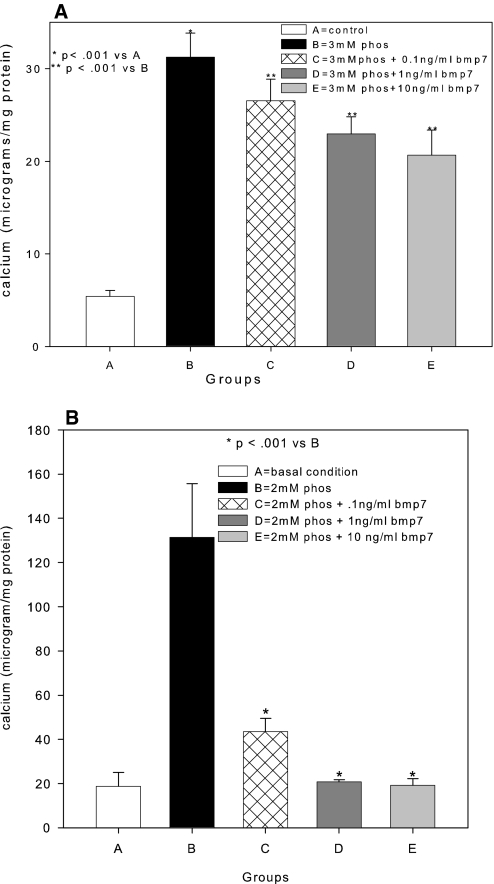
To analyze the mechanism of phosphorus-stimulated VC, we examined matrix mineralization by human VSMC (hVSMC) isolated from atherosclerotic donors (Table 2) in vitro to mimic our atherosclerotic mouse model. We increased the media phosphorus to mimic the hyperphosphatemia of CKD. The concept of the model follows previously established calcifying VSMC culture systems10–12 adapted to human tissues. Our hVSMC did not mineralize the ECM in basal conditions, but when exposed to an increase in phosphorus of 1 mM over that already present in the culture media (final Pi 2 mM), the hVSMC mineralized their matrix over time (Figure 4). BMP-7 exposure for 14 (Figure 4A) or 21 d (Figure 4B) in high-phosphorus media decreased mineralization of the ECM.
Table 2.
Characterization of hVSMC culture matrix Ca content isolated from atherosclerotic aortas
| Donor | Passage Studied | Matrix Ca Content
|
||
|---|---|---|---|---|
| Basal Condition | Effects of 2 mM PO4 | Effects of 10 ng/ml BMP-7 | ||
| 1 | 2 | 4.3 | 29.9 | 20.3 |
| 2 | 3 | 6.5 | 31.1 | 20.6 |
| 3 | 3 | 5.3 | 28.7 | 18.0 |
| 4 | 2 | 5.6 | 28.6 | 17.9 |
| 5 | 3 | 5.7 | 35.6 | 25.8 |
| 6 | 3 | 4.9 | 31.4 | 19.8 |
| 7 | 2 | 5.5 | 33.5 | 22.1 |
Figure 4.
Stimulation of matrix mineralization in cultures of hVSMC isolated from atherosclerotic donors. hVSMC from seven donors were grown in DMEM as described in the Concise Methods section (group A) or DMEM supplemented with 1 mM NaH2PO4/NaHPO4 (pH 7.4; group B). In groups C, D, and E, 0.1, 1, and 10 ng/ml BMP-7, respectively, was added to the NaH2PO4/NaHPO4-supplemented media. Cultures were ended at 14 (A) and 21 d (B). Data are means ± SEM (n = 7 donors).
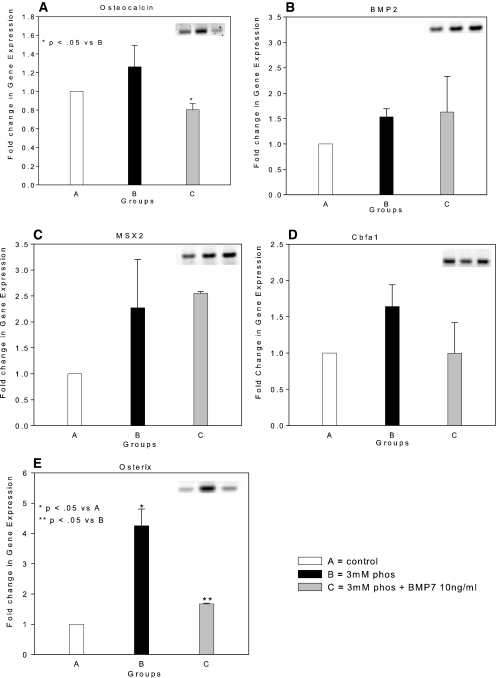
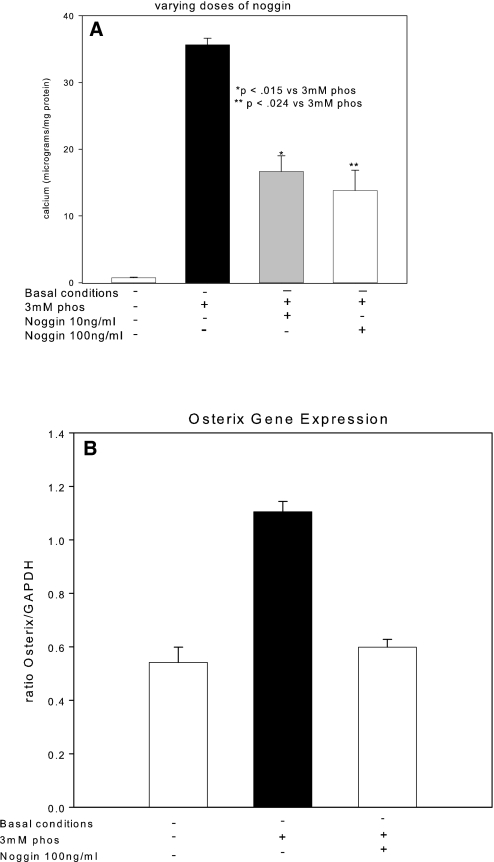
We used reverse transcriptase–PCR (RT-PCR) to demonstrate that the hVSMC primary cultures expressed osteocalcin, the marker of the differentiated osteoblast31,32 (Figure 5A), in agreement with our previous immunohistologic studies in vivo,19 suggesting that osteoblastic differentiation may be the mechanism of heterotopic mineralization. Transcription of BMP-2 and MSX2 (Drosophila, muscle segment homolog), inducers of osteoblastic differentiation,33,34 was present in our primary cultures, in agreement with this possibility (Figure 5, B and C), but their levels were not induced by high-phosphorus conditions. Likewise, RUNX2/Cbfa1, the osteoblast tissue-specific transcription factor,17,35 was expressed in our untreated hVSMC cells (Figure 5D) and not stimulated by media phosphorus; however, the second osteoblast tissue-specific transcription factor downstream of BMP-2 and BMP-4, osterix,24,25 was expressed at low levels until it was induced by high-phosphorus culture media (Figure 5E). RUNX2 and osterix are osteoblastic transcription factors24,25,35 that are capable of guiding mesenchymal lineage cells through the osteoblastic program directed by the osteoblastic morphogens BMP-2 and -4.34 The stimulation of the developmental late-stage second osteoblast-specific transcription factor, osterix, by high phosphate was the final step in osteoblastic differentiation that resulted in mineral deposition in the ECM, as shown by reversal of mineralization when osterix was inhibited by BMP-7 treatment (Figures 4 and 5E); however, the critical role of BMP-2 in inducing osteoblastic differentiation and mineralization was demonstrated by the elimination of mineralization in high-phosphorus media when an inhibitor of BMP-2, noggin, was added (Figure 6A). BMP-7 failed to affect expression of the BMP-2 pathway upstream of osterix (BMP-2 and RUNX2; Figure 5, B through D), but it strongly inhibited osterix expression (Figure 5E) and expression of proteins that are markers of the osteoblastic phenotype (Figure 5A). Addition of noggin (Figure 6B) also inhibited high-phosphorus media–stimulated osterix expression, suggesting that the actions of high phosphorus are cooperative with the BMP-2–and -4–stimulated osteoblastic differentiation.
Figure 5.
Stimulation of a BMP-2/MSX2-directed osteoblastic differentiation program by NaH2PO4/NaHPO4 through induction of osterix. Basal levels of gene expression in hVSMC cultured in DMEM as described in the Concise Methods section and detected by RT-PCR (insets) were set as a reference value of 1 (□, group A). Fold induction by high phosphorus [2 mM NaH2PO4/(Na)2HPO4] culture media (▪, group B) and 2 mM phosphorus plus 10 ng/ml BMP-7 (□, group C) was determined. An osteoblastic transcriptional program directed by BMP-2/MSX2 was present in hVSMC cultures as demonstrated by the presence of osteocalcin (A), BMP-2 (B), MSX2 (C), and RUNX2 (D) gene transcription. (E) Osterix was only weakly expressed in basal culture conditions. Phosphorus stimulated transcription of osterix. BMP-7 inhibited osterix and osteocalcin expression. Data were normalized to the expression level in basal culture conditions and expressed as fold induction (mean ± SEM; n = 3).
Figure 6.
Effects of a BMP-specific inhibitor, noggin, on VSMC mineralization and gene expression. (A) Noggin (10 to 100 ng/ml), added to high-phosphorus media (□), inhibited matrix mineralization stimulated by phosphorus. (B) Noggin, 100 ng/ml, blocked phosphorus-induced osterix expression.
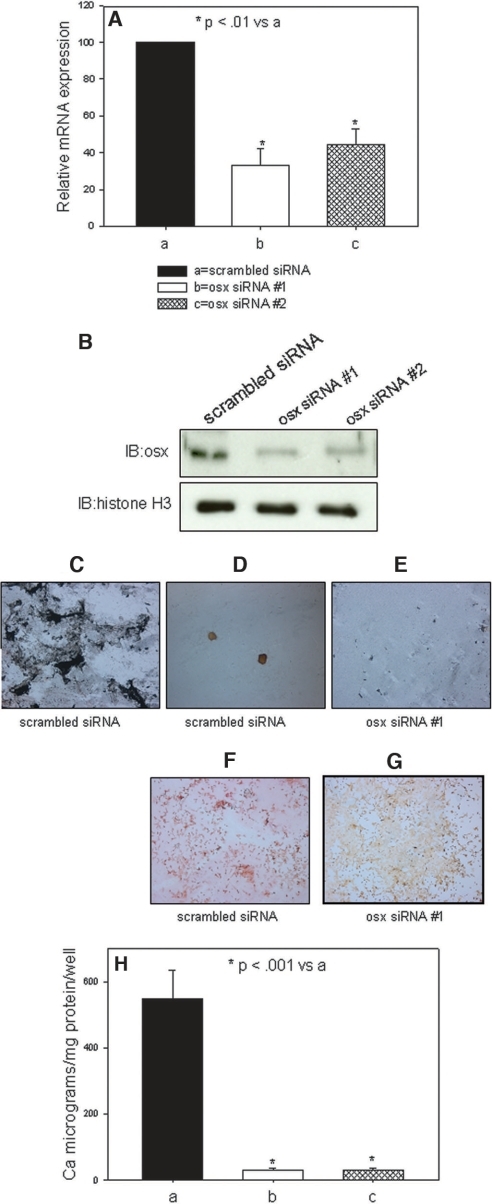
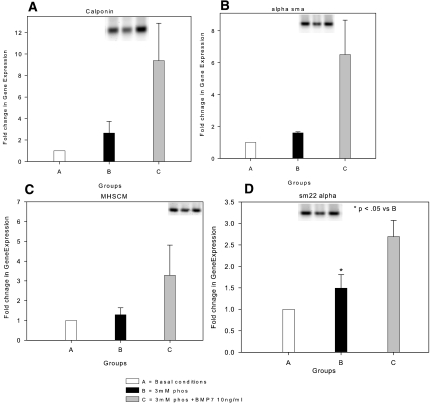
In a phosphate-responsive mineralizing cell line, SAOS, retroviral-induced expression of osterix siRNA, as described in the Concise Methods section, blocked high-phosphate media–stimulated matrix mineralization as expected, whereas retroviral-induced scrambled siRNA from the osterix sequence responded to the high-phosphate high leucine (HL-1) media (Figure 7). Whereas BMP-7 exhibited actions besides inhibition of osterix, such as stimulating the hVSMC contractile phenotype, phosphorus did not affect transcription of these biomarkers (Figure 8), so they were not likely to be the mechanism of BMP-7 inhibition of phosphorus action. Expression of VSMC biomarkers, as shown in Figure 8, was reduced in our cultures derived from atherosclerotic aortas, possibly reflecting the abnormal phenotype of VSMC in the neointima associated with atherosclerotic plaques. The low basal levels may have been the basis for the absence of a high-phosphorus media effect to reduce their expression, as shown by other investigators.11,36
Figure 7.
Effects of osterix knockdown on phosphorus-stimulated mineralization by osteoblast-like cells. SAOS cell lines expressing siRNA to osterix were developed as described in the Concise Methods section. (A) The levels of mRNA to osterix were decreased by >50% in two separate cell lines (osx siRNA #1 and osx siRNA #2). (B) Protein levels of osterix were greatly diminished by Western analysis in osx siRNA #1 and osx siRNA #2. Histone H3 levels were determined as a loading control on the Western blots. (C through G) Von Kossa (C through E) and alizarin red (F and G) stains of cultures stimulated by high-phosphorus conditions. (C) Mineralized nodules in the periphery of wells containing cells expressing the scrambled siRNA at 7 d in the high-phosphorus mineralizing conditions. (D) Mineralized nodules in the center of wells containing cells expressing the scrambled siRNA at 7 d in the high-phosphorus mineralizing conditions. (E) Absence of mineralization detected by von Kossa staining in periphery of wells expressing osx siRNA #1 at 7 d in the high-phosphorus mineralizing conditions. (F) Alizarin red–stained nodules in the periphery of wells containing cells expressing the scrambled siRNA at 7 d in the high-phosphorus mineralizing conditions. (G) Absence of mineralization detected by alizarin red staining in periphery of wells expressing osx siRNA #1 at 7 d in the high-phosphorus mineralizing conditions. The orange is the background stain in alizarin red–negative stains. (H) Ca levels in the matrices of cultures of cell lines expressing siRNA to osterix.
Figure 8.
Expression of contractile VSMC markers in hVSMC. (A through C) Calponin (A), α-smooth muscle actin (α-SMA) (B), heavy-chain myosin (MHSCM) (C), and SM22 α (D) message levels detected by RT-PCR were low in hVSMC in basal conditions (□, group A) and in the presence of high-phosphorus media (▪, group B). BMP-7 (□, group C) induced expression of each of the marker proteins. Data were normalized to the expression level in basal culture conditions and expressed as fold induction (mean ± SEM, n = 3).
Our data demonstrating inhibition of a BMP-2/4 directed program by another closely related BMP that is generally but not always37 complementary in osteoblast function, BMP-7, is not surprising. This is exactly what occurs in several biologic situations, including kidney development, in which BMP-2 inhibits BMP-7–stimulated branching morphogenesis38—also, in collecting duct function, in which BMP-2 inhibited proliferation and induced apoptosis, whereas low-dosage BMP-7 stimulated proliferation.39 This is possibly due to use of different receptors40 and Smad-independent signal transduction.
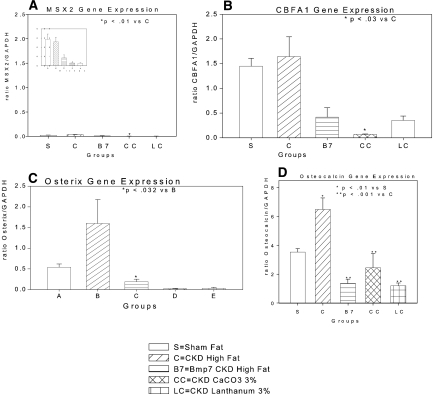
To relate the mechanism of phosphorus action detected in vitro to our model of CKD-induced VC and hyperphosphatemia in vivo, we analyzed aortic expression of the osteoblastic lineage genes including osterix message levels by real-time RT-PCR. In the high fat–fed sham-operated mice, we found expression of BMP-2 (data not shown), MSX2 (Figure 9A), and RUNX2 (Figure 9B), in agreement with recent data from Shao et al.,27 but osterix was only weakly expressed (Figure 9C). Osterix was strongly induced by CKD (Figure 9C), and treatment with BMP-7 or CaCO3, shown in Figures 1 and 2, to partially reverse VC reduced osterix and RUNX2 expression (Figure 9, B and C). Aortic expression of osteocalcin was diminished by BMP-7, CaCO3, or LaCO3 therapy (Figure 9D), compatible with inhibition of osterix activity and the osteoblastic transcriptional program.32,41
Figure 9.
Gene expression in aortas of various groups of LDLR−/− high fat–fed mice measured by real-time RT-PCR. The various groups of mice were as follows: sham operated (s), CKD vehicle treated (C), CKD BMP-7 treated (B7), CKD 3% CaCO3 treated (CC), and CKD 3% LaCO3 treated (LC). (A) MSX2 expression was low, not induced by CKD, and suppressed with each of the three treatments. Inset shows data for scale of the ratio between 0.0 and 0.5. (B) CBFA1 expression was not stimulated by CKD, but it was inhibited by BMP-7, 3% CaCO3, and 3% LaCO3 treatment. (C) Osterix expression was stimulated by CKD and was inhibited by BMP-7, CaCO3, or LaCO3 treatment. (D) Osteocalcin expression was strongly induced by CKD (note different y axis scale) and inhibited by BMP-7, CaCO3, or LaCO3. The number of aortas/mice in each group was four. Data are means of the transcript levels relative to GAPDH expression in each aorta ± SEM.
DISCUSSION
Our data extend previous studies demonstrating that CKD stimulates vascular mineralization.19,20,42,43 Our animal model, the LDLR−/− mouse fed a high-fat diet, is an animal model of atherosclerosis, and because of hyperlipidemia, obesity, and insulin resistance, the metabolic syndrome. In this animal model, VC develops in aortic atherosclerotic neointima19,26 associated with expression of an osteoblastic differentiation program directed by BMP-2 and MSX2 along with the transcriptional effects of the osteoblast transcription factor RUNX2.27,33 Our data demonstrate that MSX2 is expressed in low levels in the high fat–fed atherosclerotic aorta, in agreement with Cheng et al.,33 who proceeded to overexpress MSX2 to demonstrate its role in osteoblastic VC. Shao et al.27 also demonstrated activation of adventitial Wnt activity in the LDLR−/− high fat–fed model, but we have shown that CKD induced perivascular Wnt inhibitors,44 and the role of Wnt activity in CKD-induced VC requires further study. These studies and our previous studies demonstrate major intensification of the neointimal calcification induced by CKD in this model.19,20 Our results are also in agreement with our previous study in that the induction of CKD was associated with the development of hyperphosphatemia and that treatment with BMP-7 corrected hyperphosphatemia.20 The effect of BMP-7 to correct hyperphosphatemia has been shown to be due to stimulation of bone formation,20 and correction of hyperphosphatemia has been preventive in the development of CKD-stimulated VC.20,30
A major extension of the published data provided by the data herein is the demonstration that established vascular mineralization levels can be diminished by BMP-7 and hyperphosphatemia control. Reduction of existing vascular mineral deposits with pharmacologic treatment is a significant step forward in atherosclerosis therapy. It makes a strong case for the mechanism of the atherosclerotic mineralization process to be an active biologic remodeling mechanism. One such mechanism would be akin to skeletal remodeling, whereby mineral deposition (bone formation) is linked to mineral resorption. Resorption of existing deposits at a rate greater than formation (adding to or creating new deposits) is the most reasonable explanation of our results. Because tartrate resistant acid phosphatase (TRAP)-positive multinucleated osteoclast-like cells have been demonstrated in the neointima,14,45,46 we interpreted the decrease in the vascular mineralization in CaCO3- and BMP-7–treated animals to be compatible with decreased formation of vascular mineral deposits and continued resorption.
Reduction of CKD-induced VC in our animal model with control of the hyperphosphatemia is evidence of reversal of a phosphorus-stimulated effect. In our studies in vitro, phosphorus stimulated mineralization through activation of a BMP-2–directed vascular osteoblastic program through the actions of osteoblast-specific transcription factors. The osteoblastic program was present in our cell cultures, as demonstrated by the presence of BMP-2 and MSX2 expression, the presence of RUNX2, and the targets of RUNX2 transcriptional activity such as osteocalcin.17,41 The finding of BMP-2 and -4 and RUNX2 expression in hVSMC derived from atherosclerotic aortas differs from the results of primary cultures of normal aortas without atherosclerosis; however, mineralization was not present as a result of insufficient expression of osterix, a critical osteoblastic tissue-specific transcription factor,24,47 which was stimulated by the addition of media phosphorus and is downstream of BMP-2 but not necessarily RUNX2.25 That high-phosphorus media induced mineralization was indeed due to activity of the osteogenic program was demonstrated by its inhibition with a BMP antagonist, noggin. Interruption of the program through inhibition of the transcription factor osterix as with BMP-7 treatment or by siRNA to osterix was sufficient in the presence of high-phosphorus media to eliminate mineralization. Thus, phosphorus was an active signaling molecule leading to increased osterix expression and not just a physical-chemical mineralization force, in agreement with other studies in vitro.10,11,22 These studies11,22 have established that the action of phosphorus is related to the activity of the Pit1 sodium-dependent transporter in VSMC, as suggested in osteoblasts.48 Its role as a signal molecule may be through Pit1-induced activation of a membrane-associated signaling complex similar to that known to associate with the sodium-dependent transport protein of the proximal tubule and osteoclasts, NaPi2a.49
Our data in vivo were directly related to our in vitro model. In agreement with previous studies,27 the BMP-2/MSX2 program was induced in the aorta by high-fat feeding, analogous to our basal condition hVSMC cultures from atherosclerotic donors; however, CKD was the major stimulus to VC in our model, analogous to the effect of phosphorus in vitro. CKD induced expression of osterix in the aorta, similar to the effect of phosphorus in vitro. Control of hyperphosphatemia by two separate therapeutic strategies reversed VC and returned aortic osterix and RUNX2 expression to levels below that in aortas of sham-operated high fat–fed mice. Thus, our data demonstrate activation of an osteoblastic program in the vasculature as the pathogenesis of CKD-stimulated atherosclerotic calcification, in agreement with data from other investigators.12,18
Regarding the role of phosphorus, our translational data are in agreement with human clinical observations of Chertow et al.50 and Block et al.51 in vivo and several laboratories in vitro.9–11 Our data are the first to demonstrate clearly that phosphorus causes VC in vivo and that the mechanism of phosphorus action is through stimulation of a heterotopic osteoblastic differentiation program. Our data are in agreement with the human epidemiologic studies relating hyperphosphatemia to cardiovascular mortality in CKD,3,4 and they offer a mechanism of hyperphosphatemia action. The studies reported here provide a mechanism of hyperphosphatemia-induced atherosclerotic VC in CKD. They may not be related to the calcification of the elastic lamina of the arterial media that is also stimulated in CKD. This process is distinct from osteoblastic mineralization, whereby the matrix mineralization substrate is type 1 collagen.
We conclude, first, that CKD stimulates VC in part through increasing atherosclerotic calcification. Second, atherosclerotic calcification is due to heterotopic expression of osteoblastic differentiation and function in the vasculature. Third, hyperphosphatemia is a cardiovascular risk factor in CKD through stimulation of VC. The mechanism of phosphorus-mediated induction of VC is through its stimulation of osterix in the vascular neointima and tunica media in CKD. Phosphorus-stimulated activity of osterix permitted a BMP-2/MSX2–directed program to be completed and mineralization to be stimulated.
CONCISE METHODS
Animals and Diets
LDLR−/− mice on a C57Bl/6J background were purchased from Jackson Laboratory (Bar Harbor, ME) and bred in a pathogen-free environment. Mice were weaned at 3 wk to a chow diet (1:1 mixture of Pico Lab rodent chow 20 (Purina, Richmond, IN) and mouse chow 20; 6.75% calories as fat). At 10 wk, mice were either continued on this chow diet or initiated on a high-cholesterol (0.15%) diet containing 42% calories as fat (product no. TD88137; Harlan Teklad, Madison WI). For some mice, the diet was supplemented with 1 or 3% CaCO3. Diets supplemented with CaCO3 were previously reported.20 Mice were given access to water ad libitum. BMP-7 was provided by Johnson & Johnson (Raritan, NJ). The Washington University Animal Care and Use Committee approved the study protocol. Animal experiments were performed according to the National Institutes of Health Guide for the Care and Use of Laboratory Animals and approved by the Washington University Animal Studies Committee.
Induction of CKD
A two-step procedure was used to create uremia as described previously.19,21 Saphenous vein blood samples were taken 1 wk after the second surgery to assess baseline postsurgical renal function. Mice were killed under anesthesia 28 wk postnatal. When the mice were killed, blood was taken by intracardiac stab, and the heart and the aorta were dissected en block. The BMP-7–treated group received intraperitoneal injection of BMP-7 10 μg/kg dry wt once weekly in 100 μl of vehicle (mannitol [5% wt/vol], Na acetate buffer [20 mM)pH 4.0 to 4.5)], and sterile water). This is the same dosage used in our previous studies.19,20
Mice were allocated to one of seven CKD high fat–fed groups after the second surgery: Other control groups included LDLR−/− sham-operated mice on chow die, and LDLR−/− mice with CKD on chow diet. C57B16 wild-type mice fed chow served as the normal benchmark source. Data from these control groups are not presented. Group 1 was LDLR−/− mice on the high-fat diet and killed at 22 wk. Group 2 was LDLR−/− mice that had CKD and were fed the high-fat diet and treated weekly from 22 to 28 wk with vehicle intraperitoneally. This group was expected to develop high serum phosphorus and VC. Group 3 was the first treatment group. These were LDLR−/− mice that had CKD and were on high-fat diet and received BMP-7 treatment (10 μg/kg intraperitoneally weekly). Group 4 was LDLR−/− mice that had CKD and were on high-fat diet and treated with sevelamer CO3 1%. Group 5 was LDLR−/− mice that had CKD and were on high-fat diet and treated with sevelamer CO3 3%. Group 6 was LDLR−/− mice that had CKD and were on high-fat diet and treated with CaCO3 3%. Group 7 was LDLR−/− mice that had CKD and were on high-fat diet and treated with LaCO3 3%. Once the mice were randomized into groups, they were allowed to develop calcification from weeks 14 through 22 postnatal. Therapy was initiated at 23 wk postnatal and continued until week 28 postnatal, at which time the mice were examined.
Blood Tests
Serum was analyzed on the day of blood draw for blood urea nitrogen, cholesterol, Ca, and phosphate by standard laboratory methods. Before initiation of therapy, blood was obtained through saphenous vein. When the mice were killed, blood was obtained through intracardiac stab.
Tissue Preparation
Resected specimens were flash-frozen in liquid nitrogen, then divided as follows: The heart, ascending aorta, and aortic arch were separated from the descending aorta and bisected sagittally through the aortic outflow tract. The descending aorta was bisected coronally, approximately halfway along its length. For visualization of calcification in the tissue sections, slices (5 μm thick) were cut and stained with von Kossa and Trap staining.
Chemical Calcification Quantification
Aorta and hearts were dissected at time of killing, and all extraneous tissue was removed by blunt dissection under a dissecting microscope. Tissues were desiccated for 20 to 24 h at 60°C, weighed, and crushed to a powder with a pestle and mortar. Ca was eluted in 1 N HCL for 24 h at 4°C. Ca content of eluate was assayed using a cresolphthalein complexone method (Sigma, St. Louis, MO), according to the manufacturer's instructions, and results were corrected for dry tissue weight for heart and aorta.
Cell Culture
Human adult aortas were obtained from seven cadaveric organ donors that were rejected because of atherosclerosis by Mid-America Transplant Services (St. Louis, MO) and enzymatically digested to obtain human smooth muscle cells. Medial tissue was separated from the adventitia and intima and digested with collagenase type I (Worthington, Lakewood, NJ) 2 mg/ml for 1 h and washed with HBSS. Further digestion followed with collagenase type II 1 mg/ml (Worthington) and elastase 0.25 mg/ml (Worthington) for 4 h. Cell suspensions were washed twice with HBSS and cultured in T-75 flasks for 3 wk in a 95%/5% air/CO2-humidified environment at 37°C. The growth medium used was DMEM containing 4.5% glucose (high glucose), 10% FBS (Atlas, Fort Collins, CO), 1 mM sodium pyruvate, 100 U/ml penicillin, and 100 mg/ml streptomycin (Sigma). Cell purity was assessed by positive immunostaining for α-smooth muscle actin and calponin and for the absence of von Willebrand factor. In all experimental protocols, cells were seeded at 1 × 10⁵ cells/well in six-well plates. Medium was changed on the first day and every third day thereafter. In all cases, cells used were between passages 2 and 5 (Table 2).
Induction of Calcification
At the time of confluence, cells were switched to mineralization medium consisting of DMEM supplemented with 1 or 2 mM Pi. For cells exposed to BMP-7 treatment, fresh mineralization medium containing either vehicle (mannitol, acetic acid, and acetate) or BMP-7 in vehicle was added at 0.1, 1.0, 10, or 100 ng/ml. The medium was changed every 2 or 3 d. Noggin (PeproTech, Rocky Hill, NJ) was added to the mineralization medium at a final concentration of 100 ng/ml. Ca content was quantified and normalized to cellular protein as described previously.11,52
RT-PCR
RNA was extracted from cell cultures using RNeasy Mini Kits (Qiagen, Valencia, CA). Semiquantitative RT-PCR was conducted using Roche First Strand cDNA Synthesis Kit (Indianapolis, IN) and PCR kit from Invitrogen (Grand Island, NY) according to manufacturers' instructions using a two-step method. A total of 1 μg of total RNA was reverse-transcribed, and random primers were added for 60 min at 42°C before PCR. Forward and reverse primers (Table 3) were added, and the reactions were subjected to PCR for 20 to 35 cycles. The number of cycles necessary to amplify cDNA but remain within the exponential amplification range was determined for each primer set. Glyceraldehyde-3-phosphate dehydrogenase (GAPDH) was used as internal standard to assess loading. Genomic contamination was assessed by heat inactivation of the reverse transcriptase before RT-PCR. Primers were designed using Vector NTI software (Invitrogen), and optimal conditions for each primer pair were determined (Table 3). A PerkinElmer (Waltham, MA) DNA Thermal Cycler was used to perform the reaction. Products were separated on a 2% agarose E-gel (Invitrogen) and visualized with ethidium bromide. The band intensity was analyzed first by scanning the gel on a Typhoon 9410 gel imager (Amersham Biosciences, Piscataway, NJ), quantified by using TotalLab software v2003.03 (Nonlinear Dynamics, Durham, NC), and normalized for loading by comparison with GAPDH. Negative controls were performed by inactivation of the reverse transcriptase by boiling for 5 min before RT-PCR to ensure that genomic DNA was not amplified.
Table 3.
Primer Sequence
| Gene | Primer | Sequence(5′-3′) | Product Length (bp) | Tm (°C) |
|---|---|---|---|---|
| Myocardin | Forward | GAGAGGTCCATTCCAACTGCTCAGATGAAG | 249 | 62 |
| Reverse | GTCTTCACTTCGAGTCTGATCCGGAGAAAG | |||
| Calponin | Forward | AGCATGTCCTCTGCTCACTTCAACC | 154 | 60 |
| Reverse | CGTCCATGAAGTTGTTGCCGAT | |||
| SM22 α | Forward | TGGGTGGTGATCCACTGGATC | 179 | 59 |
| Reverse | TTGCCTTGAGTCAGTGCGCC | |||
| α−SMA | Forward | AGCCCAGCCAAGCACTGTCA | 130 | 62 |
| Reverse | GAGCATCGTCCCCAGCAAAG | |||
| Myosin heavy chain | Forward | GAAGATCGTCGACATGTACAAGGG | 122 | 57 |
| Reverse | TGCATAGAATGGACTGGTCCTCC | |||
| Matrix Gla protein | Forward | GCTACACAAGACCCTGAGACTGACC | 192 | 61 |
| Reverse | TCTCCATCTCTGCTGAGGGGAT | |||
| Cbfa1 | Forward | CACGACAACCGCACCATGGT | 181 | 61 |
| Reverse | TGACAGTAACCACAGTCCCATCTG | |||
| MSX2 | Forward | GCTGGTGAAGCCCTTCGAGA | 173 | 59 |
| Reverse | ATGTGGTAAAGGGCGTGCG | |||
| Osterix | Forward | AGTTCATGGCTCCAGTCCCC | 146 | 60 |
| Reverse | TGGAGGCTGAAAGGTCACTGC | |||
| BMP-2 | Forward | AGCCAACACTGTGCGCAGCT | 140 | 63 |
| Reverse | CCTGAAGCTCTGCTGAGGTGATAA | |||
| Osteocalcin | Forward | ATGAGAGCCCTCACACTCCTC | 297 | 60 |
| Reverse | GCCGTAGAAGCGCCGATAGGC | |||
| GAPDH | Forward | TCCTGTTCGACAGTCAGCCG | 122 | 60 |
| Reverse | TGGTGACCAGGCGCCCAATA | |||
| Mouse osterix | Forward | TCCCTTCTCAAGCACCAATGGACT | 230 | 60 |
| Reverse | AGCTGTGAATGGGCTTCTTCCTCA | |||
| Mouse GAPDH | Forward | TGTTCCAGTATGACTCCACTCACG | 170 | 60 |
| Reverse | GAAGACACCAGTAGACTCCACGACA | |||
| Mouse Cbfa1 | Forward | TGCAAGAAGGCTCTGGCGT | 200 | 60 |
| Reverse | CGCTGAAGAGGCTGTTTGACG | |||
| Mouse MSX2 | Forward | ACCACGTCCCAGCTTCTAGC | 183 | 60 |
| Reverse | GCTCTGCGATGGAGAGGTACTG | |||
| Mouse osteocalcin | Forward | TCATGTCCAAGCAGGAGGGCAATA | 292 | 58 |
| Reverse | TGACATCCATACTTGCAGGGCAGA |
Real-Time Quantitative RT-PCR
After reverse transcription, real-time PCR was performed using the MX 4000 (Stratagene, La Jolla, CA), SYBR Green (Sigma), and the PCR kit from Invitrogen. Each reaction was performed in triplicate at 95°C for 45 s, 60°C for 30 s, and 60 s at 72°C for 40 cycles. This was followed by a melt cycle, which consisted of stepwise increase in temperature from 72 to 99°C. A single predominant peak was observed in the dissociation curve of each gene, supporting the specificity of the PCR product. CT numbers (threshold values) were set within the exponential phase of PCR and were used to calculate the expression levels of the genes of interest. GAPDH was used as an internal standard and used to normalize the values. A standard curve consisting of the CT versus log cDNA dilutions (corresponding to the log copy numbers) was generated by amplification of serial dilutions of cDNA corresponding to an unknown amount of amplicon.
Osterix siRNA Constructs
The human osterix siRNA target sequences were designed by Enhanced siDirect (RNAi Co., Ltd., Tokyo, Japan; Table 3). The 63-mer sense and antisense strands of DNA oligonucleotides were synthesized by Integrated DNA Technologies (Coralville, IA). Construction of a retroviral vector for delivery of siRNA was performed using the pSilencer 5.1-H retroviral system (Ambion, Austin, TX) according to the manufacturer's instructions. Scrambled siRNA negative control retroviral vector was purchased from Ambion.
Establishment of Stably Infected Cells
Subconfluent Phoenix-A packaging cells, which were a gift from Dr. Garry Nolan (Stanford University School of Medicine, Stanford, CA), were transfected with siRNA retroviral vectors (8 μg DNA/100-mm dish) using FuGene 6 (Roche, Basel, Switzerland). After 48 h, the supernatant was collected, filtered through a 0.45-μm syringe filter, and used to transduce target cells. Each supernatant (5 ml) was mixed with 8 μg/ml polybren (Sigma). This infection cocktail (10 ml) was used to infect into SAOS cells (2 × 10⁵ cells/100-mm dish) for 6 h. Infected cells were selected in the presence of 4 μg/ml puromycin (Sigma) for 3 d, and infected cells were assayed.
Immunoblotting
For evaluation of the effect of knockdown by siRNA, nuclear lysate of cells was assayed by immunoblotting using specific antibodies for osterix (Santa Cruz Biotechnology, Santa Cruz, CA) and histone H3 (Cell Signaling, Danvers, MA). Histone H3 antibodies were used as a loading control.
Mineralization Assay
For induction of mineralization in vitro, infected cells were cultured in serum free HL-1 media (Lonza, Walkersville, MD) with 50 μg/ml ascorbic acid (Sigma) for 7 d. After 7 d of culture, infected cells were stained by von Kossa or alizarin red to detect mineralization. For Ca quantification, Ca was dissolved in 0.1 M Tris buffer (pH 7.2) including 0.1% Triton X-100 and 4 N HCL for 16 h after sonication. The content of dissolved Ca was measured by Calcium C-Test (Wako, Richmond, VA).
Statistical Analyses
Data were analyzed for statistical significance (P < 0.05) using ANOVA. Comparisons were made between mice that were killed at 22 wk (control group) and those that were killed at 28 wk and treated with BMP-7, CaCO3, or LaCO3. For the cell culture, system data were analyzed for statistical significance (P < 0.05) using ANOVA. These analyses were performed with Systat (Systat Software Inc., Point Richmond, CA).
DISCLOSURES
None.
Acknowledgments
This work was supported by National Institutes of Health grants DK059602, DK070790, and AR41677 (K.A.H., principal investigator). Additional research funding was provided through grants from Shire, Johnson & Johnson, and Genzyme.
Portions of this body of work were presented in abstract form (J Am Soc Nephrol 19: 44A, 2006).
We thank Francis Farrell, PhD, Kuber Sampath, PhD, and Steven Burke, MD, for valuable discussion and review of the manuscript. We thank Mid-America Transplant Services for providing the atherosclerotic aortas used for the hVSMC cultures.
Published online ahead of print. Publication date available at www.jasn.org.
REFERENCES
- 1.Go AS, Chertow GM, Fan D, McCulloch CE, Hsu Cy: Chronic kidney disease and the risks of death, cardiovascular events, and hospitalization. N Engl J Med 351: 1296–1305, 2004 [DOI] [PubMed] [Google Scholar]
- 2.Berl T, Henrich W: Kidney-heart interactions: Epidemiology, pathogenesis, and treatment. Clin J Am Soc Nephrol 1: 8–18, 2006 [DOI] [PubMed] [Google Scholar]
- 3.Kestenbaum B, Sampson JN, Rudser KD, Patterson DJ, Seliger SL, Young B, Sherrard DJ, Andress DL: Serum phosphate levels and mortality risk among people with chronic kidney disease. J Am Soc Nephrol 16: 520–528, 2005 [DOI] [PubMed] [Google Scholar]
- 4.Slinin Y, Foley RN, Collins AJ: Calcium, phosphorus, parathyroid hormone, and cardiovascular disease in hemodialysis patients: The USRDS Waves 1, 3, and 4 Study. J Am Soc Nephrol 16: 1788–1793, 2005 [DOI] [PubMed] [Google Scholar]
- 5.London GM, Guerin AP, Marchais SJ, Metivier F, Pannier B, Adda H: Arterial media calcification in end-stage renal diseases: Impact on all-cause and cardiovascular mortality. Nephrol Dial Transplant 18: 1731–1740, 2003 [DOI] [PubMed] [Google Scholar]
- 6.Raggi P, Boulay A, Chasan-Taber S, Amin N, Dillon M, Burke SK, Chertow GM: Cardiac calcification in adult hemodialysis patients: A link between end-stage renal disease and cardiovascular disease? J Am Coll Cardiol 39: 695–701, 2002 [DOI] [PubMed] [Google Scholar]
- 7.Zile MR, Baicu CF, Gaasch WH: Diastolic heart failure: Abnormalities in active relaxation and passive stiffness of the left ventricle. N Engl J Med 350: 1953–1959, 2004 [DOI] [PubMed] [Google Scholar]
- 8.Ohtake T, Kobayashi S, Moriya H, Negishi K, Okamoto K, Maesato K, Saito S: High prevalence of occult coronary artery stenosis in patients with chronic kidney disease at the initiation of renal replacement therapy: An angiographic examination. J Am Soc Nephrol 16: 1141–1148, 2005 [DOI] [PubMed] [Google Scholar]
- 9.Tyson KL, Reynolds JL, McNair R, Zhang Q, Weissberg PL, Shanahan CM: Osteo/chondrocytic transcription factors and their target genes exhibit distinct patterns of expression in human arterial calcification. Arterioscler Thromb Vasc Biol 23: 489–494, 2003 [DOI] [PubMed] [Google Scholar]
- 10.Steitz SA, Speer MY, Curinga G, Yang H-Y, Haynes P, Aebersold R, Schinke T, Karsenty G, Giachelli CM: Smooth muscle cell phenotypic transition associated with calcification. Circ Res 89: 1147–1154, 2001 [DOI] [PubMed] [Google Scholar]
- 11.Jono S, McKee MD, Murry CE, Shioi A, Nishizawa Y, Mori K, Morii H, Giachelli CM: Phosphate regulation of vascular smooth muscle cell calcification. Circ Res 87: e10–e17, 2000 [DOI] [PubMed] [Google Scholar]
- 12.Reynolds JL, Joannides AJ, Skepper JN, McNair R, Schurgers LJ, Proudfoot D, Jahnen-Dechent W, Weissberg PL, Shanahan CM: Human vascular smooth muscle cells undergo vesicle-mediated calcification in response to changes in extracellular calcium and phosphate concentrations: A potential mechanism for accelerated vascular calcification in ESRD. J Am Soc Nephrol 15: 2857–2867, 2004 [DOI] [PubMed] [Google Scholar]
- 13.Trion A, van der Laarse A: Vascular smooth muscle cells and calcification in atherosclerosis. Am Heart J 147: 808–814, 2004 [DOI] [PubMed] [Google Scholar]
- 14.Moe SM, O'Neill KD, Duan D, Ahmed S, Chen NX, Leapman SB, Fineberg N, Kopecky K: Medial artery calcification in ESRD patients is associated with deposition of bone matrix proteins. Kidney Int 61: 638–647, 2002 [DOI] [PubMed] [Google Scholar]
- 15.Boström K, Watson KE, Horn S, Worthman C, Herman IM, Demer LL: Bone morphogenetic protein expression in human atherosclerotic lesions. J Clin Invest 91: 1800–1809, 1993 [DOI] [PMC free article] [PubMed] [Google Scholar]
- 16.Dhore CR, Cleutjens J, Lutgens E, Cleutjens K, Geussens P, Kitslaar P, Tordoir J, Spronk H, Vermeer C, Daemen M: Differential expression of bone matrix regulatory proteins in human atherosclerotic plaques. Arterioscler Thromb Vasc Biol 21: 1998–2003, 2001 [DOI] [PubMed] [Google Scholar]
- 17.Ducy P, Zhang R, Geoffroy V, Ridall AL, Karsenty G: Osf2/Cbfa1: A transcriptional activator of osteoblast differentiation. Cell 89: 747–754, 1997 [DOI] [PubMed] [Google Scholar]
- 18.Moe SM, Duan D, Doehle BP, O'Neill KD, Chen NX: Uremia induces the osteoblast differentiation factor Cbfa1 in human blood vessels. Kidney Int 63: 1003–1011, 2003 [DOI] [PubMed] [Google Scholar]
- 19.Davies MR, Lund RJ, Hruska KA: BMP-7 is an efficacious treatment of vascular calcification in a murine model of atherosclerosis and chronic renal failure. J Am Soc Nephrol 14: 1559–1567, 2003 [DOI] [PubMed] [Google Scholar]
- 20.Davies MR, Lund RJ, Mathew S, Hruska KA: Low turnover osteodystrophy and vascular calcification are amenable to skeletal anabolism in an animal model of chronic kidney disease and the metabolic syndrome. J Am Soc Nephrol 16: 917–928, 2005 [DOI] [PubMed] [Google Scholar]
- 21.Lund RJ, Davies MR, Brown AJ, Hruska KA: Successful treatment of an adynamic bone disorder with bone morphogenetic protein-7 in a renal ablation model. J Am Soc Nephrol 15: 359–369, 2004 [DOI] [PubMed] [Google Scholar]
- 22.Li X, Yang HY, Giachelli CM: Role of the sodium-dependent phosphate cotransporter, Pit-1, in vascular smooth muscle cell calcification. Circ Res 98: 905–912, 2006 [DOI] [PubMed] [Google Scholar]
- 23.Lecanda F, Avioli LV, Cheng SL: Regulation of bone matrix protein expression and induction of differentiation of human osteoblasts and human bone marrow stromal cells by bone morphogenetic protein-2. J Cell Biochem 67: 386–398, 1997 [PubMed] [Google Scholar]
- 24.Nakashima K, Zhou X, Kunkel G, Zhang Z, Deng JM, Behringer RR, De Crombrugghe B: The novel zinc finger-containing transcription factor osterix is required for osteoblast differentiation and bone formation. Cell 108: 17–29, 2002 [DOI] [PubMed] [Google Scholar]
- 25.Lee M-H, Kwon T-G, Park H-S, Wozney JM, Ryoo H-M: BMP-2 induced osterix expression is mediated by Dlx5 but is independent of Runx2. Biochem Biophys Res Commun 309: 689–694, 2003 [DOI] [PubMed] [Google Scholar]
- 26.Towler DA, Bidder M, Latifi T, Coleman T, Semenkovich CF: Diet-induced diabetes activates an osteogenic gene regulatory program in the aortas of low density lipoprotein receptor-deficient mice. J Biol Chem 273: 30427–30434, 1998 [DOI] [PubMed] [Google Scholar]
- 27.Shao JS, Cheng SL, Pingsterhaus JM, Charlton-Kachigian N, Loewy AP, Towler DA: Msx2 promotes cardiovascular calcification by activating paracrine Wnt signals. J Clin Invest 115: 1210–1220, 2005 [DOI] [PMC free article] [PubMed] [Google Scholar]
- 28.Dorai H, Vukicevic S, Sampath TK: Bone morphogenetic protein-7 (osteogenic protein-1) inhibits smooth muscle cell proliferation and stimulates the expression of markers that are characteristic of SMC phenotype in vitro. J Cell Physiol 184: 37–45, 2000 [DOI] [PubMed] [Google Scholar]
- 29.Dorai H, Sampath TK: Bone morphogenetic protein-7 modulates genes that maintain the vascular smooth muscle cell phenotype in culture. J Bone Joint Surg 83: S70–S78, 2001 [PubMed] [Google Scholar]
- 30.Mathew S, Lund R, Strebeck F, Tustison KS, Geurs T, Hruska KA: Reversal of the adynamic bone disorder and decreased vascular calcification in chronic kidney disease by sevelamer carbonate therapy. J Am Soc Nephrol 18: 122–130, 2007 [DOI] [PubMed] [Google Scholar]
- 31.Aubin JE, Liu F: The osteoblast lineage. In: Principles of Bone Biology, edited by Bilezikian JP, Raisz LG, Rodan GA, New York, Academic Press, 1996, pp 51–67
- 32.Hoffmann HM, Catron KM, van Wijnen AJ, McCabe LR, Lian JB, Stein GS, Stein JL: Transcriptional control of the tissue-specific, developmentally regulated osteocalcin gene requires a binding motif for the Msx family of homeodomain proteins. Proc Natl Acad Sci U S A 91: 12887–12891, 1994 [DOI] [PMC free article] [PubMed] [Google Scholar]
- 33.Cheng SL, Shao JS, Charlton-Kachigian N, Loewy AP, Towler DA: Msx2 promotes osteogenesis and suppresses adipogenic differentiation of multipotent mesenchymal progenitors. J Biol Chem 278: 45969–45977, 2003 [DOI] [PubMed] [Google Scholar]
- 34.Erickson, DM, Harris SE, Dean DD, Harris MA, Wozney JM, Boyan BD, Schwartz Z: Recombinant bone morphogenetic protein (BMP)-2 regulates costochondral growth plate chondrocytes and induces expression of BMP-2 and BMP-4 in a cell maturation-dependent manner. J Orthop Res 15: 371–380, 1997 [DOI] [PubMed] [Google Scholar]
- 35.Komori T, Yagi H, Nomura S, Yamaguchi A, Sasaki K, Deguchi K, Shimizu Y, Bronson RT, Gao Y-H, Inada M: Targeted disruption of Cbfa1 results in a complete lack of bone formation owing to maturational arrest of osteoblasts. Cell 89: 755–764, 1997 [DOI] [PubMed] [Google Scholar]
- 36.Li X, Yang H-Y, Giachelli C: BMP-2 promotes phosphate uptake, phenotypic modulation, and calcification of vascular smooth muscle cells. Atherosclerosis 2008, doi: 10.1016/j.atherosclerosis.2007.11.031, in press [DOI] [PMC free article] [PubMed]
- 37.Asahina I, Sampath TK, Hauschka PV: Human osteogenic protein-1 induces chondroblastic, osteoblastic, and/or adipocytic differentiation of clonal murine target cells. Exp Cell Res 222: 38–47, 1996 [DOI] [PubMed] [Google Scholar]
- 38.Piscione TD, Yager TD, Gupta IR, Grinfeld B, Pei Y, Attisano L, Wrana JL, Rosenblum ND: BMP-2 and OP-1 exert direct and opposite effects on renal branching morphogenesis. Am J Physiol 273: F961–F975, 1997 [DOI] [PubMed] [Google Scholar]
- 39.Piscione TD, Phan T, Rosenblum ND: BMP7 controls collecting tubule cell proliferation and apoptosis via Smad1-dependent and -independent pathways. Am J Physiol Renal Physiol 280: F19–F33, 2001 [DOI] [PubMed] [Google Scholar]
- 40.Macias-Silva M, Hoodless PA, Tang SJ, Buchwald M, Wrana JL: Specific activation of Smad1 signaling pathways by the BMP7 type I receptor, ALK2. J Biol Chem 273: 25628–25636, 1998 [DOI] [PubMed] [Google Scholar]
- 41.Ducy P, Karsenty G: Two distinct osteoblast-specific cis acting elements control expression of a mouse osteocalcin gene. Mol Cell Biol 15: 1858–1869, 1995 [DOI] [PMC free article] [PubMed] [Google Scholar]
- 42.Phan O, Ivanovski O, Nguyen-Khoa T, Mothu N, Angulo J, Westenfeld R, Ketteler M, Meert N, Maizel J, Nikolov IG, Vanholder R, Lacour B, Drueke TB, Massy ZA: Sevelamer prevents uremia-enhanced atherosclerosis progression in apolipoprotein E-deficient mice. Circulation 112: 2875–2882, 2005 [DOI] [PubMed] [Google Scholar]
- 43.Tamagaki K, Yuan Q, Ohkawa H, Imazeki I, Moriguchi Y, Imai N, Sasaki S, Takeda K, Fukagawa M: Severe hyperparathyroidism with bone abnormalities and metastatic calcification in rats with adenine-induced uraemia. Nephrol Dial Transplant 21: 651–659, 2006 [DOI] [PubMed] [Google Scholar]
- 44.Surendran K, Schiavi S, Hruska KA: Wnt-dependent-β-catenin signaling is activated after unilateral ureteral obstruction, and recombinant secreted frizzled-related protein 4 alters the progression of renal fibrosis. J Am Soc Nephrol 16: 2373–2384, 2005 [DOI] [PubMed] [Google Scholar]
- 45.Chen NX, Moe SM: Vascular calcification in chronic kidney disease. Semin Nephrol 24: 61–68, 2004 [DOI] [PubMed] [Google Scholar]
- 46.Doherty TM, Uzui H, Fitzpatrick LA, Tripathi PV, Dunstan CR, Asotra K, Rajavashisth TB: Rationale for the role of osteoclast-like cells in arterial calcification. FASEB J 16: 577–582, 2002 [DOI] [PubMed] [Google Scholar]
- 47.Koga T, Matsui Y, Asagiri M, Kodama T, De Crombrugghe B, Nakashima K, Takayanagi H: NFAT and osterix cooperatively regulate bone formation. Nat Med 11: 880–885, 2005 [DOI] [PubMed] [Google Scholar]
- 48.Beck GR Jr, Zerler B, Moran E: Phosphate is a specific signal for induction of osteopontin gene expression. Proc Natl Acad Sci U S A 97: 8352–8357, 2000 [DOI] [PMC free article] [PubMed] [Google Scholar]
- 49.Biber J, Gisler SM, Hernando N, Wagner CA, Murer H: PDZ interactions and proximal tubular phosphate reabsorption. Am J Physiol Renal Physiol 287: 871–875, 2004 [DOI] [PubMed] [Google Scholar]
- 50.Chertow GM, Burke SK, Raggi P: Sevelamer attenuates the progression of coronary and aortic calcification in hemodialysis patients. Kidney Int 62: 245–252, 2002 [DOI] [PubMed] [Google Scholar]
- 51.Block GA, Spiegel DM, Ehrlich J, Mehta R, Lindbergh J, Dreisbach A, Raggi P: Effects of sevelamer and calcium on coronary artery calcification in patients new to hemodialysis. Kidney Int 68: 1815–1824, 2005 [DOI] [PubMed] [Google Scholar]
- 52.Moe SM, Reslerova M, Ketteler M, O'Neill K, Duan D, Koczman J, Westenfeld R, Jahnen-Dechent W, Chen NX: Role of calcification inhibitors in the pathogenesis of vascular calcification in chronic kidney disease (CKD). Kidney Int 67: 2295–2304, 2005 [DOI] [PubMed] [Google Scholar]


