Abstract
We present a comprehensive study that integrates experimental and theoretical nonequilibrium techniques to map energy landscapes along well defined pull-axis specific coordinates to elucidate mechanisms of protein unfolding. Single-molecule force-extension experiments along two different axes of photoactive yellow protein combined with nonequilibrium statistical mechanical analysis and atomistic simulation reveal energetic and mechanistic anisotropy. Steered molecular dynamics simulations and free-energy curves constructed from the experimental results reveal that unfolding along one axis exhibits a transition-state-like feature where six hydrogen bonds break simultaneously with weak interactions observed during further unfolding. The other axis exhibits a constant (unpeaked) force profile indicative of a noncooperative transition, with enthalpic (e.g., H-bond) interactions being broken throughout the unfolding process. Striking qualitative agreement was found between the force-extension curves derived from steered molecular dynamics calculations and the equilibrium free-energy curves obtained by Jarzynski–Hummer–Szabo analysis of the nonequilibrium work data. The anisotropy persists beyond pulling distances of more than twice the initial dimensions of the folded protein, indicating a rich energy landscape to the mechanically fully unfolded state. Our findings challenge the notion that cooperative unfolding is a universal feature in protein stability.
Keywords: nonequilibrium dynamics, photoactive yellow protein, biophysics
A key step toward connecting protein structure, dynamics, and function is the insightful mapping of energy landscapes (1). A proper set of reaction coordinates encodes the progress of a transition through the dynamical bottleneck region and correlates energetics with structure. Significant advances, both experimental and computational, have been made to map energy landscapes and understand protein (un)folding mechanisms (2). Experimental methods such as fluorescence quenching (3), fluorescence resonance energy transfer (4), hydrogen exchange (5), and small-angle x-ray scattering (6) yielded insights into the rates and structures of folding intermediates. A common result emerging from these studies on a range of small water-soluble proteins is that protein unfolding occurs in a cooperative, all-or-none, transition with a single dominant barrier separating the native and unfolded states (7, 8). However, these approaches tend to sample thermodynamically favorable pathways and do not address why other paths are not preferred. For example, a gradual progression of partially unfolded intermediates is usually not detected for these small proteins, possibly because such conformational states are not populated to a measurable extent. Recently, thermal unfolding studies exhibited thermodynamically noncooperative behavior (9, 10). Hence, the molecular basis for the cooperativity of protein folding is a matter of considerable debate (11).
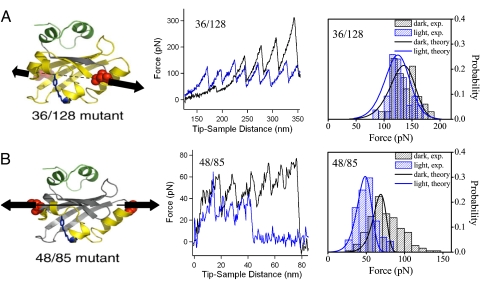
In addition, unfolding (i.e., both chemical and mechanical) is a highly nonequilibrium process where the “standard” near-equilibrium fluctuation-dissipation theorem, based on the Onsager regression hypothesis (12, 13), is of questionable validity. Therefore, both measurements and theory/formalism for interpretation must be properly conceived to yield meaningful results. Here, we address these challenges by (i) designing a set of structural coordinates (14) (Fig. 1A), (ii) measuring protein conformational changes along two distinct protein axes with single-molecule force experiments performed over a range of pulling velocities (15, 16), (iii) mapping the energy landscape onto these well defined structural axes by using kinetic (17–20) and nonequilibrium statistical mechanics analysis of the experimental data (21, 22), and (iv) conducting steered molecular dynamics (SMD) (23) simulations. Together, these techniques allow one to explore projections of the energy landscape from nonequilibrium processes that ultimately allow gaining new insights into why the thermodynamic coordinate is as it is.
Fig. 1.
Axis-dependent protein unfolding. The Cys-directed multimerization of the 36/128 and 48/85 mutants of PYP together with the single-molecule pulling experiments at 1 μm/s pulling speed were described in detail in ref. 14. In brief, we designed the Cys handles at 36/128 and 48/85 to probe structural changes of the whole PAS domain of PYP and a small region of the PAS domain surrounding the chromophore, respectively. The protein region (in yellow) between the two Cys mutations (in red) is stretched in the AFM experiments and SMD simulations. (Left) The two axes defined by the residue pairs 36/128 (A) and 48/85 (B) are indicated by dashed lines. The pCA chromophore of PYP is indicated in blue. (Center) Representative AFM force vs. distance curves (pulling rate, 5 μm/s) for the unfolding of single polyPYP molecules along the 36/128 axis (A) and the 48/85 axis (B) in the dark (in black) and during continuous blue-light illumination (in blue). (Right) Unfolding force distributions from experiment (hatchmark-filled bars) and microscopic model (curved lines): 36/128 axis (A) and 48/85 axis (B) in the dark (in black) and during continuous blue-light illumination (in blue).
Protein resistance to mechanical unfolding has been shown to depend on pulling geometry (14–16, 24–26). Anisotropy in the unfolding force, the distance to the transition state and the force-free unfolding rates have now been reported for four different proteins (14, 15, 24, 25). These results reflect the specific secondary structural elements included in the pulling coordinate(s). For example, force-induced unfolding of GFP involves a partially unfolded intermediate along certain axes (24). In the present article, we provide thermodynamic and mechanistic descriptions of the anisotropy. We find highly anisotropic free-energy curves along two protein axes: the protein undergoes a cooperative unfolding transition along one axis and a noncooperative unfolding process along the other. Furthermore, our analysis allows insight into the entropic and enthalpic contributions to unfolding. The corroborative findings from this comprehensive combination of experimental, simulation, and statistical mechanical methods that we employ allow quantitative mapping of the axis-based energy landscape for protein stability and function.
Background on the Photoactive Yellow Protein System
Photoactive yellow protein (PYP) (27, 28), in both its ground and photoexcited states, is examined as a test case. PYP from the halophilic photosynthetic bacterium Halorhodopsira halophila is a blue light receptor involved in negative phototaxis (29). It is a prototype PAS domain, a ubiquitous protein module with a common three-dimensional fold that serves in a wide range of regulatory and sensory functions in all domains of life (30, 31). The isolated protein displays photochemical activity based on the photoisomerization (32) of its p-coumaric acid (pCA) chromophore (33, 34). Time-resolved visible (35, 36) and FTIR (37) spectroscopic studies have revealed a series of intermediates in the PYP photocycle (38). The two states of PYP that are relevant to the work presented here are the initial dark state of PYP (pG) and the longest-lived intermediate (pB), which forms in 1 ms and thermally decays to the pG state on a second time scale.
The structure of the stable ground state of PYP (pG state, see Fig. 1A) has been investigated by x-ray crystallography (39) and multinuclear NMR spectroscopy (40). The structure of PYP without the first 25 residues (termed Δ25PYP) in the pB state has recently been investigated by NMR experiments (41) and parallel tempering molecular dynamics (MD) simulations (42). This structure is consistent with spectroscopic studies [FTIR (32), NMR (35, 43, 44), H/D exchange (37, 45), fluorescence (46), and circular dichroism (40)] of the pB state in aqueous solution. That is, PYP partially unfolds its PAS domain during the photocycle, and this may be a key process in its signaling function (47).
Results and Discussion
Experimental Results and Kinetic Analysis.
Two different Cys-linked multimers of PYP (polyPYP) were constructed (14) with Cys mutations at residues 36/128 and residues 48/85 (see Materials and Methods). When a polyPYP chain is stretched at the two ends (e.g., residues 48/85), the force is distributed across the region between the two Cys mutations within each PYP monomer (the sequence between the mutated residues is yellow in Fig. 1). Thus, these single-molecule force experiments are expected to be sensitive to the local structural changes primarily within the selected regions. Fig. 1 shows representative experimental force-extension curves (and the resulting histograms) for 36/128 and 48/85 polyPYP without and with illumination; that is, pG and pB states, respectively. The unfolding forces for unilluminated (i.e., dark) PYP along the 36/128 and 48/85 axes are distinctly different; the average values of the distributions are 137 pN and 77 pN, respectively. The anisotropy in ΔF implies that interactions and unfolding pathways in the two regions defined by these two Cys pairs (or pulling axes) are not identical. Photoexcitation of PYP decreases the average unfolding force along both axes by ≈30%; this is qualitatively consistent with destabilization of the light-activated pB state (48) caused by its partial unfolding (14).
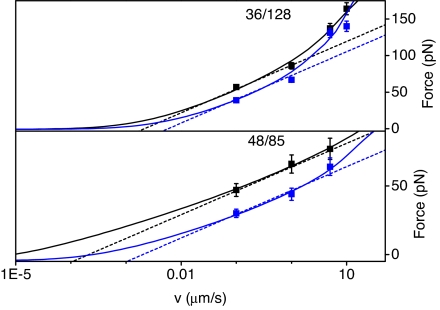
Since unfolding forces depend on pulling rate, we obtain further information on the energy landscape for the unfolding process from experiments at 0.65, 6.6, 30.0, and 110 nN/s loading rates for 36/128 polyPYP and 0.86, 6.4, and 37 nN/s loading rates for 48/85 polyPYP. Fig. 2 shows the average experimental rupture force as a function of pulling velocity for 36/128 and 48/85 polyPYP in the dark and under illumination together with fitted curves; straight lines are from a Bell's (49) model analysis and the curves are from a microscopic model based on Kramer's theory [supporting information (SI) Text, Eqs. 6 and 7] (17). We show both results since extracting quantitative kinetic information from single-molecule experiments is a matter of debate (50). Nevertheless, the fitting parameters obtained show that the trends from these models are in qualitative agreement (see SI Table 1). The parameters show that the distance to the barrier is significantly smaller for the 36/128 axis than for the 48/85 axis, whereas the force-free unfolding rate is larger for 36/128 than for 48/85. Conversion of PYP to its pB state by laser illumination has little effect on the distance to the transition state, whereas the force-free unfolding rates increase along both axes. This increase is consistent with the idea of light-induced partial unfolding of PYP (48). Thus, the parameters for the two one-dimensional coordinates reveal anisotropy in the distance-to-the-barrier and the unfolding rates.
Fig. 2.
Average force at rupture as a function of pulling velocity from experiment (filled boxes) and theory (dashed lines, Bell's model; solid lines, microscopic model): 36/128 (Upper) and 48/85 (Lower) axes, in the dark (in black) and during continuous blue-light illumination (in blue).
Free-Energy Landscape Projections.
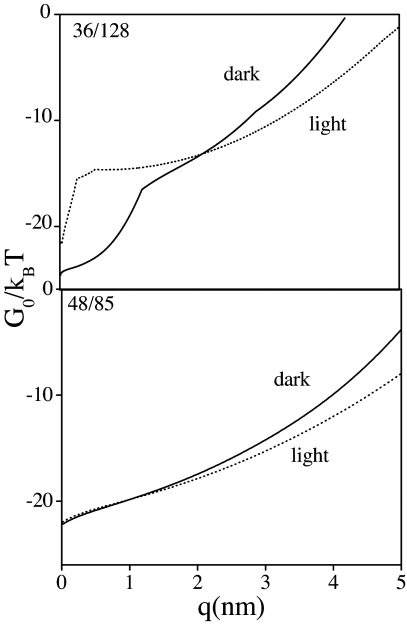
A modified version (19, 20) of Jarzynski's nonequilibrium work relation (21) was used to extract free-energy curves from the experimental force-extension curves (22) (Fig. 3; for details, see Materials and Methods and SI Text). The resulting free-energy curve for the 48/85 coordinate is monotonically rising and nearly featureless, that is, no obvious barriers. In contrast, the 36/128 coordinate shows a free-energy barrier at short extensions, a steep rise to the discontinuity (or transition state), and a gradual rise afterward for both dark- and light-activated PYP. The anisotropic character of the free-energy curves along these axes is clear; the findings suggest a large variation in the ensemble of conformations that are thermodynamically accessible during unfolding along different pulling axes. These conclusions are independent of parameters (see SI Text).
Fig. 3.
Free-energy curves divided by kBT vs. molecular coordinate q: 36/128 (Upper) and 48/85 (Lower) axes. Obtained from JHS analysis. The black curves correspond to PYP in the dark state, and the dotted curves represent the photoactivated protein. q begins at the equilibrium distance. I.e., q = 0 implies 2.7- or 3.2-nm distance. Three hundred seventy experimental curves were used in the analysis.
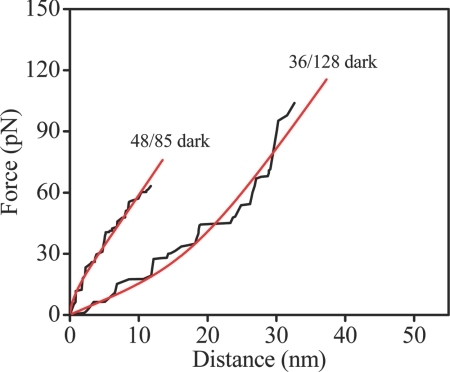
The curves shown in Fig. 3 are obtained from a fit to the experimental data by using an extensible version of the freely jointed chain model (mFJC) (51). Our atomic force microscopy (AFM) experiments probe the regime where the end-to-end distance approaches the contour length of the protein sequence defined by the attachment points. In this regime the elastic response may be affected by energetic contributions besides reduction of conformational entropy; that is, both entropy and enthalpy contribute to the free energy. Various models have been used to describe this so-called high-force regime (51, 52). The mFJC is a simple model of polymer physics that captures the entropic and enthalpic aspects of polymer behavior. The model involves an entropic term for the alignment of statistically independent Kuhn segments of length b and an enthalpic term to account for the stretching of a segment under the external force with stretch modulus S. Thus, analysis using this model allows establishing the relative importance of the enthalpic and entropic contributions to the force-extension response (and hence the free energy). The mFJC model well fit the experimental force-extension curves for 36/128 PYP with relatively large values for b and S, associated with the upward curvature of the data (see Fig. 4 and SI Text), indicating that the response is largely entropic. In contrast, relatively small values for b and S were found for the 48/85 axis, giving linear (or even negative curvature) force-extension curves, suggesting that unfolding along the 48/85 axis is caused by enthalpic as well as entropic elastic responses. The collection of pulling curves along these two axes generally exhibited these contrasting behaviors (see SI Text).
Fig. 4.
Representative mFJC curves (red) fitted to the experimental force-extension curves (black) along the 48/85 and 36/128 axes in the absence of illumination (pulling rate, 5 μm/s). Distance refers to the separation between fixed and pulled residues.
Structural Insights from SMD Simulations.
Insights into the structural changes that occur in PYP during these force-extension experiments are obtained from SMD simulations on PYP monomers. In our simulations, the distance between two residues corresponding to those used in the experiments was gradually increased by the application of an external force at constant velocity (see Materials and Methods and SI Text). Because the simulation time is several orders of magnitude too short to achieve all protein structural changes associated with spontaneous pB formation (23) and 6 orders of magnitude faster than the pulling rate in the AFM experiments, one does not obtain quantitative energetic (force) information. However, it has been shown that SMD simulations are capable of capturing the pattern of disrupted interactions during mechanical unfolding (23).
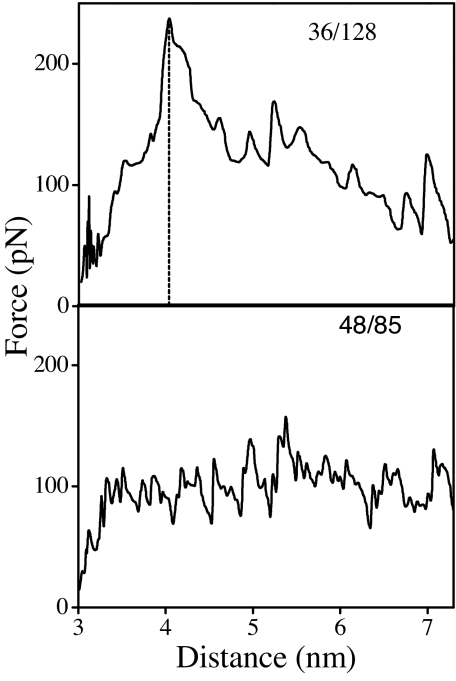
The simulations reveal very different unfolding pathways for the two pulling axes. The simulated force-extension response along 36/128 exhibits a force peak, whereas the simulated force-extension response along 48/85 exhibits a force plateau (Fig. 5). Thus, there is a remarkable qualitative agreement between the derivative of the experimental free energy and simulated force-extension curves. The barrier position and forces change with pulling rate as expected (i.e., in qualitative agreement with Fig. 2 and SI Table 1).
Fig. 5.
SMD force vs. distance curves (pulling rate, 0.1 Å/ps) for the unfolding of single PYP molecules in the pG state along the 36/128 axis (Upper) and 48/85 axis (Lower). Distance refers to the separation between fixed and pulled residues. Simulation time is 1 ns. Equilibrium separations are 2.7 nm (36/128) and 3.2 nm (48/85).
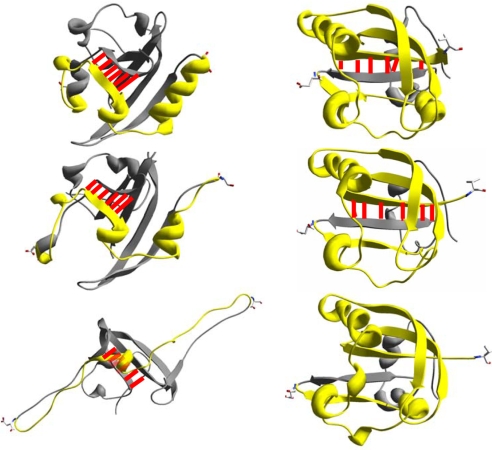
Analysis of the molecular structures obtained from the simulations reveals that the protein's resistance to unfolding under external force applied along the 36/128 axis is caused by inter-β-strand hydrogen bond breaking. Fig. 6 shows that the overall structure of PYP remains essentially intact as residues 36 and 125 extend, whereas the hydrogen bonds between β-strands 1 and 6 experience increasing amounts of strain up to an extension of ≈1.2 nm. At ≈1.2 nm the simulations reveal an abrupt structural change; all 6 hydrogen bonds between β-strands 1 and 6 are disrupted with a concomitant sliding of these two strands. This rupture coincides with the peak of the unfolding force shown in Fig. 5. Once these hydrogen bonds are broken, the protein unfolds; the subsequent unfolding is relatively smooth. This unfolding mechanism is an all-or-none (cooperative) process. However, a gradual loss of structure in various regions of PYP is observed as it is pulled along the 48/85 axis; interestingly, the hydrogen bonds between β-strands 1 and 6 remain intact up to an extension of at least 5 nm.
Fig. 6.
Snapshots of the in silico forced extension of single PYP molecules along different axes. (Right) 36/128 axis. Pull distances, from top to bottom, are 0, 0.6, and 1.2 nm. The red lines represent hydrogen bonds between β-strands 1 and 6. (Left) 48/85 axis. Pull distances, from top to bottom, are 0, 1.2, and 4.6 nm. The pullling rate is 0.1 Å/ps; the simulation time is 1 ns.
Further analysis of the SMD results (see SI Text) is in agreement with these structural observations. For the 36/128 axis, the number of intramolecular hydrogen bonds is nearly constant during the initial stage of pulling and decreases abruptly around the transition state region, where the force peaks (14). However, pulling along the 48/85 axis results in a continuous disruption of hydrogen bonds throughout the simulation. Similarly, the protein backbone rms deviation increases smoothly when PYP is pulled along the 48/85 axis, whereas a sharp increase is observed for the 36/128 axis near the transition region. Thus, these simulations provide structural insights into two very different mechanical unfolding pathways of pG.
To examine the structural changes that occur during the force-induced unfolding of the pB state, SMD simulations were performed by using the NMR structures of the pG and pB states of Δ25PYP (41). The trends observed in the SMD simulations of the pB state of Δ25PYP are similar to simulations of the pG state (see SI Text): a transition-state-like feature is observed along the 36/128 axis, whereas a continuous disruption of native contacts occurs along the 48/85 coordinate. The peak force is smaller and occurs at a shorter extension for the pB state. The smaller unfolding forces and reduced cooperativity (and shortened distance to the transition state) for the pB simulation can be explained by the already partially disrupted network of native fold interactions characteristic of the pB state and the finite force sensitivity (i.e., noise limit) of the AFM-based measurement.
Integrating AFM Experiments, Kinetic Analysis, SMD Simulations, and Experimental Free-Energy Curves
Developing a fundamental understanding of protein unfolding requires obtaining detailed kinetic, thermodynamic, and structural information for relevant and well defined reaction coordinates. We address this challenge by using the integrated and synergistic approach described above. First, Cys-directed multimerization (14, 24, 53, 54) allows the experimental selection of well defined unfolding coordinates (i.e., the distance between two amino acid residues). Pulling-rate-dependent measurements provide kinetic information. Jarzynski–Hummer–Szabo (JHS) analysis of the experimental data allows construction of the free-energy curves (i.e., potential of mean force) along these coordinates. SMD simulations yield detailed information on the interactions that are disrupted during pulling along the reaction coordinate. Note that the force-extension behavior obtained from SMD is to be compared with the derivative of the free energy (i.e., potential) obtained from analysis of the experiments. The consistency of this comparison is a clear validation of the approach used here. Finally, application of the mFJC model reveals the role of entropic and enthalpic elasticities in unfolding; enthalpic information (e.g., bond rupture) is also directly deduced from SMD simulations, while the entropic component is inferred from the mFJC fit to the data and from a comparison between experimental and SMD force-extension curves.
The striking anisotropy was detected in several properties of unfolding along the two pulling axes: (i) The unfolding force, ΔF, differs by nearly 2-fold. (ii) In both experiment and simulation, the pulling axes show qualitatively different force-extension curves: there is a force peak along the 36/128 axis and a force plateau for 48/85. (iii) The elastic response for the 36/128 axis data are purely entropic, whereas the 48/85 axis is a combination of both entropic and enthalpic elastic responses. (iv) A relatively small change in the distance between residues 36 and 128 leads to a sharp order–disorder transformation that is typical of cooperative unfolding transitions (11). Other coordinates, as exemplified by the 48/85 axis, allow partially unfolded intermediates separated by low-energy barriers to be sampled throughout a noncooperative unfolding process, as reflected in the progression of loss of structure, rms deviation, and number of hydrogen bonds during the pulling in SMD simulations. Analysis of the SMD simulations provides the structural insight to the transition state along the 36/128 axis: the sliding of β-strands 1 and 6 and disruption of all 6 hydrogen bonds between these strands. (v) The equilibrium (i.e., in the absence of mechanical pulling) free-energy curves obtained from the JHS analysis of the experimental data show that the free-energy landscape is anisotropic. The free-energy curve for the 36/128 axis shows a discontinuity at the transition state, whereas a featureless but monotonically rising free-energy curve is observed for the 48/85 axis. (vi) The unfolding rates extrapolated to zero external force differ significantly (i.e., >1,000-fold). In the limit of sufficiently high friction, relevant to the unfolding of a complex macromolecule, the rate of a Kramers process is proportional to the curvature of the energy surface at the transition state. Indeed, we observe that unfolding is faster along the 36/128 coordinate, which has a sharper energy barrier, even though it is higher. In contrast, slow unfolding along the 48/85 coordinate is along an essentially featureless (within the sensitivity of our measurement) but very broad free-energy curve (Fig. 3); the SMD simulations indicate that the unfolding path proceeds through “intermediates” separated by relatively small barriers. The present AFM measurement is only sensitive to the resultant very wide effective barrier, which can result in a smaller unfolding rate constant as observed here (55). (vii) The anisotropic nature of the unfolding process persists up to large extensions as seen in Figs. 3 and 6.
Conclusions for Anisotropy of Unfolding
New mechanistic and functional insights can be obtained from the response of the protein as it is driven away from the thermodynamic equilibrium state. In the context of a more general discussion of folding energy landscapes, anisotropic behavior may be important for understanding unfolding that occurs during protein degradation and protein translocation across membranes. In vivo studies of protein unfolding have shown that the resistance of a protein to unfolding is not determined by its stability against global unfolding, as measured by temperature- or denaturant-induced unfolding in vitro. Instead, resistance to unfolding is determined by the local structure that proteases and translocases encounter first as they catalyze the extension of polypeptide chains (56). Therefore, the combination of mechanical unfolding studies that probe the local unfolding of selected regions of a protein along a selected direction with JHS analysis of the experimental data are suited to study the connection between anisotropy in the energy landscape and protein unfolding in vivo.
We propose that in the absence of an external force the noncooperative coordinate does not have an energy barrier to “trap” the protein in an intermediate along this coordinate. The protein may undergo thermal (structural) diffusion along this coordinate, but this diffusive process will strongly favor returning the system to the native state. In contrast, a similar diffusive process along the 36/128 axis can result in the crossing of the predominant energy barrier. This barrier will then prevent the rapid diffusion of some proteins in the ensemble back to the initial state, allowing an all-or-nothing transition. Thus, the difference in unfolding mechanisms along two different unfolding axes reported here is a particular example of cooperativity; diffusive unfolding along noncooperative axes can proceed much more slowly than diffusion over the single barrier encountered for cooperative unfolding axes.
Finally, in addition to mechanical, kinetic, and structural information on axis-dependent anisotropy in protein unfolding, we have now provided further thermodynamic insights into the anisotropy of the energy landscape by deriving equilibrium free-energy curves from the application of the JHS relation to our experimental data. Moreover, we have shown that PYP can unfold by either a cooperative or noncooperative mechanism, depending on the pulling axis. Further studies are required to explore the full anisotropy of the energy landscape.
Materials and Methods
Experimental Results and Kinetic Analysis.
The dynamic single-molecule force measurements were performed as described in ref. 14 at several loading rates. See SI Text for details.
SMD Simulations.
SMD simulations of pG-PYP were performed as described in ref. 14 with a 0.1 Å/ps pulling rate and 1-ns simulation time. Simulations of Δ25PYP for both pG and pB states were performed by using a continuum model for the solvent (23). The simulations included a 1-ns equilibration period before the SMD run.
Free-Energy Landscape Projections.
The free-energy curves as a function of molecular coordinates, q, can be expressed as (19, 20):
where kB is Boltzmann's constant, T is temperature, q̄t and σt are the weighted mean and variance of the molecular position q, respectively; V(q, t) is the harmonic spring potential of the pulling apparatus; Wt is the total work.
Supplementary Material
ACKNOWLEDGMENTS.
We thank Haeshin Lee for technical support, Profs. Angel Garcia, Harden McConnell, Tobin Sosnick for discussions, and Prof. Aaron Dinner for comments on the manuscript. This work was supported by National Science Foundation Materials Research Science and Engineering Center program (DMR 0213745) and Coordenação de Aperfeiçoamento de Pessoal de Nível Superior/Brazil (N.F.S. and R.A.N.), by National Institutes of Health (NIH) Training Grant GM008720 and Burroughs Wellcome Fund Interfaces Grant 1001774 (to J.M.Z. and N.F.S.), by NIH Grant GM63805 (to W.D.H.), and by a University of Chicago Institute for Biophysical Dynamics Seed Grant and a John S. Guggenheim Foundation fellowship (N.F.S.).
Footnotes
The authors declare no conflict of interest.
This article is a PNAS Direct Submission.
This article contains supporting information online at www.pnas.org/cgi/content/full/0701281105/DC1.
References
- 1.Onuchic JN, Luthey-Schulten L, Wolynes PG. Annu Rev Phys Chem. 1997;48:545–600. doi: 10.1146/annurev.physchem.48.1.545. [DOI] [PubMed] [Google Scholar]
- 2.Shakhnovich E. Chem Rev. 2006;106:1559–1588. doi: 10.1021/cr040425u. [DOI] [PMC free article] [PubMed] [Google Scholar]
- 3.Ervin J, Sabelko J, Gruebele M. J Photochem Photobiol Biol. 2000;54:1–15. doi: 10.1016/s1011-1344(00)00002-6. [DOI] [PubMed] [Google Scholar]
- 4.Tuschl T, Gohlke C, Jovin TM, Westhof E, Eckstein F. Science. 1994;266:785–789. doi: 10.1126/science.7973630. [DOI] [PubMed] [Google Scholar]
- 5.Bai Y, Sosnick TR, Mayne L, Englander SW. Science. 1995;269:192–197. doi: 10.1126/science.7618079. [DOI] [PMC free article] [PubMed] [Google Scholar]
- 6.Sosnick TR, Trewhella J. Biochemistry. 1992;31:8329–8335. doi: 10.1021/bi00150a029. [DOI] [PubMed] [Google Scholar]
- 7.Plaxco KW, Simons KT, Baker D. J Mol Biol. 1998;277:985–994. doi: 10.1006/jmbi.1998.1645. [DOI] [PubMed] [Google Scholar]
- 8.Zwanzig RW. Proc Natl Acad Sci USA. 1995;92:9801–9804. doi: 10.1073/pnas.92.21.9801. [DOI] [PMC free article] [PubMed] [Google Scholar]
- 9.Garcia-Mira MM, Sadqi M, Fischer N, Sanchez-Ruiz JM, Muñoz V. Science. 2002;298:2191–2195. doi: 10.1126/science.1077809. [DOI] [PubMed] [Google Scholar]
- 10.Sadqi M, Fushman D, Muñoz V. Nature. 2006;442:317–321. doi: 10.1038/nature04859. [DOI] [PubMed] [Google Scholar]
- 11.Chan HS, Shimizu S, Kaya H. Methods Enzymol. 2004;380:350–379. doi: 10.1016/S0076-6879(04)80016-8. [DOI] [PubMed] [Google Scholar]
- 12.Callen HB. Thermodynamics and an Introduction to Thermostatistics. New York: Wiley; 1985. [Google Scholar]
- 13.Onsager L. Phys Rev. 1931;37:405–426. [Google Scholar]
- 14.Zhao JM, Lee H, Nome RA, Majid S, Scherer NF, Hoff WD. Proc Natl Acad Sci USA. 2006;103:11561–11566. doi: 10.1073/pnas.0601567103. [DOI] [PMC free article] [PubMed] [Google Scholar]
- 15.Carrion-Vazquez M, Li H, Lu H., Marszalek PE, Oberhauser AF, Fernandez JM. Nat Struct Biol. 2003;10:738–743. doi: 10.1038/nsb965. [DOI] [PubMed] [Google Scholar]
- 16.Fernandez JM, Li HB. Science. 2004;303(5664):1674–1678. doi: 10.1126/science.1092497. [DOI] [PubMed] [Google Scholar]
- 17.Hummer G, Szabo A. Biophys J. 2003;85:5–15. doi: 10.1016/S0006-3495(03)74449-X. [DOI] [PMC free article] [PubMed] [Google Scholar]
- 18.Schlierf M, Rief M. Biophys J. 2006;90:L33–L35. doi: 10.1529/biophysj.105.077982. [DOI] [PMC free article] [PubMed] [Google Scholar]
- 19.Hummer G, Szabo A. Proc Natl Acad Sci USA. 2001;98:3658–366. doi: 10.1073/pnas.071034098. [DOI] [PMC free article] [PubMed] [Google Scholar]
- 20.Hummer G, Szabo A. Acc Chem Res. 2005;38:504–513. doi: 10.1021/ar040148d. [DOI] [PubMed] [Google Scholar]
- 21.Jarzynski C. Phys Rev Lett. 1997;78:2690–2693. [Google Scholar]
- 22.Liphardt J, Dumont S, Smith SB, Tinoco I, Jr, Bustamante C. Science. 2002;296:1832–1837. doi: 10.1126/science.1071152. [DOI] [PubMed] [Google Scholar]
- 23.Izrailev S, Stepaniants S, Isralewitz B, Kosztin D, Lu H, Molnar F, Wriggers W, Schulten K. In: Computational Molecular Dynamics: Challenges, Methods, Ideas, Lecture Notes in Computational Science and Engineering. Deufhard P, Hermans J, Leimkuhler B, Mark AE, Reich S, Skeel RD, editors. Berlin: Springer; 1998. pp. 39–65. [Google Scholar]
- 24.Dietz H, Berkeneier F, Bertz M, Rief M. Proc Natl Acad Sci USA. 2006;103:12724–12728. doi: 10.1073/pnas.0602995103. [DOI] [PMC free article] [PubMed] [Google Scholar]
- 25.Brockwell DJ, Paci E, Zinober RC, Beddard GS, Olmsted PD, Alastair Smith D, Perham RN, Radford SE. Nat Struct Biol. 2003;10:731–737. doi: 10.1038/nsb968. [DOI] [PubMed] [Google Scholar]
- 26.Sharma D, Perisic O, Peng Q, Cao Y, Lam C, Lu H, Li H. Proc Natl Acad Sci USA. 2007;104:9278–9283. doi: 10.1073/pnas.0700351104. [DOI] [PMC free article] [PubMed] [Google Scholar]
- 27.Hellingwerf KJ, Hendriks J, Gensch T. J Phys Chem A. 2003;107:1082–1094. [Google Scholar]
- 28.Cusanovich MA, Meyer TE. Biochemistry. 2003;42:4759–4770. doi: 10.1021/bi020690e. [DOI] [PubMed] [Google Scholar]
- 29.Sprenger WW, Hoff WD, Armitage JP, Hellingwerf KJ. J Bacteriol. 1993;175:3096–3104. doi: 10.1128/jb.175.10.3096-3104.1993. [DOI] [PMC free article] [PubMed] [Google Scholar]
- 30.Taylor BL, Zhulin IB. Microbiol Mol Biol Rev. 1999;63:479–506. doi: 10.1128/mmbr.63.2.479-506.1999. [DOI] [PMC free article] [PubMed] [Google Scholar]
- 31.Pellequer J.-L., Wager-Smith KA, Kay SA, Getzoff ED. Proc Natl Acad Sci USA. 1998;95:5884–5890. doi: 10.1073/pnas.95.11.5884. [DOI] [PMC free article] [PubMed] [Google Scholar]
- 32.Kort R, Vonk H, Xu X, Hoff WD, Crielaard W, Hellingwerf KJ. FEBS Lett. 1996;382:73–78. doi: 10.1016/0014-5793(96)00149-4. [DOI] [PubMed] [Google Scholar]
- 33.Hoff WD, Düx P, Hård K, Devreese B, Nugteren-Roodzant IM, Crielaard W, Boelens R, Kaptein R, Van Beeumen J, Hellingwerf KJ. Biochemistry. 1994;33:13959–13962. doi: 10.1021/bi00251a001. [DOI] [PubMed] [Google Scholar]
- 34.Baca M, Borgstahl GEO, Boissinot M, Burke PM, Williams DR, Slater KA, Getzoff ED. Biochemistry. 1994;33:14369–14377. doi: 10.1021/bi00252a001. [DOI] [PubMed] [Google Scholar]
- 35.Hoff WD, Van Stokkum IHM, Van Ramesdonk HJ, Van Brederode ME, Brouwer AM, Fitch JC, Meyer TE, Van Grondelle R, Hellingwerff KJ. Biophys J. 1994;67:1691–1705. doi: 10.1016/S0006-3495(94)80643-5. [DOI] [PMC free article] [PubMed] [Google Scholar]
- 36.Ujj L, Devanathan S, Meyer TE, Cusanovich MA, Tollin G, Atkinson GH. Biochem J. 1998;75:406–412. doi: 10.1016/S0006-3495(98)77525-3. [DOI] [PMC free article] [PubMed] [Google Scholar]
- 37.Xie A, Kelemen L, Hendriks J, White BJ, Hellingwerf K, Hoff WD. Biochemistry. 2001;40:1510–1517. doi: 10.1021/bi002449a. [DOI] [PubMed] [Google Scholar]
- 38.Meyer TE, Yakali E, Cusanovich MA, Tollin G. Biochemistry. 1987;26:418–423. doi: 10.1021/bi00376a012. [DOI] [PubMed] [Google Scholar]
- 39.Borgstahl GE, Williams DR, Getzoff ED. Biochemistry. 1995;34:6278–6287. doi: 10.1021/bi00019a004. [DOI] [PubMed] [Google Scholar]
- 40.Dux P, Rubinstein G, Vuister GW, Boelens R, Mulder FA, Hard K, Hoff WD, Kroon AR, Criellaard W, Hellingwerf KJ, Kaptein R. Biochemistry. 1998;37:12689–12699. doi: 10.1021/bi9806652. [DOI] [PubMed] [Google Scholar]
- 41.Bernard C, Houben K, Derix NM, Marks D, van der Horst MA, Hellingwerf KJ, Boelens R, Kaptein R, van Nuland NAJ. Structure (London) 2005;13:953–962. doi: 10.1016/j.str.2005.04.017. [DOI] [PubMed] [Google Scholar]
- 42.Vreede J, Crielaard W, Klaas J, Hellingwerf KJ, Bolhuis PG. Biophys J. 2005;88:3525–3535. doi: 10.1529/biophysj.104.055103. [DOI] [PMC free article] [PubMed] [Google Scholar]
- 43.Craven CJ, Derix NM, Hendriks J, Boelens R, Hellingwerf KJ, Kaptein R. Biochemistry. 2000;39:14392–14399. doi: 10.1021/bi001628p. [DOI] [PubMed] [Google Scholar]
- 44.Derix NM, Wechselberger RW, van der Horst MA, Hellingwerf KJ, Boelens R, Kaptein R, van Nuland NAJ. Biochemistry. 2003;42:14501–14506. doi: 10.1021/bi034877x. [DOI] [PubMed] [Google Scholar]
- 45.Hoff WD, Xie A, Van Stokkum IH, Tang XJ, Gural J, Kroon AR, Hellingwerf KJ. Biochemistry. 1999;38:1009–1017. doi: 10.1021/bi980504y. [DOI] [PubMed] [Google Scholar]
- 46.Lee B-C, Croonquist PA, Sosnick TR, Hoff WD. J Biol Chem. 2001;276:20821–20823. doi: 10.1074/jbc.C100106200. [DOI] [PubMed] [Google Scholar]
- 47.Lee BC, Pandit A, Croonquist PA, Hoff WD. Proc Natl Acad Sci USA. 2001;98(16):9062–9067. doi: 10.1073/pnas.111153598. [DOI] [PMC free article] [PubMed] [Google Scholar]
- 48.Ohishi S, Shimizu N, Mihara K, Imamoto Y, Kataoka M. Biochemistry. 2001;40:2854–2859. doi: 10.1021/bi001846i. [DOI] [PubMed] [Google Scholar]
- 49.Bell GI. Science. 1978;200:618–627. doi: 10.1126/science.347575. [DOI] [PubMed] [Google Scholar]
- 50.Dudko OK, Hummer G, Szabo A. Phys Rev Lett. 2006;96:10801. doi: 10.1103/PhysRevLett.96.108101. [DOI] [PubMed] [Google Scholar]
- 51.Smith SB, Cui Y, Bustamante C. Science. 1996;271:795–799. doi: 10.1126/science.271.5250.795. [DOI] [PubMed] [Google Scholar]
- 52.Marszalek PE, Oberhauser AF, Pang Y-P, Fernandez JM. Nature. 1998;396:661–664. doi: 10.1038/25322. [DOI] [PubMed] [Google Scholar]
- 53.Yang GL, Cecconi C, Baase WA, Vetter IR, Breyer WA, Haack JA, Matthews BW, Dahlquist FW, Bustamante C. Proc Natl Acad Sci USA. 2000;97:139–144. doi: 10.1073/pnas.97.1.139. [DOI] [PMC free article] [PubMed] [Google Scholar]
- 54.Dietz H, Rief M. Proc Natl Acad Sci USA. 2006;103:1244–1247. doi: 10.1073/pnas.0509217103. [DOI] [PMC free article] [PubMed] [Google Scholar]
- 55.Plotkin SS, Onuchic JN. Q Rev Biophys. 2002;35:111–167. doi: 10.1017/s0033583502003761. [DOI] [PubMed] [Google Scholar]
- 56.Prakash S, Matouschek A. Trends Biochem Sci. 2004;29:593–600. doi: 10.1016/j.tibs.2004.09.011. [DOI] [PubMed] [Google Scholar]
Associated Data
This section collects any data citations, data availability statements, or supplementary materials included in this article.


