

Abstract
Recently the definition of the metazoan RNA polymerase II and archaeal core promoters has been expanded to include a region immediately upstream of the TATA box called the B recognition element (BRE), so named because eukaryal transcription factor TFIIB and its archaeal orthologue TFB interact with the element in a sequence-specific manner. Here we present the 2.4-Å crystal structure of archaeal TBP and the C-terminal core of TFB (TFBc) in a complex with an extended TATA-box-containing promoter that provides a detailed picture of the stereospecific interactions between the BRE and a helix–turn–helix motif in the C-terminal cyclin repeat of TFBc. This interaction is important in determining the level of basal transcription and explicitly defines the direction of transcription.
The archaeal transcription preinitiation complex represents a simplified homologue of its eukaryal type II counterpart, requiring only a highly homologous RNA polymerase II (pol II), a typical TATA-box-binding protein (TBP), and transcription factor B (TFB), the homologue of the eukaryal TFIIB (1, 2). Most eukaryal pol II and archaeal transcription preinitiation complexes assemble around an eight-base-pair core element found in nearly all promoters: the TATA box (3–5). The first step in both cases is the binding of TBP to the eight-base-pair TATA box. Crystal structures of both eukaryal and archaeal TBP bound to short TATA-box-containing promoter fragments revealed a highly distorted promoter in which the TATA box was partially unwound and bent about 75–80° toward the major groove, but flanked by normal B-DNA (6, 7). This architectural distortion of the TATA element allows further transcription factors to bind either through stepwise addition or through recruitment of a holoenzyme (8). All crystal structures of eukaryal TBP/TATA-box complexes reported to date, including ternary complexes with TFIIA or TFIIB, showed TBP bound in the same orientation relative to the start site of transcription, that is with the C-terminal stirrup of TBP upstream of the TATA box (6, 7, 9–12). However, given the nearly perfect symmetry of the TBP/TATA-box interface, it remained unknown what would specify TBP’s orientation relative to the transcription start site and thus determine the polarity of transcription (13). Early experiments indicated that changing the direction of the TATA box alone did not alter the direction of transcription (14, 15). Affinity cleavage experiments have directly confirmed that yeast TBP by itself binds to the TATA box in either orientation, with only a 60:40 preference for the direction seen in the crystal structures (16). Thus, additional factors are required to enforce the unidirectionality of transcription. Parallel studies, one focusing on the eukaryal pol II promoter (17) and the other on an archaeal promoter (18), implicated a consensus sequence element of at least six or seven base pairs contiguous with the upstream end of the TATA box as a binding site for TFB and TFIIB, respectively; the B recognition element, or BRE. Bell et al. (19) have shown that the TFB/BRE interaction is the principal determinant of transcriptional polarity in Archaea. Because the very same interaction exists in metazoan pol II promoters, it is likely that the TFIIB/BRE interaction contributes to the transcriptional polarity of most pol II promoters as well. Unfortunately, the structural details underlying the polar assembly of the TBP/TF(II)B/promoter complex were not initially revealed because both the archaeal and eukaryal structures were determined before the BRE had been identified. Hence, neither structure had sufficient DNA upstream of the TATA box to reveal the specific interactions between the BRE and TF(II)B (Fig. 1A) (9, 20). We have, therefore, directed our structure analysis toward TBP/TFBc/promoter complexes that contains DNA oligonucleotides of sufficient length to reveal the complete interface between the promoter and TF(II)Bc.
Figure 1.
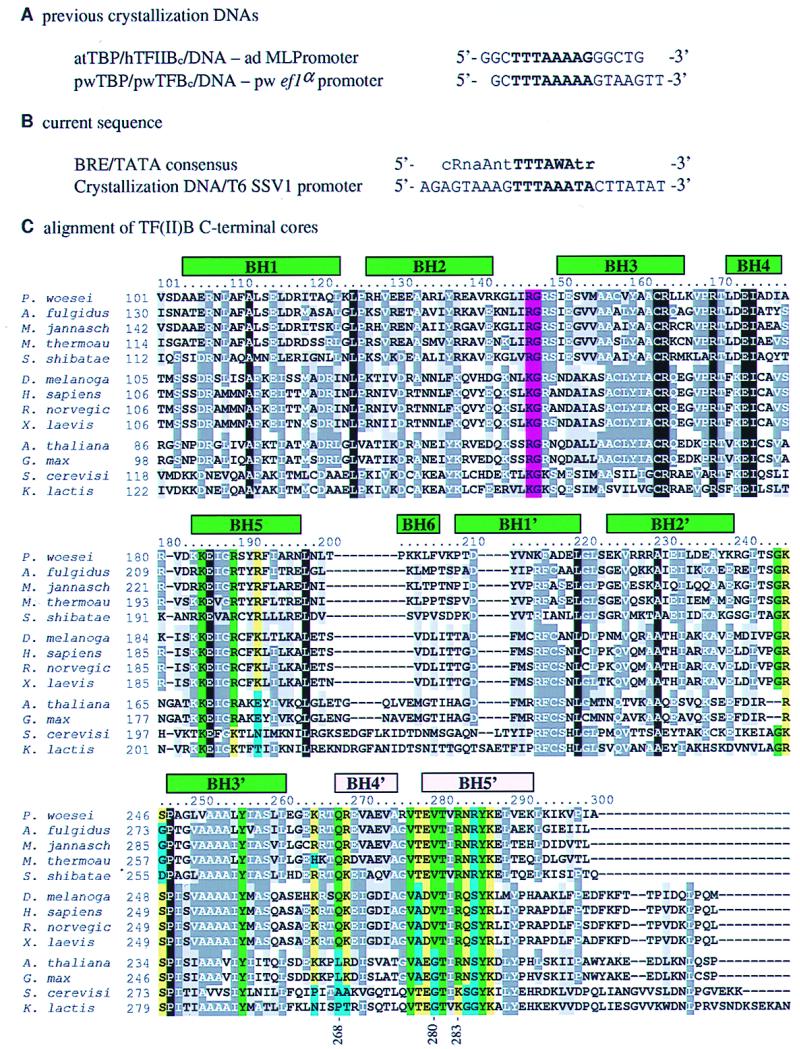
Oligonucleotides and sequence alignment. (A) Oligonucleotides used in previous crystal structures (14, 15, 20). The abbreviations used are as follows: h, human; at, Arabidopsis thaliana; pw, Pyrococcus woesei; TF(II)Bc, C-terminal core of TF(II)B; and ad MLPromoter, adenovirus major late promoter. (B) Comparison of the archaeal BRE consensus (18) with the oligonucleotide used in the current TBP/TFB/DNA structure. (C) clustalw (21) alignment of the C-terminal cores of TFB and TFIIB. The TFBs listed (and their database accession numbers) are from Pyrococcus woesei (P29095), Archaeoglobus fulgidus (AE001014), Methanococcus jannaschii (AAB98771), Methanobacterium thermoautotrophicum (AE000864), and Sulfolobus shibatae (AAA81380). The metazoan TFIIBs listed are from Drosophila melanogaster (AAA79093), Homo sapiens (AAA61149), Rattus norvegicus (CAA46766), and Xenopus laevis (CAA44668). The plant TFIIBs listed are from Arabidopsis thaliana (AAC35529) and Glycine max (AAB09756). The fungal TFIIBs listed are from Saccharomyces cerevisiae (AAB68135) and Kluyveromyces lactis (AAA35258). Conservation is indicated as follows: white text on a black background, completely conserved; white text on a dark gray background, conserved; black text on a light gray background, similar; black text on a white background, unconserved; black text on a light green background, conserved in all metazoan and archaeal proteins and contacts BRE; black text on a light yellow background, similar and contacts BRE; black text on a light blue background, unconserved and contacts BRE; and black text on a magenta background, contacts the DNA downstream of the TATA box. Helices are indicated as green boxes above the sequence alignment, labeled using the nomenclature of Nikolov et al. (9). The two helices of the helix–turn–helix (HTH) motif are colored pink. Residues explicitly mentioned in the text are indicated by numbers underneath the alignment. C was made with boxshade [maintained by K. Hofmann (khofmann@isrec-sun1.unil.ch) and M. D. Baron (michael.baron@bbsrc.ac.uk)].
The promoter sequence used in this study is based on the natural T6 promoter from the SSV1 virus of Sulfolobus shibatae (22) and includes the eight-base-pair TATA box with an additional nine base pairs upstream and seven base pairs downstream of the TATA box. The naturally occurring sequence of the upstream DNA closely matches the consensus BRE identified by Qureshi and Jackson (18) (Fig. 1B). We have also determined the structure of a similar complex containing the SSV1 T5 promoter, which shows the same architecture and interactions (not shown).
Materials and Methods
The pwTBP construct, including residues 1–181, and the pwTFBc construct, including residues 101–300, were expressed and purified as described (20, 23). Complementary oligonucleotides (24 nucleotides, blunt end) were synthesized chemically (Keck Facility, Yale University) and purified by reversed-phase chromatography on a DNAPure column (Rainin Instruments). After purification, the oligonucleotides were mixed in a one-to-one ratio and annealed by heating to 80°C and cooling overnight. The ternary complex was formed by the stepwise addition of first TBP and then TFBc to the DNA to a final concentration of 0.4 mM:0.4 mM:0.6 mM TBP/TFB/DNA. The complex was then dialyzed against 200 mM potassium acetate/50 mM Hepes, pH 8.0. Crystals were grown by hanging-drop vapor diffusion in 4-μl drops formed by adding the complex solution to an equal volume of the well solution followed by equilibration against a well solution consisting of 30% (wt/vol) PEG 400, 25 mM SrCl2, 200 mM sodium citrate, and 50 mM Tris, pH 8.5. Crystals grew to the size of 0.4 mm × 0.4 mm × 0.4 mm within 1 week at 19°C. After 2 weeks, crystals were equilibrated by free interface diffusion in a 0.7-mm inside diameter glass capillary against an excess of cryoprotectant [35% (wt/vol) PEG 400/15% (wt/vol) glucose/5 mM SrCl2/100 mM sodium citrate/50 mM Tris⋅HCl, pH 8.5] over a 24-hr period. The crystals were then flash frozen by immersion in liquid nitrogen. Data were collected at the Advanced Photon Source, Structural Biology Center beamline 19-ID, Argonne National Laboratory (Argonne, IL), in a low-, medium-, and high-resolution pass in a N2 stream at 100 K. The data were integrated with hkl2000 (24) and reduced with scala (25). The orientation and position of the complex were determined by molecular replacement using the previously determined pwTBP/TFBc/DNA structure [PDB accession no. 1AIS (20)] as a model in cns (26). The model was rebuilt by using the program o (27) and refined with cns in iterative cycles. The structure was refined against a randomly selected 90% of the data from 20.0 to 2.4 Å with a bulk solvent correction applied in cns. After molecular replacement, the entire complex was first refined as a rigid body, followed by rigid body refinement of the components and domains. The model was rebuilt against a series of simulated annealing omit maps spanning the entire complex to remove model bias. In the final stages of refinement, waters were added to the model by selecting peaks in the omit maps that were both greater than 3 times rms deviation and within hydrogen bonding distance of a hydrogen bond donor or acceptor. The crystallographic details and refinement statistics are presented in supplementary materials (www.pnas.org), and Fig. 2D shows a representative section of 2Fo − Fc electron density.
Figure 2.

Overall view of the TBP/TFBc/DNA complex. TBP is shown as a ribbon diagram with the N-terminal repeat colored red and the C-terminal repeat colored pink. TFBc is shown as a ribbon diagram with the N-terminal cyclin repeat colored dark green and the C-terminal cyclin repeat colored green with the HTH highlighted in magenta. The DNA is shown as a stick drawing with the sense strand in cyan and the antisense strand in yellow. The TATA box is colored blue and orange. (A) View of the complex looking down the distorted double-helical axis of the TATA-box DNA. The upstream DNA is nearest the viewer. (B) View of the complex rotated from the orientation in A by 90° about the vertical axis. The arrow points in the direction of the start site of initiation. (C) View of the complex, highlighting the TFBc/BRE interaction. (D) Stereo diagram of a (2Fo − Fc) electron-density map contoured at 1 rms deviation, showing contacts between TFBc and the phosphate backbone of the BRE upstream of the TATA box. Red dots represent water molecules. (E) Same view as D with hydrogen bonds shown as dashed black lines. The phosphates are numbered with respect to the TATA-box sequence. Figures were created with bobscript (28) and raster-3d (29).
Results and Discussion
General Features of the TBP/TFB/Promoter Complex.
Fig. 2 A–C depict the crystal structure of the ternary complex. Overall, the structure is quite similar to the previously determined TBP/TF(II)Bc/TATA-box structures (9, 20), with the individual domains and most of the DNA superimposing quite well. In particular, the TBP–TFBc interface is the same. The greatest difference lies in the orientation of the TBP/TFBc complex on the promoter and the existence of a much larger and a more intimate and specific TFBc/DNA interface. When the start site of transcription was used as a point of reference, the orientation of the DNA in the previously determined archaeal TBP/TFBc/TATA-box structure (20) was opposite to the orientation found in all the eukaryal structures that included TBP and the TATA box (6, 7, 9–12). In the present archaeal structure, the DNA is in the same orientation relative to the proteins as found in the eukaryal structures. In the previous crystal structure of the archaeal complex, TFBc bound the seven-base-pair segment downstream rather than the upstream DNA to satisfy some of the protein–DNA nonspecific interactions because the upstream DNA had only two base pairs (Fig. 1 A and B). As the seven-base-pair downstream DNA segment did not contain the BRE consensus sequence, TFBc could not make the specific protein–DNA contacts that are revealed in the current structure. Our structure also shows a bend toward the major grove in the BRE that brings the DNA in close contact with helix BH5′ and a neighboring surface of TFBc (Figs. 1C and 4B). The bend corresponds to the site in the promoter made hypersensitive to DNase I cleavage upon binding of TFBc as reported by Bell et al. (19). In the original archaeal structure of Kosa et al. (20), the DNA does not bend as much around helix BH5′ of TFB, either because the DNA lacks the flexibility of a BRE consensus sequence and/or the DNA does not extend far enough for TFBc to contact the phosphate backbone upstream of the BRE as is observed in our structure (Figs. 3 C and D and 4 A and B).
Figure 4.
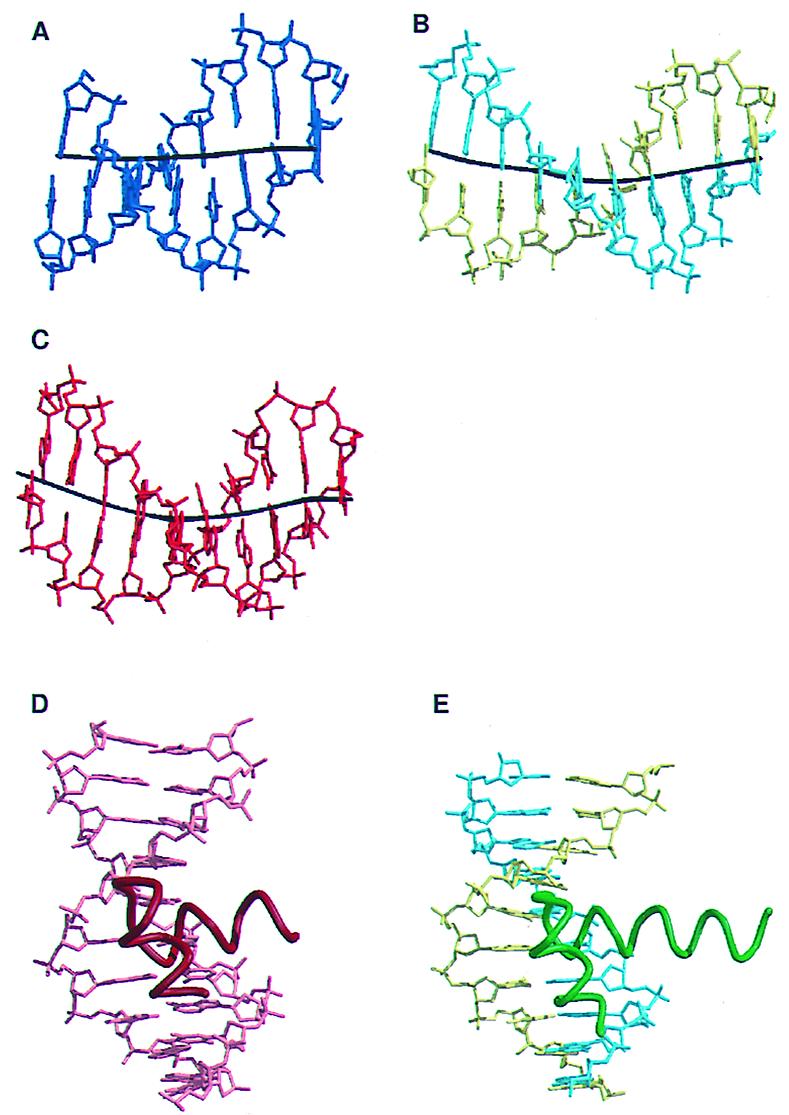
Comparison to other HTH protein/DNA complexes. (A) A stick diagram of the downstream DNA from the previously determined structure of the TBP/TFBc/DNA complex. (B) A stick diagram of the upstream DNA from the current structure of the TBP/TFBc/DNA complex. (C) A stick diagram of the DNA from the PU.1/DNA complex (30). PU.1 is a member of the ETS winged HTH DNA-binding domains. In A, B, and C, the helical axes of the DNAs are shown as black lines. The PU.1 DNA and the upstream DNA from the current structure show the bend typical of HTH-bound DNA, whereas the downstream DNA from the previous determined structure of the archaeal TBP/TFBc/promoter complex is straighter. (D) The HTH and DNA from the λ repressor/operator complex (31). (E) The HTH and upstream DNA from the current TBP/TFBc/DNA complex. In D and E the DNAs are shown as stick figures and the HTHs are shown as coils.
Figure 3.

Details of the specific interactions between TFBc and the BRE. (A) Stereo diagram of the residues involved in sequence-specific contacts between TFBc and the major groove of the DNA in the BRE. (B) Schematized representation of the protein/DNA interactions in the complex. The red and green boxes represent residues from TBP and TFBc, respectively, that contact the DNA. The approximate locations of the β-strands of TBP are shown as pink stripes. Hydrogen bonds are shown as dashed lines, salt bridges are solid lines, and van der Waals contacts are shown as a solid line with a bar at the end or by a plain box overlaying the DNA site. The DNA is represented with circles, pentagons, and rectangles for the phosphates, ribose moieties, and bases, respectively. (C) Superposition of the C-terminal cyclin domains of TFBc from the current and previous TBP/TFBc/DNA complexes with the DNA. The current structure is shown in the same color scheme as in Fig. 2 with the −5 and −6 bases displayed. The previous structure of the archaeal complex (20) is shown as purple and dark blue for TFBc and the DNA, respectively, with the +5 and +6 bases displayed. The HTH structural motif is shown in vivid color, while the rest of the C-terminal cyclin domain of TFBc is shown in faded color. The surface of the major groove clearly forms a closer and more extensive contact with TFBc in the current structure. (D) A side view of the superposition shown in C. The DNAs are displayed as tubes running through the phosphate backbone. The DNA in the current structure can be seen bending up toward TFBc, allowing the protein to contact more of the major groove. Figures were created with bobscript (28), molscript (32), and raster-3d (29).
Details of the HTH–BRE Interaction.
Helices BH4′ and BH5′ (Figs. 1C and 2 A–C) in the second cyclin repeat of TFIIB (and TFB) constitute a structural motif that resembles a bacterial HTH, as pointed out previously (17). Our structure confirms this idea and includes features of TFB’s DNA-binding mode that further underline its functional similarity to that of bacterial HTH proteins. As in other HTH proteins, BH5′ is docked in the major groove of the DNA and residues in this helix make direct contact with the bases in the major groove, while the flanking DNA embraces the so-called recognition helix with nonspecific contacts due to the above-mentioned bend toward the major groove (Fig. 2E and 3B). The overall orientation of helix BH5′ with respect to the DNA axis is similar to that of other bacterial HTH proteins (Fig. 4 D and E). The base contacts are consistent with the observed consensus BRE sequence and the effect of mutational changes on the bases and amino acid side chains that form the interface (Fig. 3 A and B). Two conserved residues in TFIIB have been shown to be important for specific binding. Mutation of either R286 or V283 to alanine in human TFIIB leads to a loss of specific binding by TFIIB to the BRE (17). The homologous residues in TFBc, R283 and V280, make stereospecific hydrogen bonded and van der Waals contacts, respectively, with the conserved and mutationally sensitive bases in the archaeal BRE (Fig. 3A). These base pairs (−3 and −6 relative to the TATA box) are the strongest specificity determinants of the archaeal BRE (18). In addition to the direct contacts with the bases in the major groove of the BRE, TFBc makes many contacts with the phosphate backbones on both sides of the major groove that were not observed previously (Fig. 3B). Note that the guanidinium group of residue R188 forms two hydrogen bonds with phosphate oxygens both upstream and downstream of the TATA box, thus bridging the beginning and end of the severely bent TATA box. Of special importance is a common feature shared with the trp repressor (33), the λ repressor (31), the 434 repressor (34), λ cro (35), and 434 cro (36); all have a conserved glutamine residue§ at the beginning of the first helix of the HTH motif (Fig. 1C). The position of the side chain and the orientation of the amide function are fixed by a hydrogen bond to the phosphate backbone in all of these structures, and in each case the firmly anchored glutamine side chain, in turn, buttresses a direct side-chain/base interaction in the major groove of the DNA (Fig. 3A). This and other backbone interactions are facilitated by a bend in the DNA causing it to narrow the major grove around the second helix of the HTH, and hence are typically observed in specific HTH–major grove interfaces like those found in our structure (Fig. 4 A–C). The increased concavity creates a more extensive and intimate complementary interface between the protein and the DNA.¶
Possible Implications in Metazoa.
Metazoan TFIIB is expected to make contacts similar to those of the eukaryal BRE.‖ The residues in TFBc that are involved in the stereochemical recognition of DNA are also conserved in TFIIB from metazoans but are less well conserved in TFIIB from the plant and fungal kingdoms (Fig. 1C) (17). It is not surprising that half of the 20 residues that contact the BRE are identical in archaea and animals, and another 30% are similar in the two. In contrast, only one residue in six is identical between Metazoa and Archaea in the remaining residues. This conservation suggests that this specific recognition of the BRE by TF(II)B existed before the divergence of the archaeal and eukaryal transcription systems and that TFIIB in metazoan systems will be found to make similar interactions with the upstream DNA. This idea has been substantiated in crystallographic studies (38) on the human system. Since the archaeal BRE has a somewhat different consensus than its metazoan counterpart, we would expect different details in the interface in the two systems. The stereochemical nature of the plant and fungal TFIIB/promoter interactions is not clear.
The crystal structure presented in this paper shows in atomic detail the molecular mechanism by which the BRE is recognized by a HTH motif within TFB, using interactions that are remarkably similar to those employed by the HTH of bacterial regulatory proteins. The revealed interactions are important for transcription from both archaeal and eukaryal promoters and are used to set the basal level of transcription as evidenced by the fact that mutation of the BRE element in both Archaea and Eucarya can lead to changes of greater than an order of magnitude in the basal levels of transcription (17, 18). In addition, the lack of a proper BRE allowed TBP and TFBc to bind in a reversed orientation in the previously determined crystal structure of the archaeal ternary complex, clearly demonstrating that, in the absence of a TFB/BRE interaction, TBP has the ability to bind to the TATA box in either orientation, in agreement with the data presented in Bell et al. (19). This crystal structure and the functional studies of Bell et al. highlight the importance of the specific TFBc/BRE interactions in establishing the polarity of assembly of the archaeal transcription preinitiation complex. In view of the high degree of structural and/or sequence homology between the archaeal and eukaryal pol II transcription systems (3–5, 13), it is likely that the analogous TFIIBc/BRE interaction of Metazoa (17) may also influence the polarity of transcription from many pol II promoters as well.
Supplementary Material
Acknowledgments
We thank Drs. Stephen Bell and Stephen Jackson of the Cancer Research Campaign–Wellcome labs in Cambridge, U.K., for helpful discussions. We thank Dr. Stephen L. Ginell and Dr. Rongguang Zhang for their assistance in data collection at the Argonne National Laboratory Structural Biology Center beamline at the Advanced Photon Source, U.S. Department of Energy, Contract W-31-109-ENG-38. This work was supported, in part, by National Institutes of Health Grant GM15225. Y.K. is a Eugene V. Weissmann–Irvington Institute for Immunological Research Fellow.
Abbreviations
- pol II
RNA polymerase II
- TBP
TATA-box-binding protein
- TFB
transcription factor B
- TFBc
C-terminal core of TFB
- BRE
B recognition element
- HTH
helix–turn–helix
Note Added in Proof
Since the acceptance of this manuscript, we have learned that an analogous crystallographic study of a complex containing all human factors bound to a human viral promoter segment will be published in the EMBO Journal (39).
Footnotes
Data deposition: The atomic coordinates have been deposited in the Protein Data Bank, www.rcsb.org (PDB ID code 1D3U).
trp repressor, Gln-68; λ repressor, Gln-33; 434 repressor, Gln-17; λ cro, Gln-16; and 434 cro, Gln-17.
The C-terminal TFB cyclin repeat/BRE interaction in the current structure buries 1,400 Å2 of solvent-accessible surface area. In the previous archaeal structure, only 1,290 Å2 was buried in the C-terminal TFB cyclin repeat/DNA interaction (this includes area buried against crystallographically packed neighboring DNA) (20). The eukaryal structure of Nikolov et al. (9) buried 800 Å2 in the C-terminal TFIIB cyclin repeat/DNA interface (again, this includes area buried against crystallographically packed neighboring DNA). For contrast with bacterial HTH domains, a monomer of the trp repressor/DNA complex buries 1,730 Å2, and a monomer of the λ repressor/DNA complex buries 1,250 Å2. Solvent-accessible surface area was calculated by using msp (37).
The metazoan BRE is slightly different from the archaeal BRE. In particular, the base at −3 relative to the TATA box, which is important for both the archaeal and metazoan systems, is a guanine rather than an adenine (17).
References
- 1.Hausner W, Wettach J, Hethke C, Thomm M. J Biol Chem. 1996;271:30144–30148. doi: 10.1074/jbc.271.47.30144. [DOI] [PubMed] [Google Scholar]
- 2.Qureshi S A, Bell S D, Jackson S P. EMBO J. 1997;16:2927–2936. doi: 10.1093/emboj/16.10.2927. [DOI] [PMC free article] [PubMed] [Google Scholar]
- 3.Roeder R G. Trends Biochem Sci. 1996;21:327–335. [PubMed] [Google Scholar]
- 4.Baumann P, Qureshi S A, Jackson S P. Trends Genet. 1995;11:279–283. doi: 10.1016/s0168-9525(00)89075-7. [DOI] [PubMed] [Google Scholar]
- 5.Bell S D, Jackson S P. Cold Spring Harbor Symp Quant Biol. 1998;63:41–51. doi: 10.1101/sqb.1998.63.41. [DOI] [PubMed] [Google Scholar]
- 6.Kim J L, Nikolov D B, Burley S K. Nature (London) 1993;365:520–527. doi: 10.1038/365520a0. [DOI] [PubMed] [Google Scholar]
- 7.Kim Y, Geiger J H, Hahn S, Sigler P B. Nature (London) 1993;365:512–520. doi: 10.1038/365512a0. [DOI] [PubMed] [Google Scholar]
- 8.Koleske A J, Young R A. Trends Biochem Sci. 1995;20:113–116. doi: 10.1016/s0968-0004(00)88977-x. [DOI] [PubMed] [Google Scholar]
- 9.Nikolov D B, Chen H, Halay E D, Usheva A A, Hisatake K, Lee D K, Roeder R G, Burley S K. Nature (London) 1995;377:119–128. doi: 10.1038/377119a0. [DOI] [PubMed] [Google Scholar]
- 10.Nikolov D B, Chen H, Halay E D, Hoffman A, Roeder R G, Burley S K. Proc Natl Acad Sci USA. 1996;93:4862–4867. doi: 10.1073/pnas.93.10.4862. [DOI] [PMC free article] [PubMed] [Google Scholar]
- 11.Geiger J H, Hahn S, Lee S, Sigler P B. Science. 1996;272:830–836. doi: 10.1126/science.272.5263.830. [DOI] [PubMed] [Google Scholar]
- 12.Tan S, Hunziker Y, Sargent D F, Richmond T J. Nature (London) 1996;381:127–151. doi: 10.1038/381127a0. [DOI] [PubMed] [Google Scholar]
- 13.Tsai F T, Littlefield O, Kosa P F, Cox J M, Schepartz A, Sigler P B. Cold Spring Harbor Symp Quant Biol. 1998;63:53–61. doi: 10.1101/sqb.1998.63.53. [DOI] [PubMed] [Google Scholar]
- 14.Xu L C, Thali M, Schaffner W. Nucleic Acids Res. 1991;19:6699–6704. doi: 10.1093/nar/19.24.6699. [DOI] [PMC free article] [PubMed] [Google Scholar]
- 15.Li J J, Kim R H, Sodek J. Biochem J. 1995;310:33–40. doi: 10.1042/bj3100033. [DOI] [PMC free article] [PubMed] [Google Scholar]
- 16.Cox J M, Hayward M M, Sanchez J F, Gegnas L D, van der Zee S, Dennis J H, Sigler P B, Schepartz A. Proc Natl Acad Sci USA. 1997;94:13475–13480. doi: 10.1073/pnas.94.25.13475. [DOI] [PMC free article] [PubMed] [Google Scholar]
- 17.Lagrange T, Kapanidis A N, Tang H, Reinberg D, Ebright R H. Genes Dev. 1998;12:34–44. doi: 10.1101/gad.12.1.34. [DOI] [PMC free article] [PubMed] [Google Scholar]
- 18.Qureshi S A, Jackson S P. Mol Cell. 1998;1:389–400. doi: 10.1016/s1097-2765(00)80039-8. [DOI] [PubMed] [Google Scholar]
- 19.Bell S D, Kosa P L, Sigler P B, Jackson S P. Proc Natl Acad Sci USA. 1999;96:13662–13667. doi: 10.1073/pnas.96.24.13662. [DOI] [PMC free article] [PubMed] [Google Scholar]
- 20.Kosa P F, Ghosh G, DeDecker B S, Sigler P B. Proc Natl Acad Sci USA. 1997;94:6042–6047. doi: 10.1073/pnas.94.12.6042. [DOI] [PMC free article] [PubMed] [Google Scholar]
- 21.Thompson J D, Higgins D G, Gibson T J. Nucleic Acids Res. 1994;22:4673–4680. doi: 10.1093/nar/22.22.4673. [DOI] [PMC free article] [PubMed] [Google Scholar]
- 22.Reiter W D, Palm P, Zillig W. Nucleic Acids Res. 1988;16:1–19. doi: 10.1093/nar/16.1.1. [DOI] [PMC free article] [PubMed] [Google Scholar]
- 23.DeDecker B S, O’Brien R, Fleming P J, Geiger J H, Jackson S P, Sigler P B. J Mol Biol. 1996;264:1072–1084. doi: 10.1006/jmbi.1996.0697. [DOI] [PubMed] [Google Scholar]
- 24.Otwinowski Z, Minor W. In: Macromolecular Crystallography. Carter C W, Sweet R M, editors. 276A. New York: Academic; 1997. pp. 307–326. [Google Scholar]
- 25.Bailey S. Acta Crystallogr D. 1994;50:760–763. [Google Scholar]
- 26.Brünger A T, Adams P D, Clore G M, DeLano W L, Gros P, Grosse-Kunstleve R W, Jiang J-S, Kuszewski J, Nilges M, Pannu N S, et al. Acta Crystallogr D. 1998;54:905–921. doi: 10.1107/s0907444998003254. [DOI] [PubMed] [Google Scholar]
- 27.Jones T A, Zou J-Y, Cowan S W, Kjeldgaard M. Acta Crystallogr A. 1991;47:110–119. doi: 10.1107/s0108767390010224. [DOI] [PubMed] [Google Scholar]
- 28.Esnouf R M. J Mol Graphics. 1997;15:132–134. doi: 10.1016/S1093-3263(97)00021-1. [DOI] [PubMed] [Google Scholar]
- 29.Merritt E A, Murphy M E. Acta Crystallogr D. 1994;50:869–873. doi: 10.1107/S0907444994006396. [DOI] [PubMed] [Google Scholar]
- 30.Kodandapani R, Pio F, Ni C Z, Piccialli G, Klemsz M, McKercher S, Maki R A, Ely K R. Nature (London) 1996;380:456–460. doi: 10.1038/380456a0. [DOI] [PubMed] [Google Scholar]
- 31.Beamer L J, Pabo C O. J Mol Biol. 1992;227:177–196. doi: 10.1016/0022-2836(92)90690-l. [DOI] [PubMed] [Google Scholar]
- 32.Kraulis P. J Appl Crystallogr. 1991;24:946–950. [Google Scholar]
- 33.Otwinowski Z, Schevitz R W, Zhang R G, Lawson C L, Joachimiak A, Marmorstein R Q, Luisi B F, Sigler P B. Nature (London) 1988;335:321–329. doi: 10.1038/335321a0. [DOI] [PubMed] [Google Scholar]
- 34.Aggarwal A K, Rodgers D W, Drottar M, Ptashne M, Harrison S C. Science. 1988;242:899–907. doi: 10.1126/science.3187531. [DOI] [PubMed] [Google Scholar]
- 35.Albright R A, Matthews B W. J Mol Biol. 1998;280:137–151. doi: 10.1006/jmbi.1998.1848. [DOI] [PubMed] [Google Scholar]
- 36.Mondragon A, Harrison S C. J Mol Biol. 1991;219:321–334. doi: 10.1016/0022-2836(91)90568-q. [DOI] [PubMed] [Google Scholar]
- 37.Connoly L. J Mol Graphics. 1993;11:139–141. doi: 10.1016/0263-7855(93)87010-3. [DOI] [PubMed] [Google Scholar]
- 38.Tsai, F. T. & Sigler, P. B. (1999) EMBO J., in press.
- 39.Tsai, F. T. & Sigler, P. B., EMBO J., in press.
Associated Data
This section collects any data citations, data availability statements, or supplementary materials included in this article.