Abstract
Previous anatomic studies of the geniculocortical projection showed that ocular dominance columns emerge by 3 weeks of age in cat visual cortex, but recent optical imaging experiments have revealed a pattern of physiologic eye dominance by the end of the second week of life. We used two methods to search for an anatomic correlate of this early functional ocular dominance pattern. First, retrograde labeling of lateral geniculate nucleus (LGN) inputs to areas of cortex preferentially activated by one eye showed that the geniculocortical projection was already partially segregated by eye at postnatal day 14 (P14). Second, transneuronal label of geniculocortical afferents in flattened sections of cortex after a tracer injection into one eye showed a periodic pattern at P14 but not at P7. In the classic model for the development of ocular dominance columns, initially overlapping geniculocortical afferents segregate by means of an activity-dependent competitive process. Our data are consistent with this model but suggest that ocular dominance column formation begins between P7 and P14, approximately a week earlier than previously believed. The functional and anatomic data also reveal an early developmental bias toward contralateral eye afferents. This initial developmental bias is not consistent with a strictly Hebbian model for geniculocortical afferent segregation. The emergence of ocular dominance columns before the onset of the critical period for visual deprivation also suggests that the mechanisms for ocular dominance column formation may be partially distinct from those mediating plasticity later in life.
Keywords: geniculocortical projections, transneuronal labeling, area 17, development, layer IV, optical imaging
In the visual cortex of the adult cat, cells that respond preferentially to stimulation of one eye or the other are organized in ocular dominance (OD) columns that run perpendicularly to the cortical surface. Visual input to layer IV is provided by alternating patches of highly ramified geniculocortical afferents serving the right and left eyes. The emergence of ocular dominance columns during development has been classically viewed as progressing by means of an activity-dependent competitive process from an immature state in which the geniculocortical afferents serving the two eyes are completely overlapping to a mature state in which afferents serving the two eyes are largely segregated. Much of the evidence for this view has come from anatomic studies of the projection pattern of geniculocortical afferents labeled transneuronally after injection of tracer into one eye. In young cats, the transneuronal labeling in the cortex appeared homogeneous before 3 weeks of age (LeVay et al., 1978), as did similar label in monkeys younger than 6 weeks prenatal (Rakic, 1976, 1981). Periodic labeling was first evident by postnatal day 22 (P22) in cats and by the time of birth in the monkey (Rakic, 1976, 1981; Horton and Hocking, 1996), and these patterns became more distinct over the next few weeks. The role of activity was inferred from experiments showing that when retinal activity was blocked by binocular injections of tetrodotoxin (TTX) beginning around P14, the afferents appeared uniform and intermingled when assayed anywhere from 3-6 weeks later (Stryker and Harris, 1986). Competition between the two eyes during ocular dominance column development has been similarly inferred from deprivation studies (Wiesel and Hubel, 1965) in which one eye achieves dominance in visual cortex when the other eye is deprived of vision for as little as 1 or 2 days (Trachtenberg et al., 2000) starting at approximately P21 (Olson and Freeman, 1980).
A recent finding has led us to reconsider the time at which ocular dominance columns are formed in layer IV: a pattern of eye dominance was observed in intrinsic signal optical imaging experiments in young cats around 2 weeks of age (Crair et al., 1998), and the reliability of the responses in the images was verified by targeted microelectrode penetrations. Although the spatial pattern resembled ocular dominance columns in mature animals, the actual responses were quite different, because responses to stimulation of the contralateral eye were overall much stronger than those to the ipsilateral eye. The pattern observed was, thus, a fluctuation between complete contralateral dominance and binocular responses. Unlike in older animals, there were no areas completely dominated by the ipsilateral eye. Such a pattern of eye dominance was difficult to reconcile with even coverage of layer IV by intermingled afferents from the two eyes. Indeed, the early detection of functional OD columns raises the possibility that studies of geniculocortical afferent segregation must be shifted to earlier dates.
Therefore, we have revisited the development of geniculocortical connectivity in young cats by conducting two sets of experiments. In the first set of experiments, we analyzed whether the cortical OD columns identified at 2 weeks of age by optical imaging specifically receive input from geniculate cells in particular laminae. We made focal injections of retrograde tracers into nascent contralateral or ipsilateral OD columns and then analyzed the distribution of retrogradely labeled cells in the lateral geniculate nucleus (LGN). In the second set of experiments, we took advantage of the fact that flattened preparations of the cortex allow a more sensitive detection of spatial patterns than is possible in cross sections. We studied the flattened visual cortex of young cats at P7, P14-15, and P21 to identify the first time at which transneuronal labeling of geniculocortical terminals showed periodic fluctuations. Both techniques detected the emergence of a regular pattern of ocular dominance columns by P14, whereas both transneuronal labeling and optical imaging of ocular dominance appeared uniform at P7. These findings suggest that ocular dominance column formation begins between P7 and P14, approximately a week earlier than previously believed, and suggest a reinterpretation of some prior studies of OD column segregation.
MATERIALS AND METHODS
All experiments were performed under the guidelines established by the US National Institute of Health and the protocols were approved by the Laboratory Animal Resource Center of the University of California, San Francisco.
Optical intrinsic signal imaging
Three adult cats and five cats age postnatal day 14 (P14) to P16 were used for this set of experiments (Table 1). Cats were initially anesthetized with a mixture of halothane in N2O:O2 (1:1), an i.v. catheter was placed in the femur, and the animals were intubated for artificial ventilation. The animal was positioned in a Horsley-Clarke stereotaxic apparatus; the electrocardiogram, expired CO2 (3.8-4.2%), and rectal temperature were continuously monitored. Anesthesia was maintained throughout the experiment by i.v. infusion of sodium thiopental (10 mg/ml; Abbott, North Chicago, IL) followed by pentobarbital (10 mg/ml; Abbott). Muscle paralysis was induced with a bolus of gallamine triethiodide (1.5 mg/kg per hour in 2.5% dextrose/lactated Ringer’s solution). The level of anesthesia was assessed by continuously monitoring the heart rate and expired CO2. Additional pentobarbital was given to maintain the heart rate at or below its level during the preparatory phase of the experiment, when the animal was not paralyzed and its arousal state could be accurately monitored with noxious stimuli.
TABLE 1.
Retrograde Tracers Injections into the Visual Cortex1
| Animal | Age at injections | Ipsilateral patches | Contralateral patches |
|---|---|---|---|
| K109 | P16 | Fluorescein | Rhodamine |
| K123 | P14 | Fluorescein | Rhodamine |
| K124 | P14 | Fluorescein | Rhodamine |
| K137 | P16 | CTB | WAHG |
| K167 | P14 | WAHG (R hem) | CTB (L/R hem) |
| K146 | P77 | CTB (L/R hem) | WAHG (R hem) |
| K170 | Adult | WAHG (R hem) | WAHG (L hem) |
| K177 | Adult | WAHG (R hem) | CTB (R hem) |
| Transneuronal labeling experiments | |
|---|---|
| Animal | Age at perfusion |
| K217 | P7 |
| K218 | P7 |
| K216 | P14 |
| K158 | P15 |
| K161 | P15 |
| K219 | P21 |
P, postnatal day; CTB, cholera toxin B; WAHG, wheat germ apo-horseradish peroxidase gold; L hem, left hemisphere; R hem, right hemisphere.
Details of the imaging protocols have been published previously (Crair et al., 1997). Briefly, a bone flap of approximately 10 × 10 mm was removed above Area 17 of the cortex, around anterior-posterior 0 (AP 0) in the stereotaxic apparatus. The dura was carefully reflected and the opening filled with 3% agarose and capped with a clear glass coverslip to provide an undistorted view of the cortex. The remaining exposed agarose was covered with oil and plastic wrap to prevent drying and shrinkage. The cortical surface of one hemisphere was illuminated with green light (540 nm), and a slow-scan cooled CCD camera (Princeton Instruments, Trenton, NJ) was initially focused on the pial surface to obtain a clear image of the surface vasculature. For acquiring optical intrinsic signals reflecting neuronal activity, the cortex was illuminated with 610-nm light and the camera was focused 250-400 μm below the pial surface. The animal was visually stimulated with computer generated square wave gratings (0.10 or 0.15 cycles/degree) moving in both directions at eight different orientations (0, 22, 45, 67, 90, 112, 135, and 157 degrees). The stimuli were presented on a monitor placed 40 cm in front of the animal. One set of stimuli consisted of the 16 oriented stimuli (8 presented to each eye individually) and 4 gray screen stimuli isoluminant with the average grating luminance. Each stimulus in a set was presented in pseudo-random order and repeated 16-32 times. For each stimulus orientation, the acquired raw images were averaged and then normalized against the blank (gray) stimulus. The ocular dominance ratio map was the ratio of the average response to all eight orientations presented to each eye. An overall optical Contralateral Bias Index (optical CBI; Crair et al., 1998; Issa et al., 1999) was calculated for each map by assigning to each pixel an eye dominance value based on the relative response strength through each eye and then averaging all pixels within the regions of the maps that were free of vascular artifact. CBI values of 1.00 and 0.00 represent complete dominance of the contralateral eye and the ipsilateral eye, respectively. With the exception of K167, only one hemisphere was imaged in each animal.
Retrograde labeling of geniculocortical afferents
At the end of each optical recording session, two different retrograde tracers were injected into the contralateral and ipsilateral eye cortical domains, respectively, as assessed by the optical map. The exact site of each injection was determined by the pattern of the pial vasculature, which was superimposed on the optical map.
We used two combinations of retrograde tracers: (1) fluorescent dextrans (Fluoro Ruby, emission wavelength 580 nm, and Emerald Green, emission wavelength 518 nm; Molecular Probes, Eugene, OR); (2) cholera toxin B (CTB, List Biological Laboratories, Campbell, CA) and wheat germ apo-horseradish peroxidase gold (WAHG, prepared in the laboratory, Basbaum and Menetrey, 1986). The tracers were pressure injected through a glass pipette (10-30 μm tip diameter) by means of an oocyte injector (Drummond Scientific, Broomall, PA). The pipette was lowered to a depth of 400-500 μm from the pial surface targeting layer IV. Volumes injected varied from 10 to 100 nl. Generally, CTB was injected in smaller volumes because of its tendency to spread around the site of injection.
After tracer injections, the cortex was covered with 3% agarose, the animal was maintained in the stereotaxic apparatus and continuously monitored for an additional 24 to 36 hours. The animal was given an overdose of sodium pentobarbital (150 mg/kg) and perfused through the heart with phosphate buffer (0.1 M, 4°C, pH 7.4) followed by 4% paraformaldehyde in 0.1 M phosphate buffer (4°C). Brains were dissected and left overnight in fixative. In the three experiments in which fluorescent dextrans were used, the brains were cut in 50-μm sections in the sagittal plane. Sections were collected in fixative, washed briefly in PBS pH 7.4, mounted on slides, and cover-slipped for viewing in fluorescent microscopy. Due to the small volume of injected tracers, only a few cells in the LGN were retrogradely labeled and these were directly counted.
In the two experiments in which the combination of CTB and WAHG was used, the cortices were separated from the subcortical structures and cut at 50 μm in the coronal plane, whereas the thalamus containing the LGN was cut at 50 μm parasagitally. Both cortical and thalamic sections were processed first for gold intensification for visualizing the WAHG gold particles, then for CTB immunohistochemistry.
Gold intensification of WAHG
Sections were washed in 50% ethanol in distilled water for 30-45 minutes, followed by 3× 10-minute washes in distilled water. Sections were then reacted with the Amersham silver intensification kit (Amersham, Arlington Heights, IL) according to the company protocol, fixed with 2.5% sodium thiosulfate in distilled water, and finally rinsed 3× 10 minutes in distilled water, and processed for CTB immunostaining.
CTB immunostaining
Sections were placed for 2 hours in blocking solution containing 2.5% bovine serum albumin (Sigma), 3% normal rabbit serum (Vector, Burlingame, CA), and 0.3% Triton X-100 (Sigma) in phosphate buffer saline (PBS, pH 7.4). Sections were then left for 24-48 hours in goat anti-CTB antibody (1:10,000, List Biological Laboratories) dissolved in blocking solution. After 3× 15-minute washes in blocking solution, sections were transferred for 12 hours to a solution containing rabbit biotinylated secondary antibody (Vector, diluted in blocking solution according to the company protocol). After 3 × 15-minute washes in PBS, sections were transferred to avidin-biotin solution for 2 hours (Vector), then washed for 1 hour in 0.05 M Tris buffer (pH 7.4), and finally reacted for 10-20 minutes in a solution containing 0.05% diaminobenzidine, 0.01% hydrogen peroxide in Tris buffer. After 3× 15-minute washes in Tris buffer, sections were mounted onto gelatinized slides, dried overnight, and cover-slipped in Permount. Sections containing the LGN were examined in brightfield and darkfield microscopy. All retrogradely labeled neurons in every section containing the LGN were charted by using a computer assisted mapping system (Passera et al., 1988; Neurotrace, MA). Histologic images were obtained by scanning the histologic slides (Spot Camera, Twain software). Adjustments of brightness and contrast were done in Photoshop (Adobe).
Weighted CBI
The average ocular dominance (weighted CBI) of a set of targeted tracer injections was determined by measuring the dimensions in layer IV of each injection, and then computing and averaging the ocular dominance at each of these cortical regions. The dimension of each injection site was defined by the spread of tracer precipitate along the mediolateral and anteroposterior axes of the cortex. The maximal mediolateral width of an injection site was evaluated by examining the entire series of coronal sections through the cortex. The anteroposterior dimension of the injection site was given by the number of coronal sections containing the tracer precipitate. An ellipse, with axes corresponding to the measured width and length of the injection site, was centered on the optical map at the point of entrance of the injection pipette. The local CBI within each injection site was calculated, and an average CBI was determined for each tracer.
Retinogeniculocortical autoradiography with [3H]proline
In six young cats (P7, P7, P14, P15, P15, and P21 at perfusion, Table 1) the retinogeniculocortical pathway was labeled by transneuronal [3H]proline autoradiography. The tracer was prepared by reconstituting 2 mCi of L-[2,3,4,5-3H]proline, specific activity 102-106 Ci/mmol (Amersham) in 10 μl of sterile balanced salt solution. The cats were placed under general anesthesia with ketamine HCl (15 mg/kg i.m.). A drop of local anesthetic, proparacaine HCl, was placed in the eye. The pupil was dilated pharmacologically, and the tracer was injected into the mid-vitreous of the eye by using a 30-gauge needle. In every case, the right eye was injected. After a survival time of 5 days, the cats were given a lethal dose of sodium pentobarbital (150 mg/kg) and perfused with 300 ml of normal saline followed by 300 ml of 2% paraformaldehyde in 0.1 M phosphate buffer.
Visual cortex was unfolded, flattened, and sectioned at 30 μm with a freezing microtome (Olavarria and Van Sluyters, 1985). The LGN were cut in the coronal plane. Sections were coated with Kodak NTB2 emulsion for autoradiography (Wiesel et al., 1974) and exposed for 8 weeks (cortex) or 2 weeks (LGN). Pictures were taken with a Spot RT Slider camera (Diagnostic Instruments, Sterling Heights, MI). Adjustments in brightness were made between animals, but not between hemispheres of the same animal. Contrast settings were the same for all cortical autoradiographs.
RESULTS
The aim of this study is to establish the age at which geniculocortical afferents serving the two eyes begin to form ocular dominance patches within layer IV of the cat’s visual cortex. Earlier optical imaging studies had shown fluctuations in the overall dominance of the contralateral eye in the visual cortex around P14, confirmed by single unit recordings. The present experiments start with new examples of optical data showing that the segregated responses to the two eyes emerge in the visual cortex between P7 and P14. We then present anatomic data on the emergence of eye-specific projections by P14 using two complementary approaches: retrograde labeling of the geniculocortical afferents and anterograde labeling of the afferents by using transneuronal transport of radioactively tagged amino acids injected into one eye (Table 1).
Development of functional ocular dominance columns
In cats at P21 and older, imaging of intrinsic signal optical responses in the primary visual cortex reveals clear fluctuations in responses to the two eyes that have the appearance of the anatomic ocular dominance columns. Overall, at this and later ages, the contralateral eye gives rise to cortical responses that are only slightly stronger than those from the ipsilateral eye (Crair et al., 1998). Figure 1A shows an example of such an image. At P14, the ocular dominance fluctuations in the intrinsic signal images are less distinct, in part because of a strong bias of responses in favor of the contralateral eye, and the images are overall noisier, but unit recordings show that the pattern in the image corresponds to the ocular dominance of neurons recorded with microelectrodes (Crair et al., 1998). Figure 1B is an example of an image from a P14 animal, which shows a clear ocular dominance pattern (light patches), although it is on average darker than Figure 1A, in accordance with the overall dominance of the contralateral eye. The ocular dominance pattern is absent in Figure 1C from an animal at P8, as is typical of images from animals less than 10 days of age. Here, the overall contralateral dominance is clear and similar in magnitude to that present at P14, but no pattern of ocular dominance columns is evident. These findings suggest that the pathways from the two eyes begin to form ocular dominance columns after P7 and by P14 but that the overall dominance of the contralateral eye remains strong until P21.
Fig. 1.
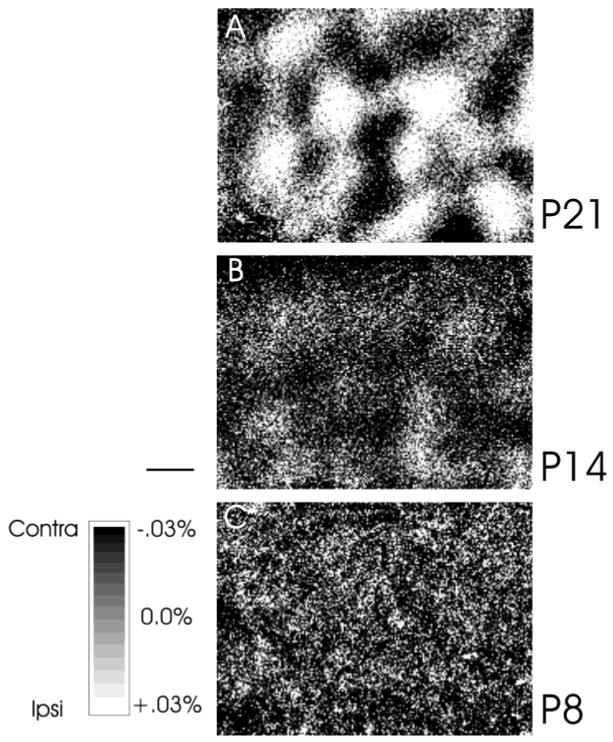
Optical imaging of intrinsic signals from the visual cortex of young cats at postnatal day 21 (P21) (A), P14 (B), and P8 (C). Responses through the contralateral eye are shown as darker areas. Distinct ocular dominance columns (light and dark patches) are present at P21. In cats a week younger (P14), eye-specific responses (light areas are ipsilateral eye patches) are emerging, although the cortex is dominated by responses through the contralateral eye (dark areas). No ocular dominance pattern is visible in a P8 cat (C), and the response is biased toward the contralateral eye (dark). Gray response scale applies to all images, which are not smoothed. Scale bar = 500 μm.
Selective retrograde labeling of geniculocortical cells by targeted injections
Targeted injections of a retrograde anatomic tracer into small patches of the visual cortex that respond preferentially to stimulation of one eye can be used to selectively label geniculate cells serving that eye. Injections targeted to contralateral eye-dominated patches in the visual cortex should result in retrograde labeling of neurons in LGN lamina A, whereas ipsilaterally targeted injections should label neurons in lamina A1. In the adult cat, geniculocortical arbors are well segregated by eye, so that targeted injections typically result in the selective retrograde labeling of neurons in the appropriate lamina of the lateral geniculate nucleus (LGN). Figure 2a shows images of intrinsic optical signals in adult cat V1, revealing regions of the visual cortex that are more active when stimulating one eye than the other (dark and light patches). These functional ocular dominance columns were targeted for injections of two different retrograde tracers, WAHG or CTB, using corresponding images of the cortical vasculature (not shown). WAHG injections are usually more focal, whereas CTB injections can be more widespread. The targeted ocular dominance columns receive eye-specific geniculocortical input, as demonstrated by the strong tendency of retrogradely labeled neurons in the LGN to be confined to the lamina corresponding to the eye whose ocular dominance column was focally injected with anatomic tracer. In the example shown in Figure 2, a WAHG injection was targeted to a contralateral eye patch (Fig. 2c and red ellipse in the optical map) and 2 CTB injections were targeted to ipsilateral eye patches (Fig. 2b,d and yellow ellipses in the optical map) in the right visual cortex. Similar sets of injections (CTB and WAHG) were made in the left visual cortex. The histograms in Figure 2e,g show the distribution of retrogradely labeled neurons in lamina A and A1 of the right LGN. Three of four sets of injections (WAHG in the right and left hemispheres and CTB in the left hemisphere) resulted in very selective labeling of neurons in eye-specific laminae of the lateral geniculate nucleus (Fig. 2e,g where red bars shows that specificity of WAHG-labeling is 100% and Fig. 2g where yellow bars show that CTB specificity is 95%). In the other set of injections (Fig. 2e: CTB, yellow bars), retrograde labeling was less specific (60% in the appropriate lamina). Such poor specificity in the adult cat is likely to be due either to a poorly targeted injection or to an injection that was so large that the anatomic tracer (CTB) spilled over into the other eye’s ocular dominance column in the cortex. These procedures typically labeled a large number of LGN cells, although in this experiment, the WAHG injection in the left hemisphere labeled only a few cells (Fig. 2g red bar). On average, similar experiments in which at least 20 neurons were retrogradely labeled from each of a total of five adult hemispheres (Table 1) resulted in significantly greater retrograde labeling of the targeted eye’s lamina in the LGN than chance would dictate (median test, P = 0.003); and in three of eight sets of injections, more than 95% of the labeled neurons lay in one LGN lamina.
Fig. 2.
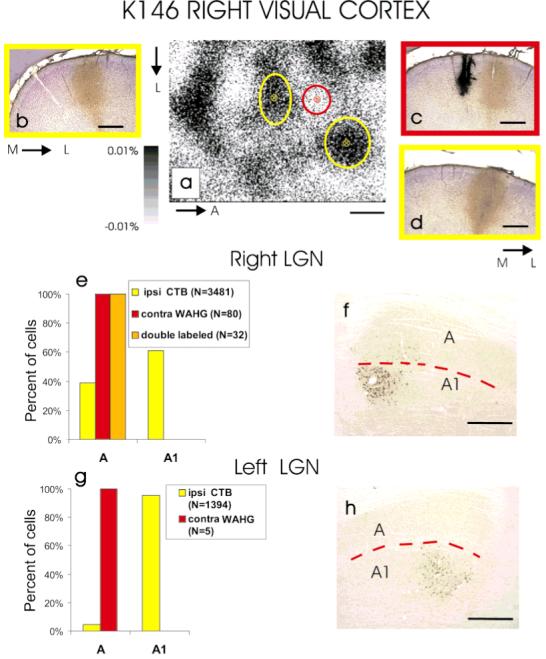
Retrograde labeling in the lateral geniculate nucleus (LGN) of an adult cat after targeted tracer injections into the right and left eye ocular dominance patches. a: Optical image of intrinsic signals from a 3.2 × 2.4 mm area of the right visual cortex showing clear ocular dominance (OD) patches activated through the contralateral (white areas) and ipsilateral (dark areas) eyes. A wheat germ apo-horseradish peroxidase gold (WAHG) injection (red ellipse on the optical image a, and c) and two cholera toxin B (CTB) injections (yellow ellipses on the optical image a, and b,d) were targeted to the contralateral and ipsilateral eye OD patches, respectively. The size of the ellipses centered at each injection site indicates the spread of the tracer as assessed histologically. b-d: Coronal sections through the lateral gyrus showing the spread of the tracers at the injection sites. e: Laminar distribution of retrogradely labeled neurons in the right LGN. Note that WAHG labeled neurons are restricted to lamina A, consistent with the small injection site in the cortex (red ellipse on the optical OD map a, and c). Because of the spread of the CTB at the injection sites (yellow ellipses in the optical OD map a, and b,d), the CTB-labeled neurons in the LGN are not restricted to lamina A1 (e,f). g,h: In the left hemisphere, the injected tracers were confined to eye-specific OD columns and retrogradely labeled neurons were restricted to the appropriate LGN lamina. M, medial, L, lateral; A, anterior. The red dotted lines in f and h mark the border between LGN laminae A and A1. Scale bars = 500 μm.
The same techniques were also applied to younger animals (P14-P16, Table 1). Figure 3a shows an example of targeted patches of intrinsic signal optical response in one young animal (K167), and Figure 3b shows the vascular image used to target the injections. The targeted injections of the retrograde tracer WAHG or CTB into functional ocular dominance columns in P14 animals also resulted in retrogradely labeled neurons in the thalamus. The laminar locations of these neurons are identified in sagittal sections through the LGN. One of these sections is shown in Figure 4, both in brightfield (Fig. 4A), to better observe the CTB label, and darkfield (Fig. 4B), to better detect the WAHG label. In this animal (K137), WAHG was injected into the contralateral eye patches in visual cortex, and CTB in the ipsilateral eye patches. High-power brightfield images of neuronal somata and dendrites retrogradely labeled with CTB show a diffuse brown precipitate and spherical dark vesicles (Fig. 4A, insets c and d). Neurons retrogradely labeled with WAHG contain small, black, silver-intensified gold particles (Fig. 4A, insets a and b). The silver-intensified gold particles are more easily detected and localized in darkfield (Fig. 4B and inset a), and double-labeled neurons are easily recognized in dark-field or in bright-field at high magnification (Fig. 4A, inset d and cell at bottom in inset b). In this example, the CTB injections targeted to the ipsilateral eye patches resulted in greater retrograde label of cells in LGN lamina A1 (Fig. 4 and K137 in Fig. 5). Neurons retrogradely labeled from contralateral eye patches with WAHG were slightly more numerous in LGN lamina A than A1 (Fig. 4B and K137 in Fig. 5). In this example, as in all of the young animals, there were many cells retrogradely labeled in the C LGN lamina. These neurons were not quantified because of the difficulty distinguishing the sublamination of layer C at this age.
Fig. 3.
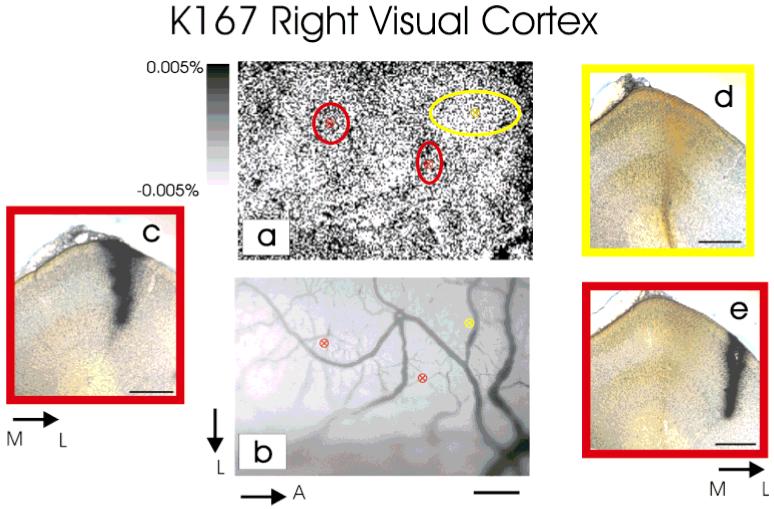
a: Optical image of intrinsic signals in the right visual cortex of a P16 cat. Ocular dominance columns are just emerging at this age, as shown by the faint fluctuations in the optical map. b: Vascular pattern of the imaged area guiding the injections of retrograde tracers. Two injections of wheat germ apo-horseradish peroxidase gold (WAHG) were made into areas that responded preferentially to the ipsilateral eye (a: red ellipses centered onto darker areas; insets c,e), and one injection of cholera toxin B was made into a region responding preferentially to the contralateral eye (a: yellow ellipse centered onto a white area; inset d). In a, the size of the ellipses centered at each injection site indicates the spread of the tracer as assessed histologically. c-e: Coronal sections through the lateral gyrus showing the spread of the tracers at the injection sites. Scale bars = 500 μm for a-e.
Fig. 4.
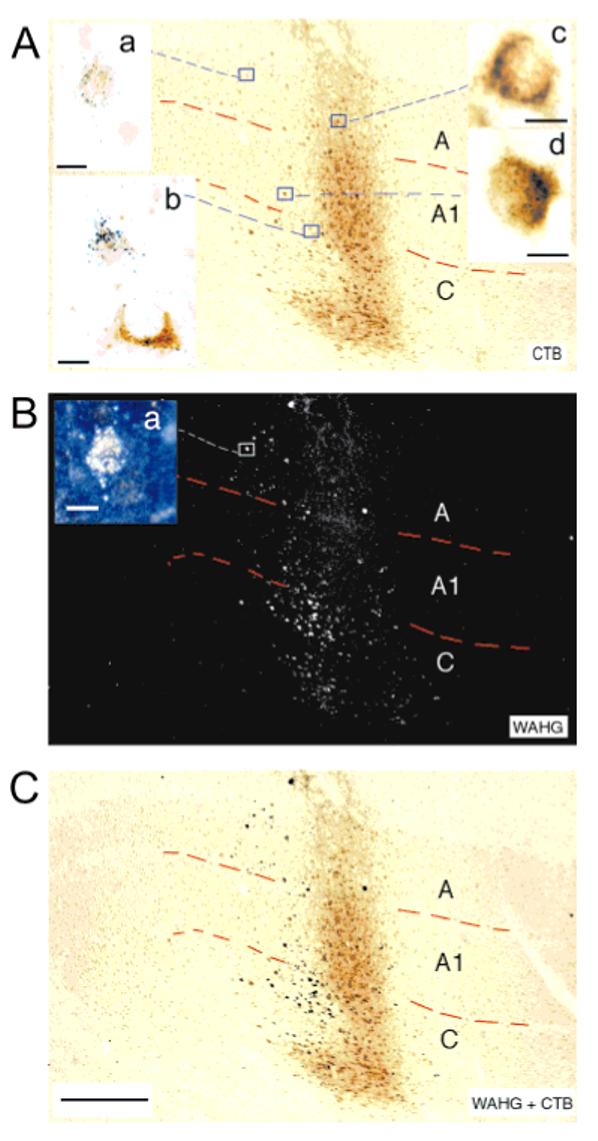
Sagittal section through the lateral geniculate nucleus of a postnatal day 16 cat (K137) viewed in brightfield for cholera toxin B (CTB) labeling (A) and in darkfield for wheat germ apo-horseradish peroxidase gold (WAHG) labeling (B). CTB was injected into ipsilateral eye patches in cortex, and WAHG was injected into contralateral patches. C: A superimposition in Photoshop of the brightfield image and the inverted darkfield image. The insets show, at high magnification, the appearance of neurons retrogradely labeled with CTB (inset c), with WAHG (insets a,b in A, a in B; insets a show the same cell in brightfield and darkfield, respectively). Double-labeled neurons are shown at high magnification in A, inset b (bottom neuron), and inset d. Scale bars = 500 μm for A-C; 10 μm for insets a-d.
Fig. 5.
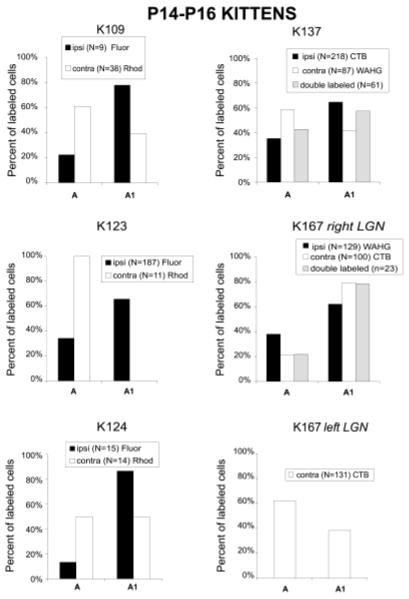
Histograms of the distribution of retrogradely labeled neurons in eye-specific lateral geniculate nucleus (LGN) laminae in postnatal day 14-16 cats. The inset within each histogram indicates the type of tracers and the intended ipsilateral (ipsi) or contralateral (contra) cortical ocular dominance (OD) domain in which the tracers were injected. The white bars represent the percentage of retrogradely labeled neurons found in laminae A and A1 when the retrograde tracer was injected into the contralateral eye OD patches. The black bars represent the percentage of neurons found in laminae A or A1 when the retrograde tracer was injected into the ipsilateral eye OD patches. Fluor, fluorescein; Rhod, rhodamine; CTB, cholera toxin B; WAHG, wheat germ apo-horseradish peroxidase gold.
In three young cats, we targeted injections of fluorescent dextrans (Fluoro Ruby and Emerald Green) into functional ocular dominance columns in the visual cortex. Retrogradely labeled cells were then identified by using a fluorescent microscope. These injections tend to be more focal than with CTB or WAHG, but they also usually resulted in many fewer retrogradely labeled neurons in the geniculate.
Cell counts of the retrogradely labeled neurons separated into groups based on the LGN lamina in which they were found reveal a consistent tendency for the targeted injections to preferentially label neurons in the appropriate LGN lamina (Fig. 5). For instance, injections targeted for the ocular dominance columns in the cortex driven relatively strongly by the contralateral eye tend to result in more neurons being retrogradely labeled in the A (contralateral eye) lamina of the LGN. This tendency was consistent in six of seven sets of injections in six hemispheres from five animals when more than 15 cells total were labeled and in 9 of 11 cases when all injections were included (P < 0.03, sign test). However, the strongest bias observed in the young animals was 66%, whereas in the adults, we repeatedly observed a much stronger bias. In one young animal (K167 right LGN), targeted injections of CTB into the contralateral eye dominated patches in the cortex actually resulted in more neurons labeled in the A1 LGN lamina. This exceptional case can be explained by the large and diffuse distribution of CTB at the injection site (Fig. 3a,d), which may have resulted in geniculocortical uptake of label by neurons from the nontargeted eye.
Indeed, the selective retrograde labeling of LGN cells depends on whether the cortical injections sites were confined to regions strongly dominated by the targeted eye (Fig. 6). The mean ocular dominance (weighted CBI, see Materials and Methods section) of the cortical injectionsites was determined by measuring the dimensions of each injection site, and then computing the degree of functional bias in the response within the boundaries of each injection. The fraction of cells retrogradely labeled in the LGN lamina corresponding to the targeted ocular dominance column is strongly correlated with the degree of response bias toward one eye shown in the functional optical response (Fig. 6). This correlation is strong and highly significant in the adult cats (Fig. 6, filled symbols, r2 = 0.79, P < 0.01), and it reveals that accurately targeted injections into the well-defined ocular dominance columns of adult cats retrogradely label neurons in the LGN in the targeted eye’s lamina. Injections that spread into regions that were only marginally biased in response toward one eye tended to result in retrogradely labeled cells in both the A and A1 lamina of the LGN. Figure 6 (open symbols) also shows that targeted injections in the young cats were not so strongly biased toward one eye as in the adults. Unlike in the adult animals, the correlation between the mean ocular dominance at the injection sites and the laminar distribution of retrogradely labeled cells in the LGN was not significant (r2 = 0.129, P = 0.4), and the difference between the slopes of the linear regression for adults and kittens was significant (P < 0.05). This finding was not due to any difference in the size of the injections in the young and old cats (P > 0.9) but is instead the result of intrinsically weak functional ocular dominance columns in the young cats.
Fig. 6.
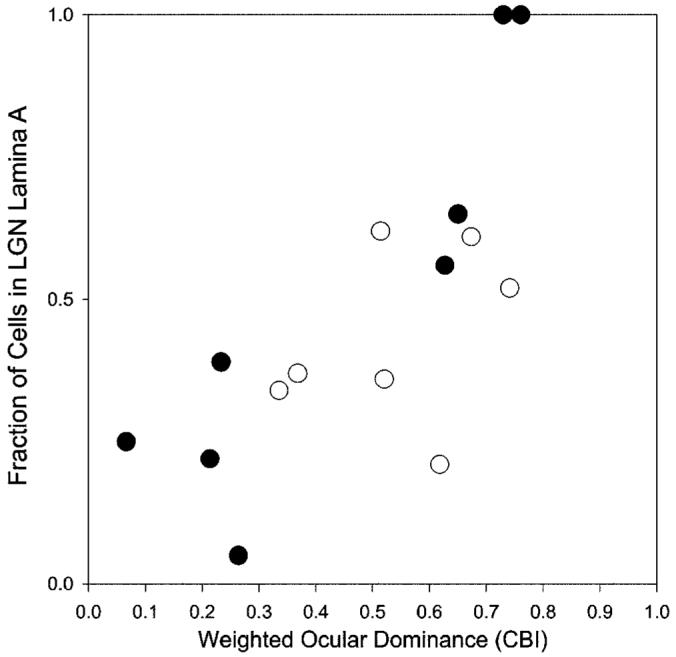
Relationship between ocular dominance at the injection site and the fraction of retrogradely labeled neurons located in lamina A in adult cats (P > 77, filled circles) and kittens (postnatal day 14 [P14]-16, open circles). Ocular dominance was measured from intrinsic signals images by the weighted CBI (see Materials and Methods section). Note that extreme values of afferent segregation were found in adults. LGN, lateral geniculate nucleus; CBI, Contralateral Bias Index.
Transneuronal label of flattened visual cortex
We also used a complementary anterograde technique, transneuronal labeling after tritiated proline injection into the eye, to chart the development of ocular dominance columns in the visual cortex of young cats. These experiments are similar to those previously reported (LeVay et al., 1978), but we studied some animals at earlier ages. In addition, we injected radioactive tracers of higher specific activity and examined sections tangential to the cortical surface to better visualize patterns of labeling. Young cats injected with [3H]proline at P2 and processed for autoradiography 5 days later (P7, see Fig. 7) showed that label carried to the LGN by retinal ganglion cell afferents was already separated into laminae serving each eye (Fig. 7A,B), as expected (Sretavan and Shatz, 1986). Overall, the LGN contralateral to the injected eye was more intensely labeled by [3H]proline. This imbalance was observed in all six animals. It was also reflected in the cortex by stronger autoradiographic signal in the hemisphere contralateral to the injected eye.
Fig. 7.
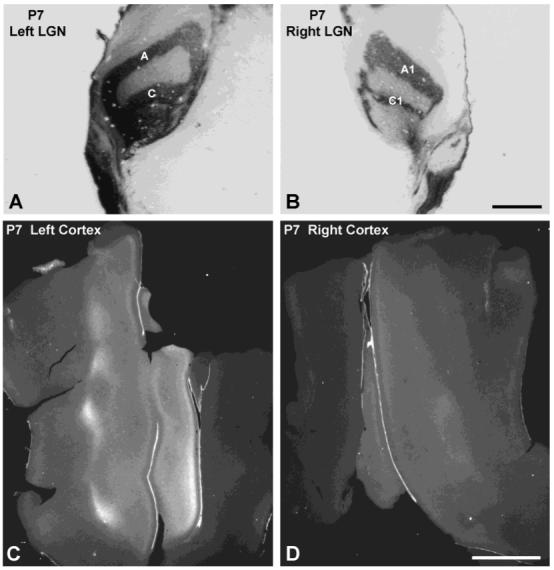
Postnatal day 7 (P7) cat. A,B: Autoradiographs of coronal lateral geniculate nucleus (LGN) sections viewed with brightfield microscopy, showing dark label concentrated in appropriate laminae after [3H]proline injection into the right eye. C,D: Autoradiographs of single, flatmounted sections of visual cortex, viewed with darkfield microscopy, showing label in layer IV. The label, which appears bright in darkfield, was stronger in the left cortex. There were no columns apparent in either hemisphere, although the LGN laminae were distinct at this age. Scale bars = 1 mm in A,B; 5 mm in C,D.
Autoradiographs of transneuronally labeled geniculocortical afferents in layer IV of the cortex at P7 showed no obvious eye-specific patterning in either hemisphere, but labeling was quite weak (Fig. 7C,D). Autoradiographs of the cortex ipsilateral (right) to the injected eye appeared fainter than in the contralateral (left) cortex (compare Fig. 7C and D). Therefore, at this age retinogeniculate afferents selectively innervated eye specific lamina in the LGN, but patterning of geniculocortical afferents could not be detected in the cortex.
Autoradiographs of geniculocortical afferents in cats 2 weeks of age (P14-P15) showed stronger label than at P7. The cortex ipsilateral to the injected eye showed distinct patterning in layer IV (Fig. 8D). The pattern appeared as an irregular mosaic of gaps in a sheet of label filling layer IV. The appearance of this columnar pattern (indicated by the drawing in the inset, average periodicity = 800 μm) was consistent with the functional ocular dominance columns observed in animals at the same age (Fig. 1B and Crair et al., 1998) and the anatomic ocular dominance columns observed in older animals (Fig. 8, LeVay et al., 1978). Similar patterns were visible in all three animals studied at this age (P14, P15, P15). Nascent ocular dominance columns were also observed in the contralateral (left) cortex, but they could not be captured adequately in photographs (Fig. 8C). By P21, cortical autoradiographs show distinct patterning in both hemispheres (Fig. 9, LeVay et al., 1978), but they were more distinct in the (right) hemisphere ipsilateral to the injected eye.
Fig. 8.
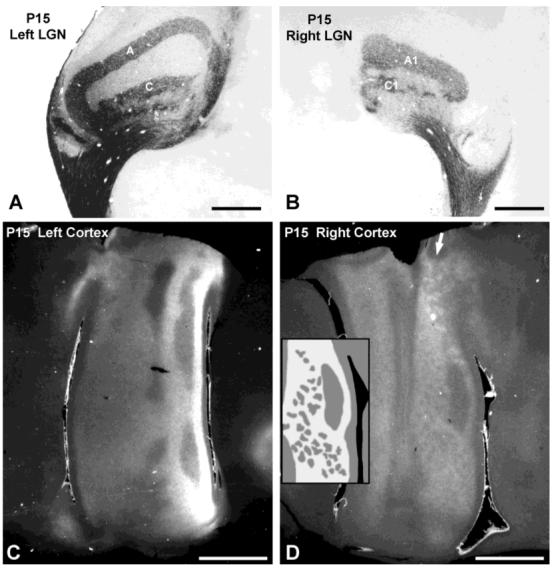
Postnatal day 15 (P15) cat. A,B: Autoradiographs showing mature pattern of lamina specific label in lateral geniculate nucleus (LGN). C,D: In the contralateral (left) cortex, the ocular dominance columns are visible but difficult to illustrate. In the ipsilateral (right) cortex, they are much clearer. Areas of bright label in (D) represent zones receiving input from the ipsilateral eye; regions of darker label receive input predominately from the contralateral eye. Arrow indicates coarser columns in area 18. Inset in D is a drawing of the ocular dominance columns in the portion of area 17 immediately to the right; scale is the same as the photograph. Scale bars = 1 mm in A,B; 5 mm in C,D.
Fig. 9.
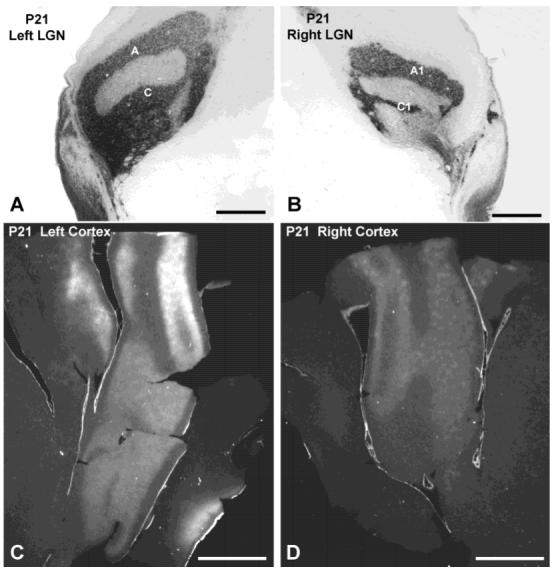
Postnatal day 21 (P21) cat. A,B: Lateral geniculate nucleus (LGN) autoradiographs. C,D: Columns are visible in both hemispheres, although they are more distinct on the ipsilateral (right) side. Scale bars = 1 mm in A,B; 5 mm in C,D.
DISCUSSION
The experiments reported here were aimed at determining whether the emergence of ocular dominance columns in the visual cortex observed with single unit and optical imaging studies in 2-week-old cats (Crair et al., 1998) had an anatomic counterpart in the pattern of termination of geniculocortical afferents. Earlier studies failed to disclose fluctuations in the density of transneuronal label in cross-sections of layer IV after an injection into one eye like those observed in animals 3 weeks of age and older (LeVay et al., 1978). This finding led to the conclusion that ocular dominance columns are not yet formed at 2 weeks of age. In the present experiments, injections of retrograde label targeted to sites of functional eye dominance, defined from intrinsic signal optical imaging, preferentially labeled geniculate cells in the corresponding eye-specific lamina at the end of the second week of life. In addition, when transneuronal label after an eye injection was evaluated with greater sensitivity by using flattened sections through layer IV, a weak ocular dominance pattern was also observed at 2 weeks of age but not at 1 week of age. These anatomic findings are in harmony with conclusions from optical imaging that ocular dominance columns in the cat emerge during the second week of life (Crair et al., 1998).
Evidence that ocular dominance columns exist at 2 weeks of age
Four lines of evidence support the conclusion that cortical ocular dominance columns are present by the end of the second week. First, transneuronal label discloses a periodic pattern that is unmistakable, although fainter than that seen in older animals. Although it is easy to imagine artifacts or procedures that would interfere with the detection of such patterns, their presence in the flattened sections provides strong evidence of a genuinely fluctuating pattern of innervation. A strong bias toward the contralateral projection was also evident, as it is at early stages in the ferret (Ruthazer et al., 1999). Second, optical imaging around P14 discloses a pattern of eye dominance consistent with the appearance of the transneuronal label; and third, both the fluctuations in eye dominance in the optical maps and the overall contralateral bias were confirmed by microelectrode recordings (Crair et al., 1998). Finally, most geniculocortical neurons labeled by retrograde tracer injections into cortical eye dominance patches identified in the optical imaging maps are located in the appropriate geniculate lamina. Although the last three of these lines of evidence are tied together by the optical imaging, the transneuronal labeling is a completely independent observation.
Because the optical images reflect activity in the superficial layers with probable but uncertain contributions from layer IV and below, targeting anatomic tracers into layer IV in young animals on the basis of optical imaging relies on the assumption that cortical activity is organized in a columnar manner.
Evidence that ocular dominance columns at 2 weeks of age are less distinct than later
Although the evidence above establishes that the ocular dominance pattern in cat visual cortex exists by 2 weeks of age, this pattern is less distinct than in older animals. Physiologically and in optical imaging experiments, the contralateral eye drives the cortex strongly almost everywhere, and ipsilateral eye responses are very weak except in restricted areas, where they approach or sometimes exceed the contralateral eye responses (Crair et al., 1998). The transneuronal labeling shown above also reflects this strong contralateral bias. Deoxyglucose experiments also reveal profound maturation of ocular dominance columns between 3 and 4 weeks of age (Rathjen and Löwel, 2000).
The cortical arbors of single geniculocortical afferents (P19: Antonini and Stryker, 1993b; P7: Ghosh and Shatz, 1992) are not informative either about the segregation of ocular dominance patches or about the overall contralateral bias. They differ from those in older animals in that they are not patchy, and appear very sparse at this age, consistent with both the weak transneuronal signal and the smaller numbers of retrogradely labeled geniculocortical neurons. Indeed, the afferents are still sparse at P19 and P23 (Antonini and Stryker, 1993b), ages at which even earlier transneuronal studies had showed a periodic ocular dominance pattern (LeVay et al., 1978), demonstrating that a collection of sparse arbors can form ocular dominance patches if those from the same eye overlap densely in layer IV. Anterograde labeling of collections of arbors could, thus, reveal an ocular dominance pattern that would not be evident from looking at individual arbors (Crowley and Katz, 1999). Both the sparse arbors and the contralateral bias would contribute to an indistinct appearance of the cortical ocular dominance pattern even if the afferents were more segregated. However, both of these features do genuinely change over the following 2-3 weeks, and their reorganization is concomitant with the strengthening of the ocular dominance pattern (LeVay et al., 1978; Antonini and Stryker, 1993b; Crair et al., 1998), suggesting that the pattern seen at P14 represents the emergent stages of ocular dominance column formation.
Evidence that ocular dominance columns have not yet formed at 1 week of age
The transneuronal labeling shows no clear sign of a cortical ocular dominance pattern at P7, despite the sharp laminar segregation of label in the LGN. Some of the uniformity in cortical labeling could be artifactual, due to spillover of label into cells that serve the uninjected eye within the LGN (LeVay et al., 1978). However, if afferents serving the two eyes really arborized into separate cortical patches at this age, flattened sections should detect this pattern, even if it were relatively indistinct. In one animal studied at P8 by using optical imaging, there was also no sign of a cortical ocular dominance pattern (Crair et al., 1998). That these images showed a strong contralateral-eye bias suggests that the lack of an ocular dominance pattern is not merely due to a lack of responsiveness but is instead further evidence of a spatially uniform distribution of responses to the two eyes.
We did not pursue retrograde labeling experiments at P7, because the injections could not be targeted on the basis of optical imaging. Moreover, even with a large number of experiments using randomly placed injections, consistent retrograde labeling of mixed cells in the LGN would not be strong evidence of overlapping geniculocortical projections because of the possibility of greater diffusion of label from the injection site in the youngest animals.
Timing of ocular dominance column development relative to other visual development events
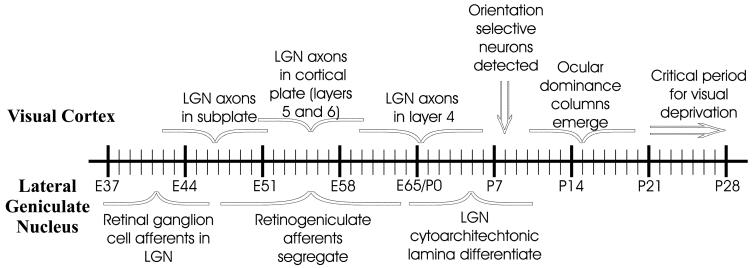
At birth in the cat (Fig. 10), retinogeniculate axons have already formed laminar specific connections, and LGN cytoarchitectonic laminae are just becoming distinguishable (Kalil, 1978; Shatz, 1983). By P7, the cytoarchitectonic laminae in the LGN are well defined. Geniculocortical axons, which began invading the cortical plate around embryonic day 50 (E50), reach layer IV of the visual cortex shortly before birth, and begin to ramify by P7 (Shatz and Luskin, 1986; Ghosh and Shatz, 1992). A small fraction of cortical cells (10%) have orientation specific responses at P7 as well (Hubel and Wiesel, 1962; Albus and Wolf, 1984). By P14, as shown here, ocular dominance columns emerge both functionally and anatomically, and a clear pattern of orientation maps that matches between the eyes is apparent (Crair et al., 1998). The formation of ocular dominance columns in the cat, thus, takes place approximately 2 weeks after the innervation of layer IV and only a week later than the emergence of orientation selectivity. Similar findings have been reported in the ferret (Chapman et al., 1996; Ruthazer et al., 1999).
Fig. 10.
Cat visual development time line. Major events in the development of visual cortex (top) and the lateral geniculate nucleus (LGN) (bottom). References for visual cortex development: Shatz and Luskin, 1986; Ghosh and Shatz, 1992; Hubel and Wiesel, 1962, 1970; Albus and Wolf, 1984; Crair et al., 1998; Olson and Freeman, 1980. References for LGN development: Kalil, 1978; Shatz, 1983.
The early formation of ocular dominance columns, by P14, takes place at a time when visual deprivation is ineffective. Indeed, the critical period of susceptibility to the effects of monocular deprivation begins around P21 in the cat (Hubel and Wiesel, 1970; Olson and Freeman, 1980), at least a week later. Effects of binocular deprivation from birth are similarly not evident before P21 (Crair et al., 1998). The early formation of ocular dominance columns also means that some experiments intended to probe the initial development of ocular dominance columns were conducted after columns had already appeared in the cortex. For example, infusion of trophic factors into visual cortex has been reported to prevent the formation of ocular dominance columns (Cabelli et al., 1995, 1997). Because the columns were present when the experiment began, the addition of trophic factors must have caused their disappearance, rather than prevented their appearance.
Models for ocular dominance column development
Ocular dominance columns in layer IV of the visual cortex are classically viewed as emerging from the segregation of completely overlapping geniculocortical afferents serving the two eyes by means of an activity-dependent, competitive process. Alternative models for OD column development propose that molecular markers laid out in the cortex before the ingrowth of afferents determine the eventual pattern of ocular dominance columns, without the guidance of an activity-dependent mechanism. Much of the evidence for the classic model of ocular dominance column development comes from anatomic studies of the projection pattern of geniculocortical afferents labeled transneuronally after injection of tracer into one eye (LeVay et al., 1978). The present results can be seen as in broad agreement with this general picture, but suggest two important qualifications. First, the onset of afferent segregation occurs at least a week earlier in development than previously thought, an age at which geniculocortical afferents are still very sparse. Thus, segregation occurs between groups of still sparse but actively ramifying afferents from the two eyes. Second, the characteristic adult pattern of alternating left and right eye dominance in the cortex emerges from an initial state in which the contralateral eye predominates.
There are several further lines of evidence that indicate ocular dominance column development and plasticity are activity-dependent (Stryker and Harris, 1986) and similar in several species, although the age at which it begins may vary (LeVay et al., 1978, 1980; Horton and Hocking, 1996; Issa et al., 1999; Ruthazer et al., 1999). First, ocular dominance columns are not visible at P42 after binocular injections of TTX starting between P12-P16, but are evident if the TTX is started after that time (Stryker and Harris, 1986). Second, monocular deprivation during a critical period in early life shrinks the deprived-eye columns and allows those of the open eye to expand. The shrinkage of deprived columns is associated with a rapid and saturating loss of approximately half the branches of deprived geniculocortical arbors (Antonini and Stryker, 1993a) and is dependent on the pattern of presynaptic and postsynaptic activity (Hata et al., 1999). Finally, the requirement for patterned neural activity in the refinement of cortical connections during the critical period is also demonstrated by the loss of orientation selectivity in cortical neurons when animals are binocularly deprived throughout this time of life (Crair et al., 1998) or its disruption after chronic electrical stimulation (Weliky and Katz, 1997). Many of the experiments that favor an activity-dependent competitive model for ocular dominance column plasticity were started after OD columns have already begun to emerge, as documented in this study, and have, therefore, not directly tested mechanisms for their initial development.
Before the emergence of clear OD columns, the cortex is strongly biased toward the contralateral eye. The transition from overall contralateral dominance to an almost equal partition of the cortex between the two eyes poses some difficulty for a purely Hebbian, activity-dependent process of OD column segregation (Crair et al., 1998). It is possible that thalamocortical inputs to layers outside IV are dominated by the contralateral eye and contribute more to the responses of cortical cells in early life than later. Thus, their decline (or a relative increase in the amount or efficacy of A1-lamina inputs to layer IV) may help drive this equalization process. Consistent with this notion is the much greater retrograde labeling of the C-laminae relative to the A-laminae at 2 weeks of age than in adult animals, although this could also be attributed to possible greater spread of the injection site into the upper layers in young animals, where the cortex is thinner.
The onset of the critical periods for the effects of monocular or binocular visual deprivation at least a week after the emergence of ocular dominance columns poses a problem if one wants to explain the segregation of ocular dominance columns by activity-dependent competition. If such competition exists when the ocular dominance columns are forming, why does visual deprivation at that time not also have an effect? Weliky and Katz (1999) have shown that geniculate activity in unanesthetized young animals is determined very much more strongly by descending corticogeniculate input than by input from the retina. Therefore, it is possible that the spontaneous and cortically driven activity in the geniculocortical circuit is sufficient to form ocular dominance columns by the same activity-dependent competitive mechanisms that later in life will mediate the effects of visual deprivation. The much weaker visually driven activity at the age when the ocular dominance columns are initially forming would not reach the threshold for plasticity, leaving visual deprivation ineffective. Following this hypothesis, visual responses would not become strong enough to induce activity-dependent plasticity until P21. Alternatively, the initial contralateral bias and the emergence of ocular dominance columns before the onset of the critical period may suggest that the mechanisms for the initial formation of ocular dominance columns and their plasticity are, at least partially, distinct.
Several aspects of central visual system development are clearly guided by factors other than activity. These include the segregation of retinal input to magnocellular and parvocellular geniculate layers in the monkey (Meissirel et al., 1997), as well as the laminar specificity of geniculocortical connections (Bolz et al., 1992). Intriguing findings in the ferret have led Crowley and Katz (1999) to propose that the pattern of ocular dominance columns is laid out in the cortex by molecular markers before the ingrowth of afferents. In their experiments, ferrets were binocularly enucleated during the first week of life, and thalamocortical projections were studied with both retrograde and anterograde labeling after 2 months of age. Despite the shrinkage of the LGN and the potential disruption of its normal activity as a result of the destruction of its retinal input, the thalamocortical projection was organized in patches that were interpreted as ocular dominance columns. However, binocular enucleation does not eliminate activity in geniculocortical afferents, as shown by the difference between the effects of enucleation and cortical activity blockade (Ruthazer and Stryker, 1996). Direct recordings after enucleation have also shown a preservation of a correlation structure in the discharge of geniculate cells (Weliky and Katz, 1999) that would favor the association of afferents serving the same eye onto common cortical targets (Miller et al., 1989). Hence, the findings of Crowley and Katz (1999) are still compatible with an activity-dependent view of geniculocortical afferent segregation.
Finally, the activity-dependent segregation of initially overlapping inputs serving the two eyes seems to be found even in systems in which the overlap is experimentally induced, such as the retinotectal projection of the goldfish or frog (Law and Constantine-Paton, 1981; Schmidt and Tieman, 1985). It is unlikely that molecular markers of the ocular dominance patches of the frog tectum would have evolved, given its innervation by only one eye outside the laboratory.
ACKNOWLEDGMENTS
We thank Davina R. Hocking for invaluable assistance with the autoradiographic studies, Dr. Naoum Issa for writing the program for measuring local ocular dominance at the injection sites, Dr. Deda Gillespie for help in some of the pilot experiments, and D. Larue for providing one batch of WAHG. M.P.S. and J.C.H. received grants from the NIH, and M.C.C. received Sloan, Merck, and Klingenstein fellowships.
Grant sponsor: National Institutes of Health; Grant numbers: EY02874 and EY10217.
Footnotes
Note Added in Proof: Since this manuscript was accepted in final form, a similar report (Crowley and Katz, 2000, Science 290:1321-1324) has appeared showing that ocular dominance colums emerge in ferrets by postnatal day 16-18, a week after initial geniculocortical afferent innervation of layer IV. These results are consistent with the mechanisms discussed in this paper, although we find that ocular dominance colums form later in the cat, between 1 and 2 weeks after the afferents reach layer IV.
LITERATURE CITED
- Albus K, Wolf W. Early post-natal development of neuronal function in the kitten’s visual cortex: a laminar analysis. J Physiol (Lond) 1984;348:153–185. doi: 10.1113/jphysiol.1984.sp015104. [DOI] [PMC free article] [PubMed] [Google Scholar]
- Antonini A, Stryker MP. Rapid remodeling of axonal arbors in the visual cortex. Science. 1993a;260:1819–1821. doi: 10.1126/science.8511592. [DOI] [PubMed] [Google Scholar]
- Antonini A, Stryker MP. Development of individual geniculocortical arbors in cat striate cortex and effects of binocular impulse blockade. J Neurosci. 1993b;13:3549–3573. doi: 10.1523/JNEUROSCI.13-08-03549.1993. [DOI] [PMC free article] [PubMed] [Google Scholar]
- Basbaum AI, Menetrey D. Wheat germ agglutinin-apoHRP gold: a new retrograde tracer for light- and electron-microscopic single- and double-label studies. J Comp Neurol. 1986;261:306–318. doi: 10.1002/cne.902610211. [DOI] [PubMed] [Google Scholar]
- Bolz J, Novak N, Staiger V. Formation of specific afferent connections in organotypic slice cultures from rat visual cortex cocultured with lateral geniculate nucleus. J Neurosci. 1992;12:3054–3070. doi: 10.1523/JNEUROSCI.12-08-03054.1992. [DOI] [PMC free article] [PubMed] [Google Scholar]
- Cabelli RJ, Hohn A, Shatz CJ. Inhibition of ocular dominance column formation by BDNF. Science. 1995;267:1662–1666. doi: 10.1126/science.7886458. [DOI] [PubMed] [Google Scholar]
- Cabelli RJ, Shelton DL, Segal RA, Shatz CJ. Blockade of endogenous ligands of trkB inhibits formation of ocular dominance columns. Neuron. 1997;19:63–76. doi: 10.1016/s0896-6273(00)80348-7. [DOI] [PubMed] [Google Scholar]
- Chapman B, Stryker MP, Bonhoeffer T. Development of orientation preference maps in ferret primary visual cortex. J Neurosci. 1996;16:6443–6453. doi: 10.1523/JNEUROSCI.16-20-06443.1996. [DOI] [PMC free article] [PubMed] [Google Scholar]
- Crair MC, Ruthazer ES, Gillespie DC, Stryker MP. Relationship between the ocular dominance and orientation maps in visual cortex of monocularly deprived cats. Neuron. 1997;9:307–318. doi: 10.1016/s0896-6273(00)80941-1. [DOI] [PubMed] [Google Scholar]
- Crair MC, Gillespie DC, Stryker MP. The role of visual experience in the development of columns in cat visual cortex. Science. 1998;279:566–570. doi: 10.1126/science.279.5350.566. [DOI] [PMC free article] [PubMed] [Google Scholar]
- Crowley JC, Katz LC. Development of ocular dominance columns in the absence of retinal input. Nat Neurosci. 1999;2:1125–1130. doi: 10.1038/16051. [DOI] [PubMed] [Google Scholar]
- Ghosh A, Shatz CJ. Pathfinding and target selection by developing geniculocortical axons. J Neurosci. 1992;12:39–55. doi: 10.1523/JNEUROSCI.12-01-00039.1992. [DOI] [PMC free article] [PubMed] [Google Scholar]
- Hata Y, Tsumoto T, Stryker MP. Selective pruning of more active afferents when cat visual cortex is pharmacologically inhibited. Neuron. 1999;22:375–381. doi: 10.1016/s0896-6273(00)81097-1. [DOI] [PubMed] [Google Scholar]
- Horton JC, Hocking DR. An adult-like pattern of ocular dominance columns in striate cortex of newborn monkeys prior to visual experience. J Neurosci. 1996;16:1791–1807. doi: 10.1523/JNEUROSCI.16-05-01791.1996. [DOI] [PMC free article] [PubMed] [Google Scholar]
- Hubel DH, Wiesel TN. Receptive fields, binocular interactions, and functional architecture in the cat’s visual cortex. J Physiol (Lond) 1962;160:106–154. doi: 10.1113/jphysiol.1962.sp006837. [DOI] [PMC free article] [PubMed] [Google Scholar]
- Hubel DH, Wiesel TN. The period of susceptibility to the physiological effects of unilateral eye closure in kittens. J Physiol (Lond) 1970;206:419–436. doi: 10.1113/jphysiol.1970.sp009022. [DOI] [PMC free article] [PubMed] [Google Scholar]
- Issa NP, Trachtenberg JT, Chapman B, Zahs KR, Stryker MP. The critical period for ocular dominance plasticity in the ferret’s visual cortex. J Neurosci. 1999;19:6965–6978. doi: 10.1523/JNEUROSCI.19-16-06965.1999. [DOI] [PMC free article] [PubMed] [Google Scholar]
- Kalil R. Development of the dorsal lateral geniculate nucleus in the cat. J Comp Neurol. 1978;182:265–291. doi: 10.1002/cne.901820206. [DOI] [PubMed] [Google Scholar]
- Law MI, Constantine-Paton M. Anatomy and physiology of experimentally produced striped tecta. J Neurosci. 1981;1:741–759. doi: 10.1523/JNEUROSCI.01-07-00741.1981. [DOI] [PMC free article] [PubMed] [Google Scholar]
- LeVay S, Stryker MP, Shatz CJ. Ocular dominance columns and their development in layer IV of the cat’s visual cortex: a quantitative study. J Comp Neurol. 1978;179:223–244. doi: 10.1002/cne.901790113. [DOI] [PubMed] [Google Scholar]
- LeVay S, Wiesel TN, Hubel DH. The development of ocular dominance columns in normal and visually deprived monkeys. J Comp Neurol. 1980;19:1–51. doi: 10.1002/cne.901910102. [DOI] [PubMed] [Google Scholar]
- Meissirel C, Wikler KC, Chalupa LM, Rakic P. Early divergence of magnocellular and parvocellular functional subsystems in the embryonic primate visual system. Proc Natl Acad Sci USA. 1997;94:5900–5905. doi: 10.1073/pnas.94.11.5900. [DOI] [PMC free article] [PubMed] [Google Scholar]
- Miller KD, Keller JB, Stryker MP. Ocular dominance column development: analysis and simulation. Science. 1989;245:605–615. doi: 10.1126/science.2762813. [DOI] [PubMed] [Google Scholar]
- Olavarria J, Van Sluyters RC. Unfolding and flattening the cortex of gyrencephalic brains. J Neurosci Methods. 1985;15:191–202. doi: 10.1016/0165-0270(85)90098-6. [DOI] [PubMed] [Google Scholar]
- Olson CR, Freeman RD. Profile of the sensitive period for monocular deprivation in kittens. Exp Brain Res. 1980;39:17–21. doi: 10.1007/BF00237065. [DOI] [PubMed] [Google Scholar]
- Passera A, Fulks S, Schneider GE, Ayres S, Jhaveri S, Erzurumlu RS. The M.I.T. “Neurotrace” system for microcomputer-aided microscopy. Soc Neurosci Abstr. 1988;14:550. [Google Scholar]
- Rakic P. Prenatal genesis of connections subserving ocular dominance in the rhesus monkey. Nature. 1976;261:467–471. doi: 10.1038/261467a0. [DOI] [PubMed] [Google Scholar]
- Rakic P. Development of visual centers in the primate brain depends on binocular competition before birth. Science. 1981;214:928–931. doi: 10.1126/science.7302569. [DOI] [PubMed] [Google Scholar]
- Rathjen S, Lölwel S. Early postnatal development of functional ocular dominance columns in cat primary visual cortex. Neuroreport. 2000;11:2363–2367. doi: 10.1097/00001756-200008030-00006. [DOI] [PubMed] [Google Scholar]
- Ruthazer ES, Baker GE, Stryker MP. Development and organization of ocular dominance bands in primary visual cortex of the sable ferret. J Comp Neurol. 1999;407:151–165. [PMC free article] [PubMed] [Google Scholar]
- Ruthazer ES, Stryker MP. The role of activity in the development of long-range horizontal connections in area 17 of the ferret. J Neurosci. 1996;16:7253–7269. doi: 10.1523/JNEUROSCI.16-22-07253.1996. [DOI] [PMC free article] [PubMed] [Google Scholar]
- Shatz CJ. The prenatal development of the cat’s retinogeniculate pathway. J Neurosci. 1983;3:482–499. doi: 10.1523/JNEUROSCI.03-03-00482.1983. [DOI] [PMC free article] [PubMed] [Google Scholar]
- Shatz CJ, Luskin MB. The relationship between the geniculocortical afferents and their cortical target cells during development of the cat’s primary visual cortex. J Neurosci. 1986;6:3655–3668. doi: 10.1523/JNEUROSCI.06-12-03655.1986. [DOI] [PMC free article] [PubMed] [Google Scholar]
- Schmidt JT, Tieman SB. Eye-specific segregation of optic afferents in mammals, fish, and frogs: the role of activity. Cell Mol Neurobiol. 1985;5:5–34. doi: 10.1007/BF00711083. [DOI] [PMC free article] [PubMed] [Google Scholar]
- Sretavan DW, Shatz CJ. Prenatal development of retinal ganglion cell axons: segregation into eye-specific layers within the cat’s lateral geniculate nucleus. J Neurosci. 1986;6:234–251. doi: 10.1523/JNEUROSCI.06-01-00234.1986. [DOI] [PMC free article] [PubMed] [Google Scholar]
- Stryker MP, Harris WA. Binocular impulse blockade prevents the formation of ocular dominance columns in cat visual cortex. J Neurosci. 1986;6:2117–2133. doi: 10.1523/JNEUROSCI.06-08-02117.1986. [DOI] [PMC free article] [PubMed] [Google Scholar]
- Trachtenberg JT, Trepel C, Stryker MP. Rapid extragranular plasticity in the absence of thalamocortical plasticity in the developing primary visual cortex. Science. 2000;287:2029–2032. doi: 10.1126/science.287.5460.2029. [DOI] [PMC free article] [PubMed] [Google Scholar]
- Weliky M, Katz LC. Disruption of orientation tuning in visual cortex by artificially correlated neuronal activity. Nature. 1997;386:680–685. doi: 10.1038/386680a0. [DOI] [PubMed] [Google Scholar]
- Weliky M, Katz LC. Correlational structure of spontaneous neuronal activity in the developing lateral geniculate nucleus in vivo. Science. 1999;285:599–604. doi: 10.1126/science.285.5427.599. [DOI] [PubMed] [Google Scholar]
- Wiesel TN, Hubel DH. Comparison of the effects of unilateral and bilateral eye closure on cortical unit responses in kittens. J Neurophysiol. 1965;28:1029–1040. doi: 10.1152/jn.1965.28.6.1029. [DOI] [PubMed] [Google Scholar]
- Wiesel TN, Hubel DH, Lam DM. Autoradiographic demonstration of ocular-dominance columns in the monkey striate cortex by means of transneuronal transport. Brain Res. 1974;79:273–279. doi: 10.1016/0006-8993(74)90416-8. [DOI] [PubMed] [Google Scholar]


