

Abstract
This study aimed to identify neural mechanisms that underlie perceptual learning on a visual discrimination task. We trained two monkeys to decide the direction of visual motion while recording from the middle temporal area (MT), which in trained monkeys represents motion information used to solve the task, and the lateral intraparietal area (LIP), which in trained monkeys represents the transformation of motion information into a saccadic choice. During training, improved behavioural sensitivity to weak motion signals was accompanied by changes in motion-driven responses of neurons in LIP but not MT. The time course and magnitude of the changes in LIP were correlated with the changes in behavioural sensitivity throughout training. Thus, for this task, perceptual learning appears to involve improvements not in how sensory information is represented in the brain but rather how the sensory representation is interpreted to form the decision that guides behaviour.
Training can induce long-lasting improvements in our ability to detect, discriminate or identify sensory stimuli1. Despite the prevalence of this phenomenon, called perceptual learning, our understanding of the underlying neural plasticity is incomplete. Changes in early sensory areas of cortex have been inferred from psychophysical studies2 (but see refs 3, 4) and identified in monkeys trained on auditory5 and somatosensory6 tasks. However, monkeys trained on visual tasks show only moderate or no change in early visual cortex7–11. Changes in higher stages of processing, including those that contribute to decision-making and attention, have also been inferred from psychophysical studies3, 4, 8, 12–14. However, such changes have not been identified directly in the brain. We sought to identify experience-dependent changes in visual processing in two different cortical areas, one in extrastriate visual cortex and the other in parietal cortex, and determine their relative contributions to perceptual learning.
We trained monkeys to decide the direction of motion of a random-dot stimulus and indicate their direction decision with an eye movement. Most neurons in the middle temporal area (MT) of extrastriate visual cortex are tuned for the location and direction of moving visual stimuli15. In trained monkeys, MT responses can be as sensitive to random-dot motion signals as the monkey’s behavioural reports and are weakly predictive of the monkey’s choices on the discrimination task16, 17. Moreover, MT lesions degrade performance18, and MT microstimulation biases performance on the task19. Thus, MT provides at least some of the motion information used to form the direction decision.
Neurons in the lateral intraparietal area (LIP) of parietal cortex, which has been implicated in a variety of cognitive and visuomotor functions, including attention, intention, reward anticipation and decision-making20–23, also respond during performance of the discrimination task. These responses are modulated by the strength and duration of the motion stimulus and can be strongly predictive of the monkey’s saccadic choices24, 25. LIP microstimulation can bias performance on a reaction-time version of the task26. Thus, LIP appears to play a role in transforming motion information into a saccadic choice, although that role might be shared among several oculomotor regions including the frontal eye field and superior colliculus that show similar responses during task performance27, 28.
We recorded the activity of individual MT and LIP neurons while two naïve monkeys were trained on the direction-discrimination task. Behavioural sensitivity to weak motion signals improved continuously during training, long after monkeys had acquired the stimulus/response association. This improvement in behavioural sensitivity corresponded to changes in the responses of neurons in LIP but not MT during motion viewing. The results are consistent with a model in which perceptual improvements result from changes in how sensory evidence is interpreted and used to instruct behaviour, as reflected in LIP, but not in changes to the representation of the evidence itself in MT.
Results
Discrimination threshold improves with training
We trained two rhesus monkeys on a one-interval, two-alternative direction-discrimination task (Fig. 1a; monkey C: 165 sessions over 645 d; monkey Z: 155 sessions over 473 d). Each daily training session began by introducing recording electrodes into MT and/or LIP (Fig. 1b). As in previous studies, quantifying the relationship between behavioural and neuronal performance depended on matching the visual stimulus to the properties of the neuron(s) being recorded16, 25. Within this constraint, we sought to minimize changes in the stimulus configuration across sessions by selecting neurons with consistent tuning properties, including receptive field (RF) location and direction preference of MT neurons and response field location of LIP neurons (Fig. S1). After finding the appropriate neuron(s), we placed the motion stimulus in the MT RF (or in its modal location if no MT neuron was found) and one of the two choice targets in the LIP response field (or in its modal location if no LIP neuron was found). Training occurred only while the responses of at least one MT or LIP neuron were isolated and recorded, allowing us to make direct, session-by-session comparisons of behavioural and neuronal performance as training progressed.
Figure 1.
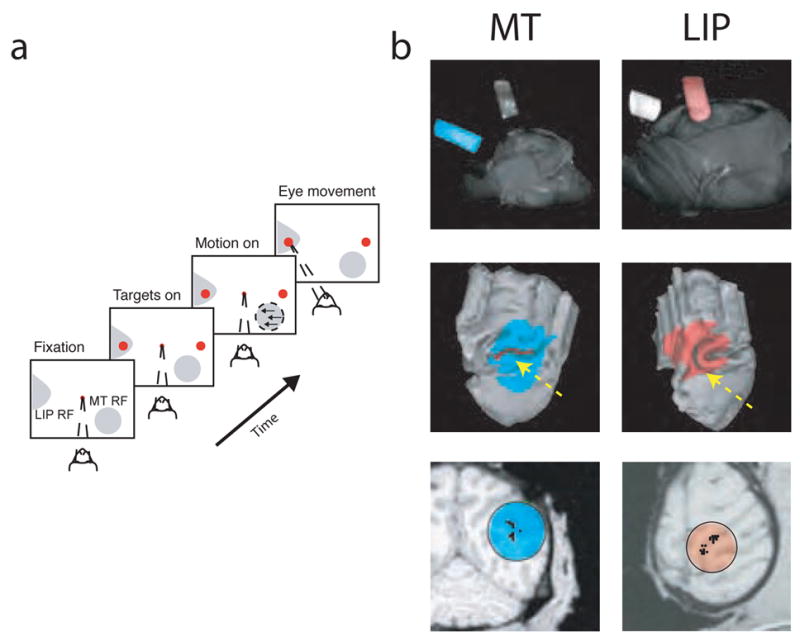
Task and anatomical localization. a, Direction-discrimination task. The motion stimulus matched the RF location and preferred direction (and its 180° opposite) of the MT neuron being recorded or the modal values from previous sessions if no MT neuron was found. One target was placed in the response field of the LIP neuron being recorded or the modal location from previous sessions if no LIP neuron was found, the other in the opposite visual hemifield. b, Anatomical localization of recording site locations in areas MT (left, cyan) and LIP (right, red) using magnetic resonance imaging (MRI). Top: volume rendering using the AFNI49 render plugin showing the 3D orientation of the recording cylinders relative to the head. Middle: partial reconstruction of the cortical surface along with the projection of the recording cylinder using Caret and SureFit50 and custom software. The yellow arrow in the left panel points to the location of area MT (red), along the superior temporal sulcus. The yellow arrow in the right panel points to the location of area LIP (brown), along the intraparietal sulcus. Bottom: partial penetration maps of successful recording sites (black points) superimposed on planes of section perpendicular to the long axis of the recording cylinder. MT sites (top) ranged in depth from 6–9 mm from the dura mater. LIP sites (bottom) ranged in depth from 4–7 mm from the dura mater. These images were generated with methods described in R.M. Kalwani, L. Bloy, J. Hulvershorn, M.A. Elliot & J.I. Gold, Soc. Neurosci. Abstr. 454.14, 2005.
Behavioural performance improved steadily for both monkeys with training (Fig. 2). In early sessions we trained monkeys on a simplified version of the task using only the strongest motion stimulus (99% coherence) to reinforce the association between motion direction and saccade target. After performance on this easy condition improved to well above chance (>~75% correct), we introduced more difficult stimuli using randomly interleaved motion coherences and viewing durations (indicated as session 1 in Fig. 2c). Nevertheless, we continued to interleave trials with 99% coherence randomly in each session throughout training (Fig. 2c). For both monkeys, declining error rates on these high-coherence trials as a function of session were fit by a single-exponential function with a lower asymptote of zero (mean±SEM initial value = 0.51±0.02 for monkey C, 0.48±0.01 for monkey Z; time constant = 3.6±0.4 sessions for monkey C, 30.4±1.1 sessions for monkey Z). Thus, both monkeys learned how to perform the task in early sessions and soon could express the visuomotor association for high-coherence stimuli with few or no errors.
Figure 2.
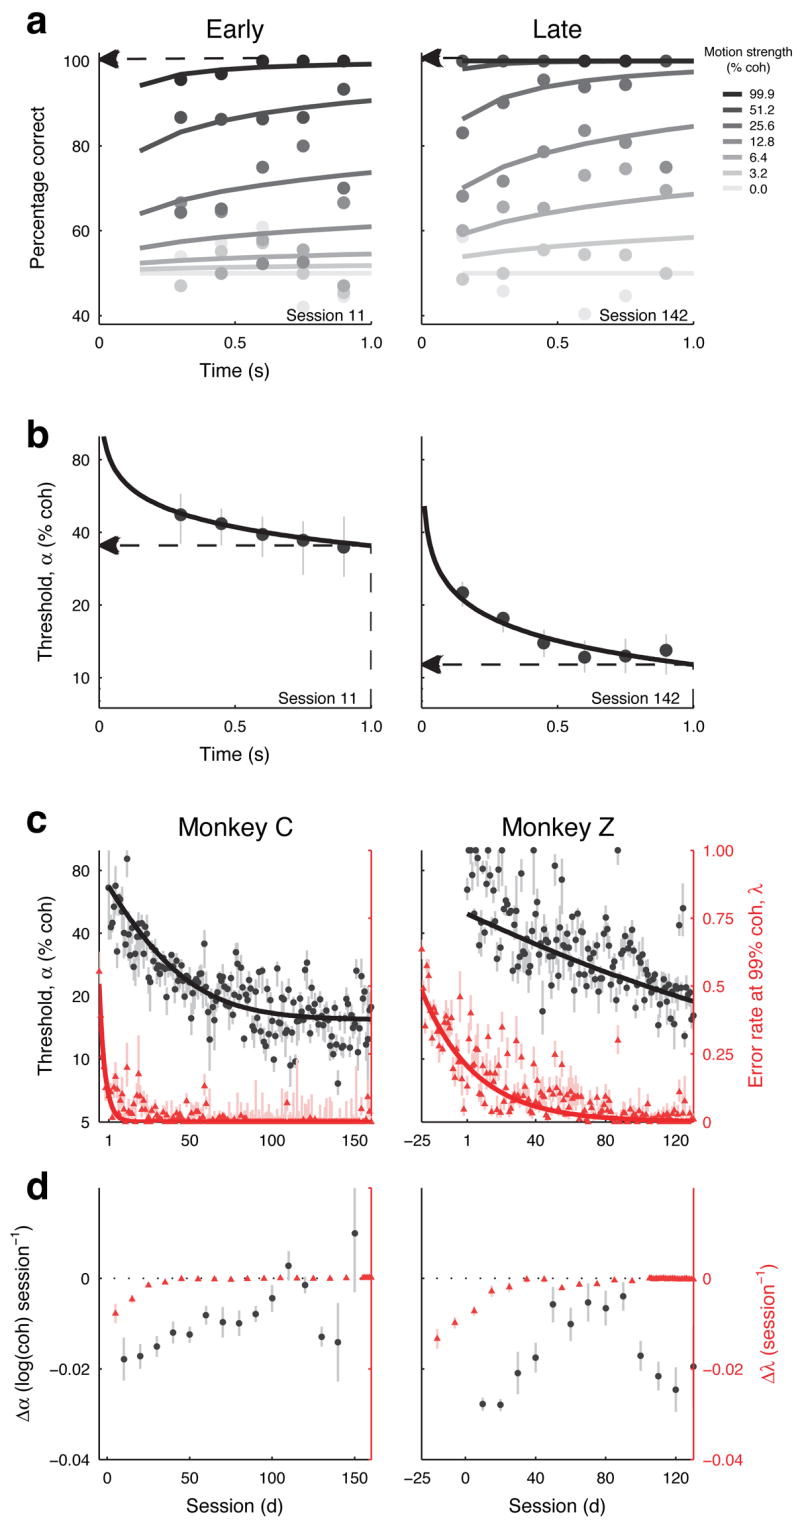
Behaviour. a,b. Behavioural performance (a) and discrimination threshold (b, best fits and 68% CIs) as a function of viewing time (0.3-s-wide bins in 0.15-s intervals) for different motion strengths (see legend) from two representative sessions early (left) and late (right) in training. Discrimination thresholds in b were computed for each time bin using a cumulative Weibull function16. Solid lines in a and b are behavioural performance and thresholds computed from a time-dependent cumulative Weibull function (Eq. 1) fit to each data set (not binned by viewing duration), respectively. We report error rates at 99.9% coherence (dashed arrows in a, σ in c and d) and discrimination thresholds at 1-s viewing duration from the fits (dashed arrows in b, ● in c and d). c, d, Discrimination threshold (●; note the logarithmic scale on the left ordinate) and error rate at 99.9% coherence (σ; linear scale on the right ordinate) with 68% CIs plotted as a function of training session for the two monkeys. Prior to session 1, monkeys were trained mostly with 99.9% coherence motion. Solid lines are best-fitting single exponential functions. d, Learning rates (best fits and SEM) of discrimination thresholds (● ) and errors at 99.9% coherence (σ ) during training for the two monkeys. The learning rate was computed as the slope of a linear fit to the behavioural data (log discrimination thresholds or errors at 99.9% coherence) within a 41-session wide bin. A negative learning rate implies that the behavioural parameter improved during that particular epoch of training.
In addition to learning the association, the monkeys learned to better discriminate weaker and weaker motion signals at shorter viewing times. Fig. 2a shows performance from two sample sessions, one early and one late in training, for monkey C. For nearly all coherences and viewing times, the percentage of correct responses was greater in the later session. Indeed, throughout training, performance improved significantly for all non-zero coherences for monkey C and for 12.8–99.9% coherence for monkey Z (linear regression of percent correct per coherence with training session, H0: slope=0, p<0.05).
To further quantify improvements in performance with training, we used a time-dependent cumulative Weibull function (Eq. 1 and solid lines in Fig. 2a,b) to estimate the discrimination threshold, which is the motion strength at which the monkey achieved ~82% correct for a 1-s viewing duration, for each session. This function takes into account associative (high-coherence) errors (λ in Eq. 1) and thus can indicate changes in threshold that are distinct from changes in associative learning or lapses of attention (Fig. S2). Thresholds improved from ~67% to ~15% coherence for monkey C and from ~68% to ~19% coherence for monkey Z, with a time course that was substantially longer than for the associative improvements (Fig. 2c: mean±SEM time constants of single-exponential solid curves = 24.6±0.4 sessions for monkey C and 58.5±2.5 sessions for monkey Z; final value = 14.7±0.1% coherence for monkey C, 19.3±0.4% coherence for monkey Z; Fig. 2d: improvements in high-coherence errors were limited to early sessions, whereas improvements in threshold were apparent throughout most of training). Other behavioural parameters including the shape and time dependence of the psychometric function did not show similar systematic changes with training (Table S1). The goal of this study was to identify changes in the response properties of MT and LIP neurons that accompanied the improvements in discrimination threshold.
MT responses do not change with training
We recorded the responses of individual MT neurons to the motion stimulus both before and during training (Fig. 3; Monkey C: n=50 MT neurons recorded during a passive viewing condition before discrimination training began, n=92 during training; monkey Z: n=47 before, n=60 during training). As illustrated in Fig. 3a, MT responses before and during training showed a pattern of activation similar to that reported in trained monkeys16: motion in the preferred direction elicited an increase in spike rate and motion in the opposite direction elicited a decrease in spike rate to relatively constant values that depended on motion strength and sustained throughout motion viewing. To quantify these responses and test for changes with training, we fit a simple linear model to the normalized responses of individual neurons. This model describes the neural responses in terms of the baseline firing rate and three stimulus-based terms: a dependence on motion coherence that does not change with viewing time, a dependence on viewing time that does not change with motion coherence and a dependence on the (multiplicative) interaction between coherence and viewing time that is consistent with an accumulation of motion information over time29 (Eq. 3, Fig. 3b and Fig. S3). For both monkeys, only the coherence-alone term was typically >0, consistent with the idea that MT responses provide evidence about motion direction that depends only on stimulus strength and not viewing time. Moreover, none of the three terms changed significantly with training (linear regression versus session, computed separately for each term, each monkey and before and during training, H0: slope=0, p>0.05 for all conditions).
Figure 3.
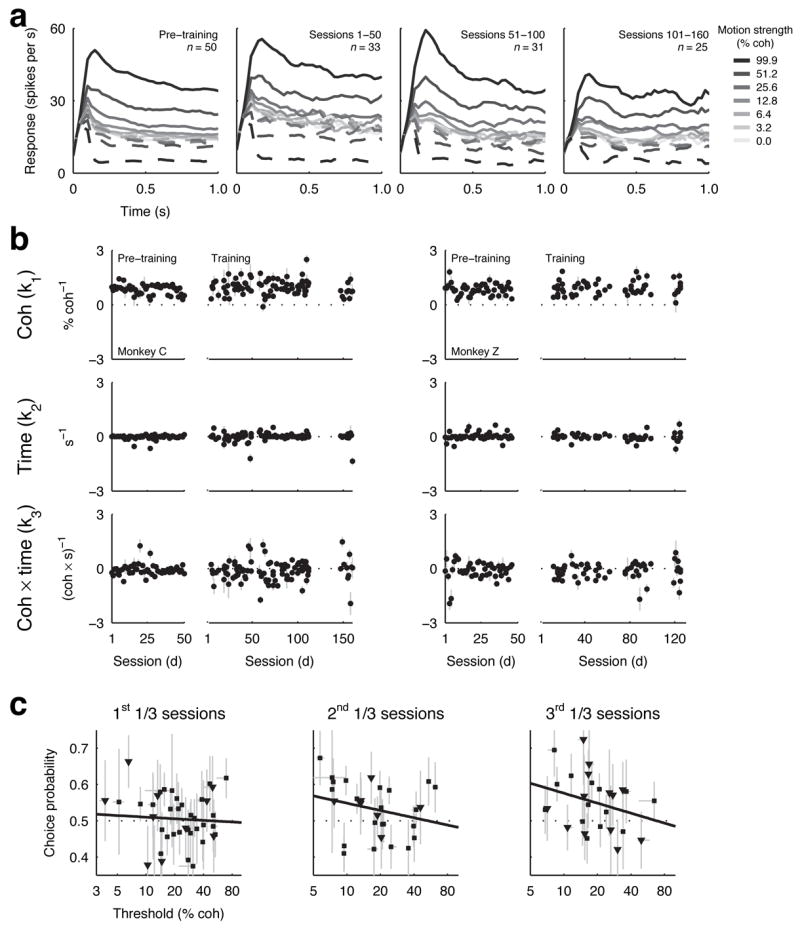
MT responses. a, Average activity of MT neurons as a function of viewing time (using 0.1-s-wide time bins with 0.025-s increments) for different motion strengths (see legend) for each neuron’s preferred (solid line) and null (dashed line) motion during different training periods for monkey C. “Pre-training” refers to responses to the motion stimulus measured while the monkey was rewarded for simply fixating a central spot, before being trained on the discrimination task. b, Coherence-, viewing time- and coherence × viewing time-dependence (Eq. 3) of individual MT neurons before and during training for monkeys C (left) and Z (right). Error bars are 68% CIs. c, Relationship between neurometric threshold and choice probability for individual MT neurons during different training periods for monkeys C (■) and Z (▼). Error bars are 68% CIs. Solid lines are linear fits.
We also quantified the motion sensitivity of individual MT neurons by computing a “neurometric” discrimination threshold using the same time-dependent cumulative Weibull function used to estimate behavioural threshold (Eq 1, Fig. S4). Neurometric thresholds were, on average, ~4% better during versus before training, but the differences were not significant (monkey C: geometric mean threshold coherence before training = 25.9%, during training = 21.0%, Mann-Whitney U test p=0.1964; monkey Z: before = 21.1%; during = 18.4%, p=0.4762). Moreover, the neurometric thresholds of neither the whole population nor the 50% most sensitive MT neurons changed systematically as a function of session either before or during training (linear regression, H0: slope of log threshold versus session=0; before training: monkey C, p=0.7612; monkey Z, p=0.9507, during training: monkey C, whole population, p=0.9498, 50% most sensitive, p=0.9899; monkey Z, whole population, p=0.8870, 50% most sensitive, p=0.9480). Interestingly, this lack of long-term changes across sessions occurred despite short-term changes within sessions, as has been reported previously (geometric mean±SEM ratio of psychometric thresholds in the second 200 versus the first 200 trials = 0.92±0.22 in monkey C and 0.84±0.29 in monkey Z; ratio of neurometric thresholds in MT in the second 200 versus the first 200 trials = 0.87±0.23 in monkey C and 0.98±0.29 in monkey Z)30. Other response properties including the width of directional tuning were unaffected by training (Table S1 and Fig. S3).
There was, however, a slight strengthening of the relationship between the trial-by-trial variability of MT responses and the monkeys’ choices with training. This analysis, called choice probability, has shown that MT neurons predict choice slightly but reliably in fully trained monkeys (~0.55, where 0.5 is chance and 1.0 is perfect; ref 17), which is the relationship expected for elements in a pool of weakly correlated neurons that provide noisy evidence for the decision31. Choice probability increased as a function of training session (combined data from both monkeys, mean±SEM choice probability = 0.493±0.011 for the first 30% and 0.549±0.018 for the last 30% of sessions). Moreover, the relationship between choice probability and motion sensitivity in MT changed systematically over the course of training such that more sensitive neurons became more predictive of the monkey’s direction decision as training progressed (Fig. 3c; correlation coefficient between choice probability and neurometric thresholds of MT neurons in the 1st 1/3 sessions, r=0.02, H0: r=0, p=0.5600; 2nd 1/3 sessions, r=−0.23, p=0.1137; 3rd 1/3 sessions, r=−0.34, p=0.0423).
In principle, the increases in choice probability could arise from an increase in correlated firing among MT neurons. However, a small number of simultaneously recorded pairs of MT neurons provide preliminary evidence that the degree of correlation is similar before (mean±SEM correlation coefficient r=0.16±0.06, n=8) and during (r=0.18±0.04, n=9) training and does not increase over the course of training (linear regression, H0: slope=0, p=0.5728). Thus, the systematic change in choice probability is likely to reflect an increasingly selective read-out of activity from MT neurons, particularly those most sensitive to the motion stimulus.
LIP responses change with training
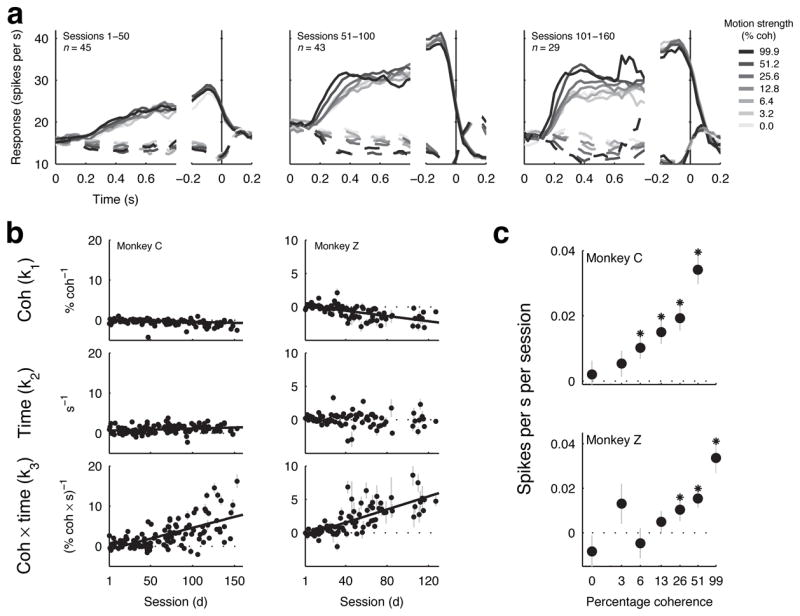
We recorded the responses of individual LIP neurons during motion viewing throughout training (monkey C, n=123; monkey Z, n=99 LIP neurons recorded during training). Fig. 4a shows the average spike rates of the population of LIP neurons recorded from monkey Cy aligned to motion onset (left) and saccade onset (right) for different training epochs. Throughout training, on trials in which the monkey selected the saccade target in the neuron’s response field LIP activity tended to increase gradually during motion viewing, stay elevated during the subsequent delay period and then increase just prior to saccade onset. On trials in which the other target was selected, LIP activity tended to decrease gradually during motion viewing and then remain below baseline levels until after the saccade. The peri-saccadic activity tended to be smaller in the first ~15 sessions (average activity from −0.5 to −0.1s before saccade onset=18.6 spikes/s from sessions 1–15 and 31.3 spikes/s from sessions 16–160, t-test p=0.0157 for monkey C; 27.0 spikes/s from sessions 1–15 and 48.6 sp/s from sessions 16–130, p=0.0024 for monkey Z) but then remained relatively stable throughout the rest of training (linear regression, H0: slope of average activity versus session=0, p=0.1174 for monkey C; p=0.3124 for monkey Z). In contrast, the responses during motion viewing changed substantially throughout training, with the rates of rise and fall becoming steeper and increasingly dependent on motion strength (higher coherences corresponding to steeper slopes).
Figure 4.
LIP responses. a. Average activity of LIP neurons as a function of viewing time (using 0.1-s-wide time bins with 0.025-s increments) for different motion strengths (see legend) for saccades into (solid line) and out of (dashed line) each neuron’s response field during different training periods for monkey C. Only correct trials were included. b. Coherence-, viewing time- and coherence × viewing time- dependence (Eq. 3) of individual LIP neurons before and during training for monkeys C (left) and Z (right). Error bars are 68% CIs. Solid lines are significant linear fits (p<0.05 for H0: slope=0). c. Coherence-specific effects of training on the rate of rise of LIP activities during motion viewing for monkeys C (top) and Z (bottom). The rate of rise was estimated separately for each coherence using a piecewise-linear function (Eq. 6 with the coherence-dependence term, β1, set to zero). Points and error bars are the slope and 68% CIs of a linear regression relating this rate of rise to session number (* indicates p<0.05 for H0: slope=0).
To quantify the effects of training on the coherence-dependent LIP responses, we fit spike rate data from individual neurons to the same linear model we used for the MT responses (Fig. 4b). For both monkeys, the coherence- and time-alone terms tended to be near zero throughout training (although the coherence term decreased slightly to small negative values with training in both monkeys, and the time term increased slightly to small positive values with training in monkey C). A larger effect was seen in the coherence × time interaction term, which began near zero and thus indicated little or no influence of the motion stimulus on the LIP responses at the beginning of training, and progressed steadily to more positive values. Because these neurons were selected based on spatially tuned pre-saccadic activity (see Methods, Fig. S5), this result implies that training both established and then shaped the sensory-driven responses in these sensory-motor neurons.
The changes in sensory-driven LIP responses reflected the improvements in behavioural sensitivity to weak motion signals. The pattern of coherence-specific changes in LIP was similar to the pattern of coherence-specific behavioural improvements: both the rate of rise of stimulus-driven LIP responses and discrimination performance increased as a function of training session for most non-zero coherences, with greater increases for higher coherences (H0: slope of a linear regression between session number and either average LIP rate of rise or percent correct for each coherence=0, p<0.05 for coherences ≥6.4% for LIP data and ≥3.2% for behavioural data for monkey C; for coherences ≥25.6% for LIP data and ≥12.8% for behavioural data for monkey Z, Fig. 4c). Moreover, LIP activity was correlated with behavioural threshold across sessions after taking into account the high-coherence errors (Fig. 5, left; partial correlation rth,(k3|λ) = −0.42, H0: r=0 using Fisher’s Z transformation, p<10−5 for monkey C; rth,(k3|λ) =−0.35, p=0.0049 for monkey Z), but the converse was not true, with no correlation between high-coherence errors and LIP activity after taking into account the changes in behavioural threshold (rλ,(k3|th) =0.0460, p=0.6198 for monkey C; rλ,(k3|th)= −0.0590, p=0.6011 for monkey Z).
Figure 5.

Relationship between the coherence- and time- dependent LIP responses (k3, Eq. 3) and various behavioural, motor and motivational parameters. The r-values for the behavioural parameters (left two columns) are the partial correlations between each parameter and k3 with the effect of the other parameter on k3 removed. Other r-values are the correlation coefficients between that behavioural parameter and k3. ♣ indicates a significant correlation between the behavioural parameter and k3 (p<0.05). * indicates that the behavioural parameter changed significantly as a function of training session (linear regression, p<0.05; see Table S1). Error bars are 68% CIs.
The changes in sensory-driven LIP responses with training also did not appear to reflect changes in other motor (Fig. 5, middle) or motivational parameters (Fig. 5, right) known to modulate LIP activity21, 22. Some of these parameters changed with training, but none were consistently correlated with the changes in LIP responsiveness over the course of training for both monkeys (Fig. 5 and Table S1).
Comparison of behavioural, MT and LIP data during training
In trained monkeys, MT and LIP are thought to play different but complementary roles in forming the direction decision: MT (possibly in tandem with other motion-sensitive areas like the middle superior temporal area, or MST) provides sensory evidence used to form the decision, whereas LIP (possibly in tandem with other sensory-oculomotor areas like the FEF and superior colliculus) accumulates and interprets the sensory evidence to form the categorical judgment that instructs behaviour23. Our results suggest that the improvements in behavioural sensitivity result from changes not in the sensory representation but rather its interpretation.
To test this idea and more directly compare the MT, LIP and behavioural data, we used a sequence of three nested models. The first model describes the coherence-dependent sensory evidence and was fit to MT data. The second model builds on the first, describing the accumulation over time of the sensory evidence into a decision variable, and was fit to LIP data. The third model builds on the second, describing the monkey’s decisions in terms of the value of the LIP decision variable, and was fit to behavioural data29, 32(Fig. 6a). The advantage of this scheme is that MT, LIP and behavioural data can be fit separately but then compared directly via a term common to the three models describing how the sensory evidence used to form the decision scales with motion coherence (aMT, aLIP and abe in Fig. 6a). For both monkeys, the value of this motion-sensitive term grew as a function of training session in a similar manner for data from behaviour and LIP but not MT (Fig. 6b,c; monkey C: correlation coefficient between MT and behaviour r=0.03, H0: r=0 using Fisher’s Z transformation, p=0.7874; LIP and behaviour r=0.59, p<10−12; monkey Z: MT and behaviour r=−0.14, p=0.2911; LIP and behaviour r=0.60, p<10−9). A straightforward interpretation of this result is that training does not affect the representation of sensory evidence in MT directly but effectively scales its output, providing increasingly sensitive evidence to the decision variable in LIP used to guide behaviour.
Figure 6.

Decision model. a. Schematic of the decision model and example fits to behavioural, MT and LIP data. The decision model assumes that MT represents the coherence-dependent sensory evidence, LIP accumulates over time this sensory evidence into a decision variable, and the monkey’s choice depends on the value of this decision variable. The model allows us to fit separately data from MT, LIP and behaviour but extract a common parameter: the coherence dependence of the sensory information represented in each stage of processing (a in Eq. 4). b. Coherence dependence (best fit values and 68% CIs) computed from behavioural (left axes, black symbols) and neural data (right axes, cyan symbols for MT data, red symbols for LIP data). Solid lines are linear fits (H0: slope=0, monkey C: behaviour p<10−10, MT p=0.1056, LIP p<10−13; monkey Z: behaviour p<10−10, MT p=0.6349, LIP p<10−13). c. Relationship between a computed from behavioural data and neural data. ♣ indicates a significant correlation (p<0.05). Error bars are 68% CIs.
Specificity of learning
Perceptual learning is typically specific to the stimulus attributes used during training, including motion direction in a direction-discrimination task33. This phenomenon helps to distinguish perceptual learning from cognitive or motor changes and has been used to argue that the underlying changes occur at early stages of sensory processing2. For our task, the stimulus configuration used in a given session depended on the characteristics of the MT and/or LIP neuron(s) being recorded and thus varied slightly from session to session (a factor that in of itself can affect the specificity of learning34). We tested for the specificity of learning by analyzing performance relative to the similarity of the current stimulus configuration to configurations used in previous sessions.
For both monkeys, discrimination performance depended on the familiarity of the axis of motion (Fig. 7). We calculated for each session the difference between the motion sensitivity computed from behavioural data (a in Eq. 4) and its 21-session running average. This quantity provides an estimate of discrimination performance relative to its current trend: a positive value implies better-than-average performance, a negative value implies worse-than-average performance. For both monkeys, the value of this quantity was negatively correlated with the absolute z score of motion direction (monkey C: correlation coefficients r=−0.39, H0: r=0 using Fisher’s Z transformation p<10−7; monkey Z: r=−0.49, p<10−9), indicating that performance tended to degrade when an unfamiliar stimulus was used. This specificity for the axis of motion was mirrored in neural activity in LIP (Fig. 7b, red symbols; monkey C: r=−0.37, p=0.0004; monkey Z: r=−0.29, p=0.0204) but not MT (Fig. 7b, cyan symbols; monkey C: r=0.09, p=0.5439; monkey Z: r=0.22, p=0.2063), which is consistent with the idea that perceptual learning can be specific by virtue of what is learned (in this case, the LIP decision variable) and need not involve changes in the sensory representation (direction-selective responses in area MT)3.
Figure 7.
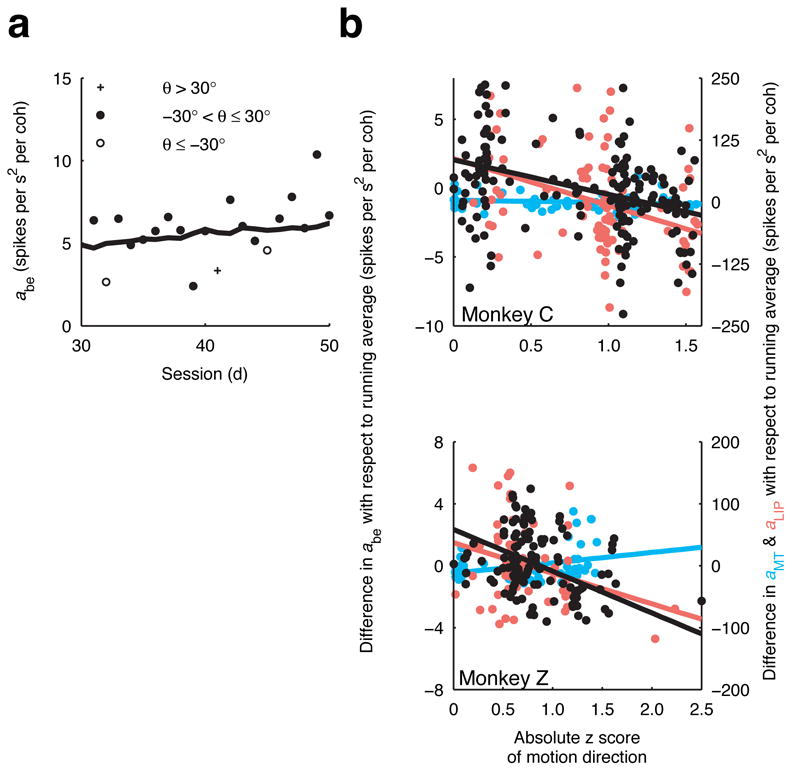
Specificity of learning. a. The coherence dependence of the sensory information (a in Eq. 4) estimated from behavioural performance from sessions 30–50 for monkey Z. The solid line is a 21-session running average. b. The difference between the coherence dependence from a given session and its 21-session running average for behaviour (black), MT (cyan) and LIP (red) responses are plotted against the absolute z score of motion direction for monkeys C (top) and Z (bottom). For a given session, the z score is computed using the distribution of motion directions used prior to that session. Thus, less frequently used motion directions will have larger z scores. Solid lines are linear fits.
Discussion
Our results show that for monkeys trained to discriminate the direction of motion of noisy visual stimuli, improvements in discrimination threshold (i.e., higher sensitivity to weak motion) corresponded to changes in sensory-driven responses in area LIP but not MT. In MT, individual neurons responded similarly to motion stimuli before and throughout training, with, on average, a sensitivity that was similar to that of trained monkeys. However, responses of the most sensitive MT neurons became increasingly predictive of the monkeys’ choices with training. In LIP, neurons tuned for saccadic direction were insensitive to visual motion at the beginning of training but developed responses that grew increasingly strongly with motion strength and viewing time as performance on the task improved. The results suggest that the perceptual improvements corresponded to an increasingly selective read-out of highly sensitive MT neurons by a decision process, represented in LIP, that instructed the behavioural response.
Because the motion sensitivity of MT neurons likely arises from their direct and indirect input from V135, our results appear to rule out learning-induced changes in V1, as well. This finding is consistent with electrophysiological studies in monkeys that found little or no changes in V1 with perceptual learning7–9 (although larger effects have been found in V1 of human subjects using fMRI36) and provides additional evidence that the stimulus specificity of perceptual learning does not necessarily imply changes in primary sensory cortex3, 4. Our results also further distinguish early visual cortical areas from primary somatosensory and auditory cortices, which in both monkeys and humans can show dramatic changes with perceptual learning5, 6, 37–39. We cannot rule out the possibility of changes in other parts of extrastriate visual cortex that carry appropriate motion signals, like area MST40. Nevertheless, it is striking that we found no changes in MT sensitivity over the course of training despite the established role of MT in task performance16–19; the increase in MT choice probabilities with training, indicating an increasingly strong correspondence with behaviour; and the fact that our recording and analysis methods could resolve within-session changes in MT sensitivity30 that were smaller in magnitude than the longer-term changes that we would expect based on behaviour.
The changes we report for LIP complement and extend previous findings. Learned sensory-motor associations have been shown to correspond to changes in LIP but not MT41, 42. Consistent with those findings, we found that motion-driven LIP responses appeared when the monkeys learned the association between motion direction and saccadic response. However, unlike previous studies we showed that both behaviour and LIP responses continued to evolve well after the visuomotor association was established, together reflecting improved sensitivity to weak motion. These results support the intriguing possibility that associative and perceptual learning might share common mechanisms4, 43. Learning a stimulus-response association establishes functional connectivity from neurons that represent the sensory stimulus to neurons that control the motor response. Improvements in perceptual sensitivity might then involve refinement of this connectivity to provide a more selective read-out of the most sensitive sensory signals associated with that response. Our results are consistent with such a refinement of direct or indirect ascending projections from MT to LIP44, an idea that merits further testing.
We do not know the exact role that LIP plays in task performance throughout training. In trained monkeys, multiple brain areas including LIP, the superior colliculus and parts of the prefrontal cortex including the FEF exhibit similar sensory-motor responses during performance of the discrimination task24, 25, 27, 28. We do not know what, if any, differences exist in the contributions of these brain areas to task performance either during or after training. Moreover, LIP plays a multitude of cognitive and sensory-motor roles that could, in principle, change during training and account for the changes in LIP responses during motion viewing 20–22. However, we found no evidence for such modulation by numerous oculomotor and motivational parameters. Instead, the sensory-driven LIP responses changed in a manner that was consistent with a decision process that used increasingly sensitive motion evidence to determine the saccadic choice. These decision computations represented in LIP appear to be critical for performance of trained monkeys, an idea supported by a close relationship between LIP responses and reaction times25 and the ability to bias performance using electrical microstimulation of LIP26. Additional work is needed to establish similarly strong links between LIP activity, decision-making and behaviour throughout training.
The results also further support a close relationship between learning and attention12. Of the learning-induced changes that have been found previously in V1, attentional modulation appears to play a primary role8. Attentional modulation might likewise account for the slight overall improvement in MT sensitivity in our data when comparing sessions before and during training or, like in several other studies, within training sessions30, 45. The changes in choice probabilities in MT and motion-driven responses in LIP might also be thought of in terms of improved attention to appropriate features of the motion representation used to form the decision. This idea is parsimonious with the widely reported role of LIP in spatial and feature-based attention20, 46 and the relationship between attention and perceptual learning on other tasks12. It remains to be seen how general a role this kind of mechanism plays in different forms of perceptual learning, which can have much different time courses47, attentional demands12 and magnitudes48.
Methods
Behavioural task
The motion stimulus was a random-dot kinematogram described elsewhere16, 29. Motion direction, coherence, and duration (a random time between 0.1–1.4s from an exponential distribution) were varied randomly from trial-to-trial. Correct responses and half of the 0% coherence trials elicited a juice reward of a variable amount (1–4 drops). Incorrect responses were followed by a “time out” period lasting 1–5s. Task difficulty was held relatively constant by adjusting the distributions of coherences and viewing times to give ~70–80% correct per session. This design kept the total reward per session roughly constant and helped to keep the monkeys motivated throughout training. Eye position was monitored using a video-based system (ASL, Bedford, MA) sampled at 240 Hz to enforce fixation during motion viewing and register the saccadic response.
Electrophysiology
Monkeys were prepared for the experiments by surgical implantation of a head-holding device and recording cylinders. MT and LIP were targeted using sterotaxic information and magnetic resonance imaging (Fig. 1b). Neural activity was recorded using quartz-coated platinum-tungsten microelectrodes advanced using two Mini Matrix systems (Thomas Recording, Inc., Giessen, Germany), one per recording cylinder. Spike waveforms were stored and sorted offline (Plexon, Inc., Dallas, TX). All training, surgical and experimental procedures were in accordance with the National Institutes of Health Guide for the Care and Use of Laboratory Animals and were approved by the University of Pennsylvania Institutional Animal Care and Use Committee.
We searched for MT neurons with consistent spatial, direction and speed tuning, measured using a 99.9% coherence stimulus (Fig. S1 and S3). We searched for LIP neurons using a delayed-saccade task and selected neurons with spatially tuned delay-period activity25 and response fields in consistent locations (Fig. S1 and S5).
Analysis of behavioural data
We fit behavioural data to a time-dependent cumulative Weibull function in which discrimination threshold is a power function of time:
| [1] |
where P is the discrimination performance at motion strength C (in percent coherence) and viewing time T (in seconds), λ is the fraction of errors measured for stimuli of 99% coherence and viewing times > 0.4s, and with fitted parameters α (threshold coherence at 1s), n (time exponent) and β (shape parameter).
Analysis of MT and LIP data
To quantify the effects of motion coherence and viewing time on the responses of MT and LIP, we first normalized the responses of each neuron:
| [2] |
where r(C,T) is the difference in responses (in spikes/s) at coherence C and viewing time T to motion towards versus away from the neuron’s preferred direction (for MT) or preferred choice (for LIP), rBL is the average baseline response 0.2–0s before motion onset and r97.5 is the 97.5-percentile response at 99.9% coherence preferred motion.
This normalized response (MT: from 0.1–1s; LIP: from the beginning to the end of the ramp activity, which were estimated by fitting a piecewise-linear function (Eq. 6) to the neuron’s responses to 99.9% coherent motion) was then fit to a simple linear model:
| [3] |
with parameters that describe the effect of coherence (k1), viewing time (k2) and coherence × time interaction (k3) on the neuron’s response.
In addition, we also computed the sensitivity (“neurometric” discrimination thresholds)16 and choice probability17 of each MT neuron. Sensitivity was computed using an ROC analysis of distributions of MT responses separated by motion direction, computed separately for each motion strength and cumulative bins of viewing time from 0–1s in 0.05-s steps and fit to Eq. 1. Choice probability was computed from the distributions of MT responses to 0% coherence stimuli, separated by the monkey’s choices.
Model of the decision variable
We modelled the decision variable as the accumulated difference in activity between noisy pools of motion sensors tuned to the correct and incorrect directions of motion29:
| [4] |
where C is fraction coherence, T is viewing time (in seconds), R0 is the response (in spikes/s) of MT neurons for 0% coherence, 〈 〉 denotes expectation, and a, m and n are fitted parameters. We assume that Sc and Si are normally distributed with variances that scale with their mean , A correct response results when Sc>Si. If Sc and Si are independent and normally distributed, then the probability of a correct response, P, is:
| [5] |
where μ is the expected value of the accumulated difference, 〈Sc − Si〉 = 〈Sc〉− 〈Si〉 and σ2 is the sum of the variances of Sc and Si.
We used different versions of the model to estimate the coherence-dependence of the decision variable (the parameter a in Eq. 4) separately for behavioural, MT, and LIP data. For behaviour, we fit Eq. 5 to performance. For MT data, we estimated the linear dependence of preferred–null direction responses averaged over the full viewing duration, consistent with the difference between the time-independent portions of 〈Sc〉 and 〈Si〉. For LIP data, we fit
| [6] |
to the difference in activity between leftward and rightward choices, letting β0, β1, β2, τ, and γ be free parameters and reporting β1 as the coherence-dependent parameter (equivalent to a in the behavioural model). These estimates are expected to be offset from each other by an overall scale factor because of different pooling assumptions: we fit data from individual MT neurons, from individual LIP neurons that were assumed to pool from an unknown number of MT neurons and from behavioural data assumed to reflect both MT and LIP contributions; note the different axes in Fig. 6 for behavioural and neural data. Nevertheless, these fits are useful for comparing how each estimate changes with training.
Supplementary Material
Acknowledgments
We thank M. Shadlen, L. Ding, M. Nassar, B. Heasley, R. Kalwani, P. Connolly, C-L. Teng and S. Bennur for helpful comments on this manuscript and J. Zweigle for expert technical assistance. This research was supported by the Sloan Foundation, the McKnight Foundation, the Burroughs-Wellcome Fund, the US National Institutes of Health R01-EY015260 and T32-EY007035.
Footnotes
Author contributions JIG planned and supervised the study. CL conducted the experiments and data analyses. CL and JIG wrote the manuscript together.
References
- 1.Goldstone RL. Perceptual learning. Annu Rev Psychol. 1998;49:585–612. doi: 10.1146/annurev.psych.49.1.585. [DOI] [PubMed] [Google Scholar]
- 2.Karni A, Sagi D. Where practice makes perfect in texture discrimination: evidence for primary visual cortex plasticity. Proc Natl Acad Sci U S A. 1991;88:4966–4970. doi: 10.1073/pnas.88.11.4966. [DOI] [PMC free article] [PubMed] [Google Scholar]
- 3.Mollon JD, Danilova MV. Three remarks on perceptual learning. Spat Vis. 1996;10:51–58. doi: 10.1163/156856896x00051. [DOI] [PubMed] [Google Scholar]
- 4.Dosher BA, Lu ZL. Mechanisms of perceptual learning. Vision Res. 1999;39:3197–3221. doi: 10.1016/s0042-6989(99)00059-0. [DOI] [PubMed] [Google Scholar]
- 5.Recanzone GH, Schreiner CE, Merzenich MM. Plasticity in the frequency representation of primary auditory cortex following discrimination training in adult owl monkeys. J Neurosci. 1993;13:87–103. doi: 10.1523/JNEUROSCI.13-01-00087.1993. [DOI] [PMC free article] [PubMed] [Google Scholar]
- 6.Recanzone GH, Merzenich MM, Jenkins WM, Grajski KA, Dinse HR. Topographic reorganization of the hand representation in cortical area 3b owl monkeys trained in a frequency-discrimination task. J Neurophysiol. 1992;67:1031–1056. doi: 10.1152/jn.1992.67.5.1031. [DOI] [PubMed] [Google Scholar]
- 7.Schoups A, Vogels R, Qian N, Orban G. Practising orientation identification improves orientation coding in V1 neurons. Nature. 2001;412:549–553. doi: 10.1038/35087601. [DOI] [PubMed] [Google Scholar]
- 8.Crist RE, Li W, Gilbert CD. Learning to see: experience and attention in primary visual cortex. Nat Neurosci. 2001;4:519–525. doi: 10.1038/87470. [DOI] [PubMed] [Google Scholar]
- 9.Ghose GM, Yang T, Maunsell JH. Physiological correlates of perceptual learning in monkey V1 and V2. J Neurophysiol. 2002;87:1867–1888. doi: 10.1152/jn.00690.2001. [DOI] [PubMed] [Google Scholar]
- 10.Yang T, Maunsell JH. The effect of perceptual learning on neuronal responses in monkey visual area V4. J Neurosci. 2004;24:1617–1626. doi: 10.1523/JNEUROSCI.4442-03.2004. [DOI] [PMC free article] [PubMed] [Google Scholar]
- 11.Raiguel S, Vogels R, Mysore SG, Orban GA. Learning to see the difference specifically alters the most informative V4 neurons. J Neurosci. 2006;26:6589–6602. doi: 10.1523/JNEUROSCI.0457-06.2006. [DOI] [PMC free article] [PubMed] [Google Scholar]
- 12.Ahissar M, Hochstein S. Attentional control of early perceptual learning. Proc Natl Acad Sci U S A. 1993;90:5718–5722. doi: 10.1073/pnas.90.12.5718. [DOI] [PMC free article] [PubMed] [Google Scholar]
- 13.Saarinen J, Levi DM. Perceptual learning in vernier acuity: what is learned? Vision Res. 1995;35:519–527. doi: 10.1016/0042-6989(94)00141-8. [DOI] [PubMed] [Google Scholar]
- 14.Li W, Piech V, Gilbert CD. Perceptual learning and top–down influences in primary visual cortex. Nat Neurosci. 2004;7:651–657. doi: 10.1038/nn1255. [DOI] [PMC free article] [PubMed] [Google Scholar]
- 15.Maunsell JH, Van Essen DC. Functional properties of neurons in middle temporal visual area of the macaque monkey. I. Selectivity for stimulus direction, speed, and orientation. J Neurophysiol. 1983;49:1127–1147. doi: 10.1152/jn.1983.49.5.1127. [DOI] [PubMed] [Google Scholar]
- 16.Britten KH, Shadlen MN, Newsome WT, Movshon JA. The analysis of visual motion: a comparison of neuronal and psychophysical performance. J Neurosci. 1992;12:4745–4765. doi: 10.1523/JNEUROSCI.12-12-04745.1992. [DOI] [PMC free article] [PubMed] [Google Scholar]
- 17.Britten KH, Newsome WT, Shadlen MN, Celebrini S, Movshon JA. A relationship between behavioral choice and the visual responses of neurons in macaque MT. Vis Neurosci. 1996;13:87–100. doi: 10.1017/s095252380000715x. [DOI] [PubMed] [Google Scholar]
- 18.Newsome WT, Pare EB. A selective impairment of motion perception following lesions of the middle temporal visual area (MT) J Neurosci. 1988;8:2201–2211. doi: 10.1523/JNEUROSCI.08-06-02201.1988. [DOI] [PMC free article] [PubMed] [Google Scholar]
- 19.Salzman CD, Britten KH, Newsome WT. Cortical microstimulation influences perceptual judgements of motion direction. Nature. 1990;346:174–177. doi: 10.1038/346174a0. [DOI] [PubMed] [Google Scholar]
- 20.Colby CL, Goldberg ME. Space and attention in parietal cortex. Annu Rev Neurosci. 1999;22:319–349. doi: 10.1146/annurev.neuro.22.1.319. [DOI] [PubMed] [Google Scholar]
- 21.Platt ML, Glimcher PW. Neural correlates of decision variables in parietal cortex. Nature. 1999;400:233–238. doi: 10.1038/22268. [DOI] [PubMed] [Google Scholar]
- 22.Snyder LH, Batista AP, Andersen RA. Intention-related activity in the posterior parietal cortex: a review. Vision Res. 2000;40:1433–1441. doi: 10.1016/s0042-6989(00)00052-3. [DOI] [PubMed] [Google Scholar]
- 23.Gold JI, Shadlen MN. The neural basis of decision making. Annu Rev Neurosci. 2007;30:535–574. doi: 10.1146/annurev.neuro.29.051605.113038. [DOI] [PubMed] [Google Scholar]
- 24.Shadlen MN, Newsome WT. Neural basis of a perceptual decision in the parietal cortex (area LIP) of the rhesus monkey. J Neurophysiol. 2001;86:1916–1936. doi: 10.1152/jn.2001.86.4.1916. [DOI] [PubMed] [Google Scholar]
- 25.Roitman JD, Shadlen MN. Response of neurons in the lateral intraparietal area during a combined visual discrimination reaction time task. J Neurosci. 2002;22:9475–9489. doi: 10.1523/JNEUROSCI.22-21-09475.2002. [DOI] [PMC free article] [PubMed] [Google Scholar]
- 26.Hanks TD, Ditterich J, Shadlen MN. Microstimulation of macaque area LIP affects decision-making in a motion discrimination task. Nat Neurosci. 2006;9:682–689. doi: 10.1038/nn1683. [DOI] [PMC free article] [PubMed] [Google Scholar]
- 27.Horwitz GD, Newsome WT. Separate signals for target selection and movement specification in the superior colliculus. Science. 1999;284:1158–1161. doi: 10.1126/science.284.5417.1158. [DOI] [PubMed] [Google Scholar]
- 28.Kim JN, Shadlen MN. Neural correlates of a decision in the dorsolateral prefrontal cortex of the macaque. Nat Neurosci. 1999;2:176–185. doi: 10.1038/5739. [DOI] [PubMed] [Google Scholar]
- 29.Gold JI, Shadlen MN. The influence of behavioral context on the representation of a perceptual decision in developing oculomotor commands. J Neurosci. 2003;23:632–651. doi: 10.1523/JNEUROSCI.23-02-00632.2003. [DOI] [PMC free article] [PubMed] [Google Scholar]
- 30.Zohary E, Celebrini S, Britten KH, Newsome WT. Neuronal plasticity that underlies improvement in perceptual performance. Science. 1994;263:1289–1292. doi: 10.1126/science.8122114. [DOI] [PubMed] [Google Scholar]
- 31.Shadlen MN, Britten KH, Newsome WT, Movshon JA. A computational analysis of the relationship between neuronal and behavioral responses to visual motion. J Neurosci. 1996;16:1486–1510. doi: 10.1523/JNEUROSCI.16-04-01486.1996. [DOI] [PMC free article] [PubMed] [Google Scholar]
- 32.Eckhoff P, Holmes P, Law C, Connolly PM, Gold JI. On diffusion processes with variable drift rates as models for decision making during learning. New Journal of Physics. 2007;9 doi: 10.1088/1367-2630/10/1/015006. [DOI] [PMC free article] [PubMed] [Google Scholar]
- 33.Ball K, Sekuler R. A specific and enduring improvement in visual motion discrimination. Science. 1982;218:697–698. doi: 10.1126/science.7134968. [DOI] [PubMed] [Google Scholar]
- 34.Liu Z, Weinshall D. Mechanisms of generalization in perceptual learning. Vision Res. 2000;40:97–109. doi: 10.1016/s0042-6989(99)00140-6. [DOI] [PubMed] [Google Scholar]
- 35.Movshon JA, Newsome WT. Visual response properties of striate cortical neurons projecting to area MT in macaque monkeys. J Neurosci. 1996;16:7733–7741. doi: 10.1523/JNEUROSCI.16-23-07733.1996. [DOI] [PMC free article] [PubMed] [Google Scholar]
- 36.Furmanski CS, Schluppeck D, Engel SA. Learning strengthens the response of primary visual cortex to simple patterns. Curr Biol. 2004;14:573–578. doi: 10.1016/j.cub.2004.03.032. [DOI] [PubMed] [Google Scholar]
- 37.Pleger B, et al. secondary somatosensory cortex. Neuron. 2003;40:643–653. doi: 10.1016/s0896-6273(03)00677-9. [DOI] [PubMed] [Google Scholar]
- 38.Bao S, Chang EF, Woods J, Merzenich MM. Temporal plasticity in the primary auditory cortex induced by operant perceptual learning. Nat Neurosci. 2004;7:974–981. doi: 10.1038/nn1293. [DOI] [PubMed] [Google Scholar]
- 39.Blake DT, Heiser MA, Caywood M, Merzenich MM. Experience-dependent adult cortical plasticity requires cognitive association between sensation and reward. Neuron. 2006;52:371–381. doi: 10.1016/j.neuron.2006.08.009. [DOI] [PMC free article] [PubMed] [Google Scholar]
- 40.Celebrini S, Newsome WT. Neuronal and psychophysical sensitivity to motion signals in extrastriate area MST of the macaque monkey. J Neurosci. 1994;14:4109–4124. doi: 10.1523/JNEUROSCI.14-07-04109.1994. [DOI] [PMC free article] [PubMed] [Google Scholar]
- 41.Freedman DJ, Assad JA. Experience-dependent representation of visual categories in parietal cortex. Nature. 2006;443:85–88. doi: 10.1038/nature05078. [DOI] [PubMed] [Google Scholar]
- 42.Grunewald A, Linden JF, Andersen RA. Responses to auditory stimuli in macaque lateral intraparietal area. I. Effects of training. J Neurophysiol. 1999;82:330–342. doi: 10.1152/jn.1999.82.1.330. [DOI] [PubMed] [Google Scholar]
- 43.Hall G. Perceptual and associative learning. Clarendon Press; Oxford University Press; Oxford [England], New York: 1991. [Google Scholar]
- 44.Lewis JW, Van Essen DC. Corticocortical connections of visual, sensorimotor, and multimodal processing areas in the parietal lobe of the macaque monkey. J Comp Neurol. 2000;428:112–137. doi: 10.1002/1096-9861(20001204)428:1<112::aid-cne8>3.0.co;2-9. [DOI] [PubMed] [Google Scholar]
- 45.Seidemann E, Newsome WT. Effect of spatial attention on the responses of area MT neurons. J Neurophysiol. 1999;81:1783–1794. doi: 10.1152/jn.1999.81.4.1783. [DOI] [PubMed] [Google Scholar]
- 46.Sereno AB, Amador SC. Attention and memory-related responses of neurons in the lateral intraparietal area during spatial and shape-delayed match-to-sample tasks. J Neurophysiol. 2006;95:1078–1098. doi: 10.1152/jn.00431.2005. [DOI] [PubMed] [Google Scholar]
- 47.Vaina LM, Belliveau JW, des Roziers EB, Zeffiro TA. Neural systems underlying learning and representation of global motion. Proc Natl Acad Sci U S A. 1998;95:12657–12662. doi: 10.1073/pnas.95.21.12657. [DOI] [PMC free article] [PubMed] [Google Scholar]
- 48.Fine I, Jacobs RA. Comparing perceptual learning tasks: a review. J Vis. 2002;2:190–203. doi: 10.1167/2.2.5. [DOI] [PubMed] [Google Scholar]
- 49.Cox RW. AFNI: software for analysis and visualization of functional magnetic resonance neuroimages. Comput Biomed Res. 1996;29:162–173. doi: 10.1006/cbmr.1996.0014. [DOI] [PubMed] [Google Scholar]
- 50.VanEssen DC. Organization of visual areas in macaque and human cerebral cortex. In: Chalupa L, Werner JS, editors. The Visual Neurosciences. MIT Press; 2004. pp. 507–521. [Google Scholar]
Associated Data
This section collects any data citations, data availability statements, or supplementary materials included in this article.