

Abstract
Gene expression is a complex quantitative trait partially regulated by genetic variation in DNA sequence. Population differences in gene expression could contribute to some of the observed differences in susceptibility to common diseases and response to drug treatments. We characterized gene expression in the full set of HapMap lymphoblastoid cell lines derived from individuals of European and African ancestry for 9156 transcript clusters (gene-level) evaluated with the Affymetrix GeneChip Human Exon 1.0 ST Array. Gene expression was found to differ significantly between these samples for 383 transcript clusters. Biological processes including ribosome biogenesis and antimicrobial humoral response were found to be enriched in these differential genes, suggesting their possible roles in contributing to the population differences at a higher level than that of mRNA expression and in response to environmental information. Genome-wide association studies for local or distant genetic variants that correlate with the differentially expressed genes enabled identification of significant associations with one or more single-nucleotide polymorphisms (SNPs), consistent with the hypothesis that genetic factors and not simply population identity or other characteristics (age of cell lines, length of culture, etc.) contribute to differences in gene expression in these samples. Our results provide a comprehensive view of the genes differentially expressed between populations and the enriched biological processes involved in these genes. We also provide an evaluation of the contributions of genetic variation and nongenetic factors to the population differences in gene expression.
Introduction
The genetic basis for population differences in clinical outcome and risk of disease is not fully understood.1–5 Although contributors to the differences are likely to include socioeconomic and/or environmental factors, genetic variation affecting gene-expression levels is likely to play an important role. Previous studies have shown that gene expression is a complex quantitative phenotype with variability among individuals as well as among cell types.6–8 The International HapMap resource,9,10 which includes information on millions of single-nucleotide polymorphisms (SNPs) genotyped in lymphoblastoid cell lines (LCLs) for the individuals included in HapMap, and the availability of these LCLs enable whole genome expression studies and characterization of the genetic contribution of the SNPs to the variation in gene expression observed between individuals.11 Common genetic variants accounting for interindividual differences in gene expression have been reported with the use of a panel of LCLs, derived from individuals of European ancestry from Utah, USA, collected by Centre d'Etude du Polymorphisme Humain (CEPH).8,12–14
However, population differences in gene expression have only recently begun to be investigated. Spielman et al. utilized a subset of human genes (∼4,200 expressed in LCLs and queried by the Affymetrix HG-Focus array), with samples derived from unrelated CEPH individuals from Utah, USA (CEU) and from Han Chinese individuals in Beijing and Japanese individuals in Tokyo (CHB/JPT), to demonstrate that cis-acting regulators may account for some of the population differences in gene expression,15 although Akey et al. suggested that batch effects could be a confounding factor when interpreting their results.16 Using the same microarray platform, Storey et al. showed that 17% of genes are differentially expressed between CEU individuals and Yoruba individuals from Ibadan, Nigeria (YRI) in a set of 16 unrelated samples.17 To comprehensively investigate the pattern of population differences in gene expression, we utilized the Affymetrix GeneChip Human Exon 1.0 ST Array (exon array), which contains ∼20,000 known human genes (∼1.4 million annotated and predicted exons corresponding to 17,879 transcript clusters with the core set of exons used), to study a set of HapMap samples consisting of 30 CEU and 30 YRI parents-offspring trios. Our goals were to determine gene-expression differences between these two populations, to identify what biological processes or pathways are enriched in the differentially expressed genes, and to evaluate the contribution of local and distant genetic variation to population differences in gene expression. Because of the fact that the Epstein-Barr virus (EBV)-transformation of LCLs from the CEU and the YRI samples occurred more than 20 years apart,10,18 certain nongenetic factors, such as the EBV strains used for transformation or the number of freeze/thaw cycles, could lead to differences in gene expression between these two populations. Therefore, we further evaluated a residual model that tested the contribution of genetic variation to gene-expression differences relative to other nongenetic factors.
Material and Methods
Cell Lines
HapMap9,10 cell lines (30 CEU trios and 30 YRI trios) were purchased from the Coriell Institute for Medical Research (Camden, NJ). The order in which the cell lines were processed was balanced with respect to population in an effort to minimize variation in growth conditions between populations (a potentially confounding factor). On the same day that ten YRI-population cell lines were received as live cultures from Coriell, a set of ten CEU lines were thawed at our facility; both sets were centrifuged at 400 × g to remove media. Five milliliters of lymphoblastoid cell medium (LCL medium) consisting of RPMI 1640 (Mediatech) supplemented with 1% l-glutamine (Mediatech) and 20% FBS (HyClone Laboratories, Lot # AQF24010) was added for the initial passage and then cells were passaged every 48 hr with LCL medium and 15% FBS. Cell suspensions were transferred to 25 cm2 flasks and incubated at 37°C in a 90% humidified, 5% CO2 atmosphere. Both sets of YRI and CEU lines were maintained for three passages at a concentration of 3.5–4.0 × 10⁵ cells/mL and, if viability was ≥85%, harvested after the fourth dilution from exponentially growing cells. Cell suspensions were spun at 400 × g for 5 min to remove media. Cell pellets were washed twice with ice-cold PBS (Invitrogen) and stored at −80°C. Two CEU samples (GM10855 and GM12236) were not available from Coriell at the time of the study. The viability of two lines (GM12716, GM18871) was below 85% at the sample-collection time and therefore excluded from further analysis. A total of 176 cell lines (87 CEU samples and 89 YRI samples) were included in this study.
RNA Isolation
Cell pellets were thawed and total RNA was extracted with QIAGEN Qiashredder and RNeasy plus kits (QIAGEN) according to the manufacturer's protocol. RNA concentration and purity was determined through measurement of A260/A280 ratios with the Spectronic Genesys 6 UV/Vis Spectrophotometer (Thermo Electron). Confirmation of RNA quality was assessed by use of the Agilent 2100 Bioanalyzer (Agilent Technologies). All 176 RNA samples had high quality and showed no signs of DNA contamination or RNA degradation. RNA samples were immediately frozen and stored at −80°C.
Chip Hybridization
For each cell line, ribosomal RNA was depleted from 1 μg of total RNA with the RiboMinus Human/Mouse Transcriptome Isolation kit (Invitrogen). cDNA was generated with the GeneChip WT cDNA Synthesis and Amplification Kit (Affymetrix) per manufacturer's instructions. cDNA was fragmented and end labeled with the GeneChip WT Terminal Labeling Kit (Affymetrix). Approximately 5.5 μg of labeled DNA target was hybridized to the Affymetrix GeneChip Human Exon 1.0 ST Array at 45°C for 16 hr per manufacturer's recommendation. Hybridized arrays were washed and stained on a GeneChip Fluidics Station 450 and scanned on a GCS3000 Scanner (Affymetrix). Previous studies using principal-component analysis (PCA) clustering on five technical replicates for each RNA sample, taken from three different passages from two cell lines, indicated that technical replicates group together very tightly.19 We did not perform replicates; however, data for technical replicates from the Affymetrix website indicates an average Pearson correlation coefficient of greater than 0.995 and a coefficient of variation of 7.2%.20
Data Filtering for SNPs in Probes, Signal Normalization, and Summarization
Expression arrays were analyzed with Partek GS Exon Array software (Partek, St. Louis, MO). The start and end coordinates of all probes represented on the exon array were queried and determined against the human genome (hg17). The coordinates for all SNPs were then queried in the dbSNP database (release 126) and used to identify probes harboring SNPs. In total, >400,000 probes within 255,676 unique probesets (of the ∼1.4 million probesets on the exon array) contained SNPs within their structures. Among these affected probesets, 105,000 harbored two or more probes with SNPs. These 105,000 probesets and their corresponding probes were then filtered from all samples. After filtering, individual probe intensities were background corrected, by subtraction of the median intensity of a population of nongenomic probes with the same GC content, to account for any nonspecific hybridization. The resulting probe signal intensities were quantile normalized over all 176 samples. Probeset-level expression signals were summarized with the robust multi-array average (RMA) method21. A constant of 16 was added to all probeset intensities for variance stabilization, and summarized signals were then log2 transformed with a median polish. We generated the expression signals of the 17,879 transcript clusters (gene-level) with the core set (i.e., with RefSeq-supported annotation) of exons used (∼200,000) by taking averages of all annotated probesets (exon-level) for each transcript cluster. We considered a transcript cluster to be reliably expressed in LCLs if the log2-transformed expression signal was > 6 in at least 90% of the 176 samples. 9156 transcript clusters met these criteria and were further analyzed.
Identifying Differentially Expressed Genes with the Westfall-Young Approach
We used the free step-down approach of Westfall-Young (W-Y approach),22 which is commonly known as a permutation-based family-wise error rate (FWER) correction approach, to identify differentially expressed transcript clusters between the CEU and YRI samples. The W-Y approach takes the dependence structure between genes into account, which is especially relevant when one is interested in genes that are involved in the same biological process or pathway. The basic test used is the standard pooled-variance t statistic. Because gene expression from individuals within the same trio may be correlated, trios were permuted between the CEU and YRI samples. The W-Y approach (10,000 permutations) was then used to compute simultaneous p values that control the overall error rate or FWER. This is equivalent to assuming that the trios are independent and that membership is defined at the trio-level. The transcript clusters with a significant permutation-adjusted p value (Pc < 0.01) were chosen for further analyses. The permutation-adjusted one-sided p values were calculated with the Permax 2.2 software, which was provided as a contributory library by Robert Gray in the R statistical package.23
Identifying Differentially Expressed Genes with a General Linear Model
We also used a general linear model constructed to reflect the trio relationships in our data to identify differentially expressed transcript clusters between the CEU and YRI samples. Trios were treated as units of analysis, and members of different families were considered independent. The covariance structure within a trio was modeled via a Toeplitz structure with two diagonal bands, with the trios ordered by father, offspring, then mother. With this covariance structure, mother and father gene-expression levels are independent but the offspring's value is allowed to covary with both the father's and the mother's values. In order to reduce the number of false-positive results, a Bonferroni correction (Pc < 0.05) was used. Differential genes with this stringent cutoff were used in further analysis. In addition to the Bonferroni correction, the less-conservative QVALUE24 (default settings, Pc < 0.01) was used to provide an estimate of the lower-bound proportion of true nulls (π0) for comparison. All models were programmed with the PROC MIXED procedure in SAS/STAT software version 9.1 (SAS Institute). The REPEATED statement was used to model the Toeplitz covariance structure.
Chromosomal Distribution of Differential Genes
Distribution of the transcript clusters differentially expressed between the CEU and YRI samples were tested against the null chromosomal distribution of the analysis set of 9156 core transcript clusters. Significant chromosomes were determined with binomial tests (Pc < 0.05 after Bonferroni correction). The chromosomal distribution of the differentially expressed transcript clusters was plotted with STRIPE.25
Cluster Analysis
For the genes that were found to differ in expression between the CEU and YRI samples, the Pearson correlation coefficients of the expression levels were computed for the 176 samples to represent pairwise similarity. The samples were then grouped by a hierarchical clustering algorithm26 using the average linkage method, which was implemented in the MeV:MultiExperiment Viewer (TIGR).
GO and KEGG Pathway Analyses
We used Onto-Express27–29 to identify enriched Gene Ontology (GO)30 biological processes among the differentially expressed genes. Only well-characterized genes (excluding hypothetical proteins) were included in the analysis. GO terms that were overrepresented relative to the analysis set of 9156 core transcript clusters (corresponding to 8498 well-characterized genes) were selected (three or more hits, binomial test Pc < 0.05 after Benjamini-Hochberg [BH] correction31). Similarly, enriched Kyoto Encyclopedia of Genes and Genomes (KEGG)32 pathways among the differentially expressed genes relative to the analysis set were identified by Pathway-Express27–29 (three hits or more, binomial test Pc < 0.05 after BH correction).
Fst Values
Fst, a metric representation of the effect of population subdivision, was estimated according to Wright's approximate formula, , where HT represents expected heterozygosity per locus of the total population and HS represents expected heterozygosity of a subpopulation.33 An Fst value was calculated for each SNP of interest with allele frequencies estimated from the unrelated individuals in each population.
Genotype Data for the HapMap Samples
SNP genotypes were downloaded from the International HapMap Project database (released July 21, 2006). SNPs with any Mendelian allele-transmission errors on 22 autosomes in the CEU or YRI samples were discarded to reduce the effect of possible genotyping errors. The final genotype dataset comprised 2,098,437 and 2,286,186 common SNPs (minor-allele frequency > 5%) in the CEU and YRI samples, respectively.
Identifying Local or Distant Genetic Variants that Regulate Gene Expression
The expression quantitative-trait loci (eQTLs) studies were analyzed with the QTDT software,34,35 which integrated SNPs and the differentially expressed transcript clusters between the CEU and YRI samples. The association study was carried out with gene expression in the CEU or YRI samples with gender as a covariate (QTDT p < 2.3 × 10⁻⁸, Pc < 0.05 after Bonferroni correction). We defined a gene as locally associated if the gene expression was associated with any SNP within 2.5 Mb on the same chromosome, whereas a gene was defined as distantly associated if the gene expression was associated with any SNP on different chromosomes or more than 2.5 Mb away on the same chromosome.
Evaluation of Genetic Variation and Nongenetic Factors Contributing to Population Differences in Expression
For a subset of moderate eQTLs (QTDT p < 0.001, including all local and distant high-frequency SNPs having at least two counts for each genotype), a reduced QTDT model was tested with gender as a covariate. Likelihood-ratio tests comparing the QTDT, with both population identity and gender as covariates, to the reduced QTDT were computed to test whether population identity remained a significant predictor of gene expression when the association between genotype and expression was modeled.
Results
Identifying Differentially Expressed Genes between Populations
Of the 9156 transcript clusters, 410 (4.5%) showed significantly different expression between the CEU and YRI samples by the t test-based W-Y approach (permutation-adjusted Pc < 0.01). Among these 410 transcript clusters, 156 had higher expression levels in the CEU samples and 254 had higher expression levels in the YRI samples. Of the 9156 transcript clusters, 464 (5.1%), including 156 with higher expression in CEU samples and 308 with higher expression in YRI samples, were found to be differentially expressed by the general linear model with a Toeplitz form for modeling parents-offspring trios (Pc < 0.05 after Bonferroni correction). With both of these independent statistical approaches used, 383 transcript clusters (4.2%) showed significantly different expression between the CEU and YRI samples (Table S1, available online). We found that 3136 genes (34%) were differential between the two populations at false discovery rate (FDR = 1%) by using the QVALUE software24 (Table S2). However, the 1% cutoff is somewhat arbitrary. By examining the entire set of p values, Storey et al. have shown that an estimate of the overall proportion of differentially expressed genes can be obtained without the requirement to set a subjective threshold.24 When doing this, we found that 67% of the genes were differentially expressed between the two populations (π0 = 0.33 with default settings of the QVALUE24 software). Possible explanations for the discrepancy between our estimate, obtained with QVALUE, and the proportion of differential genes reported by Storey et al.17 (17%) could be the much larger sample size used in our study and/or other nongenetic factors, which we tried to evaluate by testing a residual model.
Chromosomal Distribution of Differential Genes
Figure 1 shows the chromosomal distribution of these 383 transcript clusters. Although four chromosomes had nominally significant p values (p < 0.05), at Pc < 0.05 after Bonferroni correction chromosomes were not overrepresented or underrepresented relative to the null distribution of the transcript clusters in the analysis set.
Figure 1.
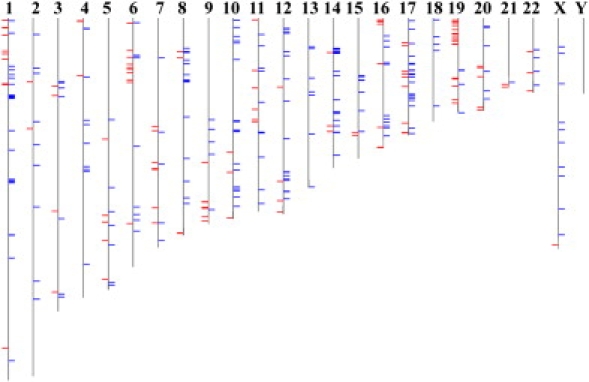
Chromosomal Distribution of Differentially Expressed Genes
The chromosomal distribution of the 383 transcript clusters differentially expressed between the CEU and YRI samples. 247 transcript clusters (blue) showed higher levels of expression in the YRI samples, whereas 136 transcript clusters (red) showed higher levels of expression in the CEU samples.
Cluster Analysis
Figure 2 shows the results of the cluster analysis on the 383 differential transcript clusters between the CEU and YRI samples. The cluster analysis grouped the 176 samples into two major distinguishable groups, in which the CEU samples were generally separated from the YRI samples with only a few exceptions. The cluster analysis results confirmed that the population identity was a deterministic variable for the differences in expression for these genes.
Figure 2.
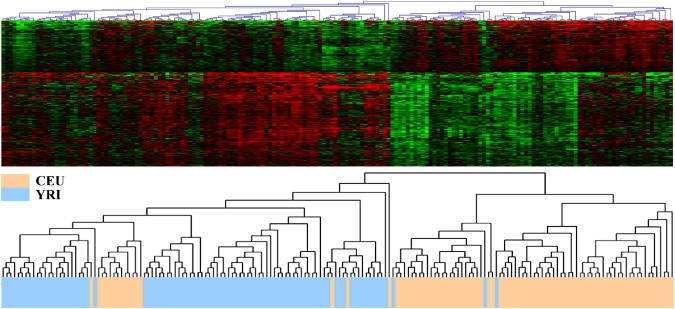
Clustering of Differentially Expressed Genes
Hierarchical clustering of the 383 differentially expressed transcript clusters (rows) and the 176 HapMap samples (columns). Red indicates higher expression and green indicates lower expression. The top panel is the two-way hierarchical clustering of the 383 transcript clusters and the 176 samples. The bottom panel is the tree view of the grouped samples. One of the two major distinguished groups consists of 71 CEU samples and 3 YRI samples, and the other group consists of 86 YRI samples and 16 CEU samples.
GO and KEGG Pathway Analyses
With the analysis set as background, two GO biological processes were found to be enriched in the 383 transcript clusters (corresponding to 388 well-characterized genes): ribosome biogenesis (p = 3.6 × 10⁻³, Pc < 0.05 after BH correction) and antimicrobial humoral response (sensu Vertebrata) (p = 2.7 × 10⁻³, Pc < 0.05 after BH correction) (Table 1). In contrast, at Pc < 0.05 no enriched KEGG pathways were identified in the differential genes.
Table 1.
Enriched Gene-Ontology Biological Processes in the Gene Differentially Expressed between the CEU and YRI Samples
| GO ID | Biological Process | Gene Symbol | Pa | Pcb |
|---|---|---|---|---|
| GO:7046 | ribosome biogenesis | BMS1L; GTPBP4; UTP14C; UTP14A | 0.00036 | 0.04 |
| GO:19735 | antimicrobial humoral response (sensu Vertebrata) | SH2B2; CXCR3; CCR7; MGST3; CD53; MASP2 | 0.0011 | 0.042 |
| GO:8033 | tRNA processing | PUS3; QTRT1; TRMU; TRUB1; WDR4 | 0.002 | 0.07 |
| GO:184 | mRNA catabolism, nonsense-mediated decay | UPT2; GSPT1; UPF3A | 0.0042 | 0.076 |
| GO:16337 | cell-cell adhesion | NPHP4; ICAM5; CD44 | 0.0081 | 0.01 |
Nominal p values.
Adjusted p values after BH correction.
Identifying Local or Distant Genetic Variants that Associate with Gene Expression
Association with >2,000,000 HapMap9,10 SNPs was evaluated in the CEU and YRI samples with the QTDT software.34,35 In CEU and YRI, we identified six and five transcript clusters, respectively, whose expression was shown to be correlated with local SNPs (p < 2.3 × 10⁻⁸, Pc < 0.05 after Bonferroni correction, Table S3). In addition, we identified 18 transcript clusters in CEU and 46 in YRI whose expression was shown to be correlated with distant SNPs (p < 2.3 × 10⁻⁸, Pc < 0.05 after Bonferroni correction, Table S3). Among all of these, two transcript clusters in CEU and three transcript clusters in YRI were shown to be associated with both local and distant SNPs. Some representative SNPs are shown in Table 2. Among the transcript clusters associated with local SNPs, three transcript clusters (LOC646836, HIST1H3B [MIM∗602819], SPATA20) (Figure 3) were found in both CEU and YRI samples.
Table 2.
Local and Distant eQTL Regions Associated with Differential Expression between the CEU and YRI Samples
| Affymetrix Transcript-Cluster ID | Symbol | eQTL Chromosome | eQTLRegion Starta | eQTL Region Enda | Mode | Number of SNPs in eQTL Regionb |
|---|---|---|---|---|---|---|
| 2336585 | LOC653511; SCP2 | 1 | 53058601 | 53210718 | CEU_local | 23 |
| 2576554 | LOC646836 | 2 | 131946053 | 131983007 | CEU_local | 12 |
| 2946215 | HIST1H3B | 6 | 25891888 | 26235250 | CEU_local | 50 |
| 3243262 | HSD17B7P2; LOC728924 | 10 | 37887922 | 38830434 | CEU_local | 50 |
| 3726569 | SPATA20 | 17 | 45980827 | 45991533 | CEU_local | 4 |
| 3757602 | LGP2 | 17 | 37510689 | 37547551 | CEU_local | 21 |
| 2576554 | LOC646836 | 2 | 131942868 | 132009907 | YRI_local | 10 |
| 2676009 | TWF2 | 3 | 52239947 | 52268899 | YRI_local | 5 |
| 2927722 | HEBP2 | 6 | 138734108 | 138771357 | YRI_local | 19 |
| 2946215 | HIST1H3B | 6 | 25990621 | 26232222 | YRI_local | 4 |
| 3726569 | SPATA20 | 17 | 45968836 | 45991533 | YRI_local | 7 |
| 2405893 | C1orf212 | 17 | 63001411 | 63003236 | CEU_distant | 2 |
| 2576554 | LOC646836 | 6 | 4013334 | 4014132 | CEU_distant | 2 |
| 3404436 | CLEC2D | 3 | 114568124 | 114583501 | CEU_distant | 2 |
| 3404436 | CLEC2D | 3 | 170414733 | 170425874 | CEU_distant | 3 |
| 3704495 | APRT | 3 | 56842045 | 56857103 | CEU_distant | 5 |
| 3726569 | SPATA20 | 5 | 57560034 | 57578585 | CEU_distant | 8 |
| 4011989 | CXCR3 | 1 | 61141307 | 61148816 | CEU_distant | 3 |
| 2342576 | ACADM | 2 | 156219672 | 156230250 | YRI_distant | 2 |
| 2676009 | TWF2 | 2 | 182593683 | 182634395 | YRI_distant | 5 |
| 2757347 | TMEM129 | 21 | 16516008 | 16517542 | YRI_distant | 3 |
| 2830861 | EGR1 | 13 | 20552246 | 20552534 | YRI_distant | 2 |
| 2830861 | EGR1 | 15 | 47728289 | 47738173 | YRI_distant | 5 |
| 2946215 | HIST1H3B | 5 | 37591074 | 37592683 | YRI_distant | 3 |
| 3119945 | GRINA | 16 | 79004853 | 79025950 | YRI_distant | 4 |
| 3138414 | ARMC1 | 2 | 22100308 | 22182977 | YRI_distant | 2 |
| 3150844 | SNTB1 | 6 | 55926914 | 55960696 | YRI_distant | 9 |
| 3430552 | PWP1 | 17 | 64946645 | 64949581 | YRI_distant | 2 |
| 3528115 | KIAA0737 | 3 | 83259569 | 83287824 | YRI_distant | 3 |
| 3528115 | KIAA0737 | 13 | 74765674 | 74769331 | YRI_distant | 2 |
| 3528115 | KIAA0737 | 16 | 69926323 | 69944391 | YRI_distant | 3 |
| 3528115 | KIAA0737 | 17 | 45912325 | 45921701 | YRI_distant | 3 |
| 3528115 | KIAA0737 | 21 | 21433634 | 21439258 | YRI_distant | 2 |
| 3597977 | TRIP4 | 12 | 100519345 | 100522642 | YRI_distant | 3 |
| 3726569 | SPATA20 | 10 | 51182135 | 51185540 | YRI_distant | 2 |
| 3755862 | IKZF3 | 8 | 53290604 | 53290675 | YRI_distant | 2 |
| 3755862 | IKZF3 | 10 | 106900641 | 106901321 | YRI_distant | 2 |
| 3774635 | FASN | 1 | 94702933 | 94744451 | YRI_distant | 2 |
| 3840058 | PPP2R1A | 4 | 139332786 | 139333979 | YRI_distant | 2 |
| 3850278 | TYK2 | 9 | 23187975 | 23209634 | YRI_distant | 3 |
indicates that SNP position information was from dbSNP version 126.
indicates that these eQTL regions contain at least two SNPs with internal distance less than 200 Kb; other eQTLs are shown in Table S3.
Figure 3.
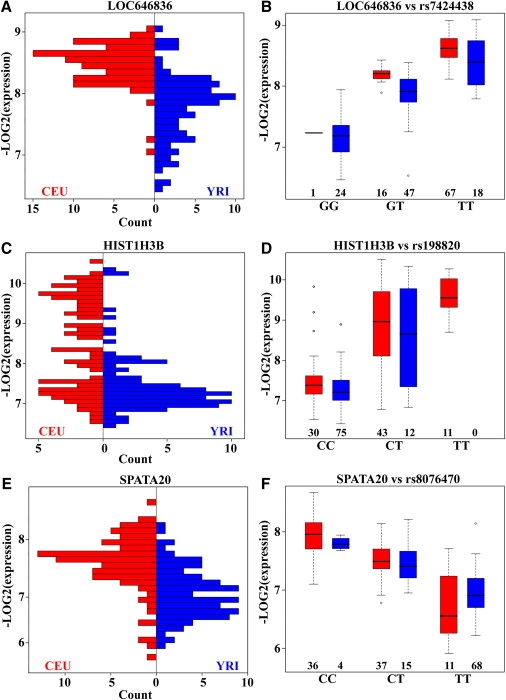
Gene Expression Regulated by Local eQTLs
Three differentially expressed genes are regulated by the same local eQTLs in CEU (red) and YRI (blue) populations.
(A) and (B) show that the higher expression of LOC646836 in CEU is regulated by SNP rs7424438 (Fst = 0.21).
(C) and (D) show that the higher expression of HIST1H3B in CEU is regulated by SNP rs198820 (Fst = 0.16).
(E) and (F) show that the higher expression of SPATA20 in CEU is regulated by rs8076470 (Fst = 0.22).
The numbers below the boxplots in (B), (D), and (F) are the genotype counts of the SNPs.
Discussion
The Affymetrix GeneChip Human Exon 1.0 ST Array was utilized to measure gene expression levels in EBV-transformed LCLs derived from 176 healthy individuals (CEU: 87 cell lines; YRI: 89 cell lines).10 Gene-level expressions were computed by the summarization of signals from well-annotated exons (core set) within each transcript cluster. To identify differentially expressed genes between the CEU and YRI samples, we compared the expression levels of 9156 transcript clusters that appeared to be reliably expressed. The proportion of expressed genes we defined is comparable to previous observations in LCLs.7 Using two independent statistical approaches, we identified 383 transcript clusters whose expression was significantly different between the CEU and YRI samples. A majority of the differential transcript clusters identified with the two approaches (93% for the W-Y approach and 83% for the linear model) were consistent. The W-Y approach considers dependence between genes when testing expression, whereas the general linear model approach accounts for the dependence between parents and offspring within each trio. The average absolute difference in mean expression levels was 1.26-fold, consistent with the previous data that the differences in gene expression level between populations, albeit significant, are not dramatic.17 Among these 383 transcript clusters, nine genes (DPYSL2 [MIM ∗602463], CTTN [MIM ∗164765], PLCG1 [MIM ∗172420], SS18 [MIM ∗600192], SH2B3 [MIM ∗605093], CPNE9, CMAH [MIM ∗603209], CXCR3 [MIM ∗300574], and MRPS7) were reported by Storey et al. in their top 50 differential gene list17 from 16 CEU and YRI samples.
One potential problem with the use of expression microarrays is that oligonucleotide hybridization could be affected by polymorphisms located within probes.36 It has been shown that sequence polymorphisms can result in many false positives when testing for cis eQTLs.37 The same effect was also observed in our exon-array expression data. For example, we detected a differential level of gene expression of HLA-DPB1 [MIM∗142858] between the CEU and YRI samples by using the unfiltered expression data. Further examination indicated that the genotype of SNP rs1042448 located in one of the probes at the 3′-UTR in HLA-DPB1 had a dramatic effect upon the overall expression of the gene. The “A” allele, which associated with lower HLA-DPB1 expression, has lower allele frequency in the CEU samples (Fst = 0.16) (Figure S1). However, previous studies did not consider this potentially confounding effect on the evaluation of gene expression.17 Thus, to prevent confounding interpretations of gene expression variation, we conservatively removed probesets that contained two or more probes harboring SNPs before summarizing expression.
One potential cause for the observed gene-expression differences between populations could be the influence of copy-number variation (CNV). We queried the Database for Genomic Variants,38,39 which contains the CNV data on the HapMap samples. We did not observe a higher percentage of CNVs among the 383 transcript clusters (12.5%, Table S1) as compared to the entire analysis set (12.7%). In other words, a majority of the differential transcript clusters we identified were not within genomic regions of known CNVs. Therefore, it is unlikely that CNV is a major contributor to the expression differences we observed, though the detailed contribution of CNVs to the differential expression at an individual level is not clear.
To further explore the biological functions of these differentially expressed genes, we searched the GO30 and KEGG32 databases for enriched biological processes or known pathways in the genes that are differentially expressed between these two populations. Two GO biological processes, ribosome biogenesis and antimicrobial humoral response (sensu Vertebrata), were found to be enriched in our gene set (Table 1). It has been reported that African Americans may be more susceptible to infection by certain bacteria than are individuals of European ancestry.40 Also, some genetic polymorphisms carried in the African-American population have been shown to lead to different antimicrobial response.41 Therefore, our findings that differentially expressed genes are enriched in antimicrobial humoral response could be used to evaluate these clinical observations. Using 16 samples, Storey et al. found that their differentially expressed genes were strongly enriched in inflammatory pathways17 and included two cytokine receptors (CCR7 [MIM∗600242] and CXCR3), which also showed up in our list. In addition, at a less-stringent cutoff (Pc < 0.10 after BH correction), three more GO biological processes were found to be enriched: cell-cell adhesion, mRNA catabolism (nonsense-mediated decay), and tRNA processing (Table 1). Interestingly, several of these systems might further modulate overall gene expression, making populations more similar or different. The fact that such biological processes as ribosomal biogenesis and tRNA processing are enriched in the differentially expressed genes suggests their possible roles in contribution to the population differences at a level higher than that of mRNA expression. Strikingly, a defect within a gene linked to a tRNA has been reported to contribute to a broad range of cell malfunctions that may lead to heart disease and stroke.42 At Pc < 0.05, a search for enriched KEGG pathways within our gene set did not identify any known pathways. When a more lenient cutoff of Pc < 0.20 after BH correction was used, one pathway, the Notch-signaling pathway (p = 0.004), was found to be enriched in the differential genes. The Notch-signaling pathway has a widespread role in development and has been associated with several human diseases, including many types of cancer.43 This pathway was also found by Storey et al. to be enriched in the top 10% of differential genes between CEU and YRI, but only when a nominally significant p value with no multiple test correction was used.17
We then evaluated the genetic contributions to the observed differences in expression between the CEU and YRI samples. We carried out a genome-wide eQTL analysis to identify the local and distant genetic variants that regulate the 383 transcript clusters' expression using the publicly available SNP markers from the International HapMap Project.9,10 Gene expression associated with any SNP within 2.5 Mb on the same chromosome was defined as locally associated, and gene expression associated with any SNP on a different chromosome or more than 2.5 Mb away on the same chromosome was defined as distantly associated. The Bonferroni correction provided us with a list of SNPs whose associations with differential expression were the most striking. Among the transcript clusters associated with local SNPs, three (LOC646836, HIST1H3B, SPATA20) were found in both CEU and YRI samples (Figure 3, Table 2). The allele-frequency-driven gene-expression difference between the CEU and YRI samples is further illustrated in Figure 3, which shows the relationship between some representative SNPs for the three locally associated transcript clusters and gene expression in both populations.
Because of the differences in cell-line collection time between the CEU and YRI samples,10,18 expression differences could be a combined effect of both genetic and nongenetic factors. In addition, culture conditions or batch-to-batch variation could influence the observed differences in gene expression between the two populations.16 Therefore, to reduce these variables, cell culture protocols were optimized and samples (CEU and YRI) were randomized when cultured and hybridized. We further tested whether population identity (which would include any effects due to collection-time differences) remained a significant predictor of gene expression when the association between genotype and expression was modeled. For a subset of moderate eQTLs (including all local SNPs and distant high-frequency SNPs having at least two counts for each genotype), with a less stringent cutoff than the previous QTDT test (p < 0.001), 360 differential transcript clusters were shown to be regulated by local and/or distant SNPs (Figure 4) with population identity no longer a significant predictor. In other words, a majority of the differential transcript clusters (94%) are not explained simply by population identity alone. While our results confirmed that common genetic variants account for a substantial fraction of the observed differences in gene expression, some nongenetic factors could still contribute to the observed population differences in gene expression in these samples. Previous studies have focused on cis-acting elements,17 but our results suggest that distant or trans-acting elements can also contribute substantially to the population differences in gene expression. Thus, it is possible that various cis- and trans-acting elements interact as part of a complete network of regulation of complex traits. Our findings of significant SNP and transcript cluster associations, therefore, can be targets for further functional validation to investigate these regulation mechanisms.
Figure 4.
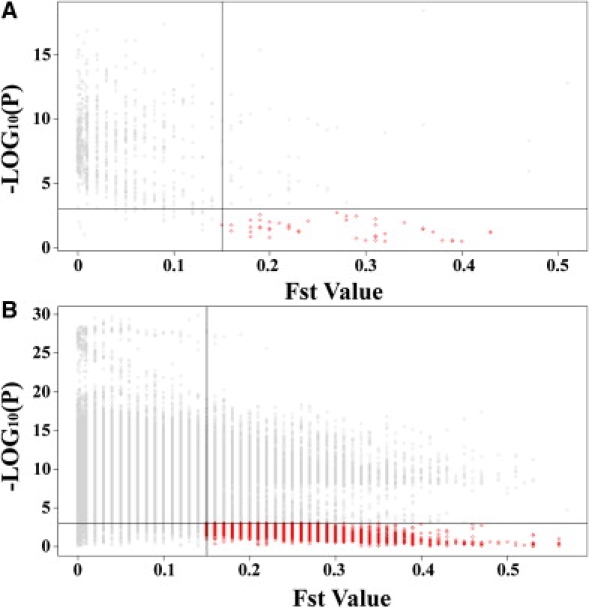
Evaluation of the Contribution of Nongenetic Factors to Gene-Expression Variation
A majority of the differential transcript clusters are not explained simply by population identity alone. Each point represents an association of an SNP with an expression phenotype. The y axis is the p value of the likelihood test (see Methods). The vertical line represents the Fst value cutoff (Fst = 0.15). The horizontal line represents the p value cutoff (p = 0.001).
(A) Red points indicate 19 transcript clusters whose expression levels are driven by allele frequency of local SNPs.
(B) Red points indicate 341 transcript clusters whose expression levels are driven by allele frequency of distant SNPs.
Impressively, both the two previous studies (Spielman et al. and Storey et al.) and the current study utilized the HapMap LCL samples and reported the contribution of common variants to the differential expression between populations. However, there were differences in study design (e.g., sample size, number of genes on chips, microarray technology,44 consideration of SNPs in probes, and different statistical approaches) that would account for the discrepancy in these studies. Although the reproducibility of the exon arrays is generally high,19,20 one limitation of this work is that technical replicates were not available for these samples, thus limiting our discussion to only sets of genes that are differentially expressed between populations. For a more comprehensive view of gene expression, one would need to consider interindividual and interpopulation variation together.
Supplemental Data
Supplemental data include one figure and three tables and can be found with this article online at http://www.ajhg.org/.
Supplemental Data
Web Resources
The URLs for data presented herein are as follows:
Affymetrix Exon Array manufactor's recommendation, http://www.affymetrix.com/products/arrays/exon_application.affx
Coriell Institute of Medical Research, http://locus.umdnj.edu/nigms/
Database for Genomic Variants, http://projects.tcag.ca/variation
dbSNP database, http://www.ncbi.nlm.nih.gov/projects/SNP/
Gene Expression Omnibus (GEO), http://www.ncbi.nlm.nih.gov/geo/
GO database, http://www.geneontology.org/
HapMap project, http://www.hapmap.org
KEGG database, http://www.genome.jp/kegg/
MultiExperiment Viewer, http://www.tm4.org/mev.html
Online Mendelian Inheritance in Man (OMIM), http://www.ncbi.nlm.nih.gov/Omim/
Onto-Express, http://vortex.cs.wayne.edu/ontoexpress
Pharmacogenics and Pharmacogenics Knowledge Base, http://www.pharmgkb.org
Accession Numbers
The accession number for the gene-expression data deposited in Gene Expression Omnibus is GSE7851. The accession number for the phenotype data deposited into the Pharmacogenetics and Pharmacogenomics Knowledge Base is PS206983.
Acknowledgments
This Pharmacogenetics of Anticancer Agents Research (PAAR) Group study was supported by grants from the National Insitutes of Health: National Institute of General Medical Sciences (GM61393 and GM61374). We are grateful to Dr. Anna Di Rienzo, Cheryl A. Roe, and Dr. Sunita J. Shukla for helpful discussions and to Dr. Jeong-Ah Kang for maintaining cell lines. We are also grateful to Dr. Jacek Majewski of McGill University, Canada for providing us with the list of exon-array probes containing dbSNPs. T.A.C., T.X.C., A.C.S., and J.E.B. are employees of Affymetrix, Inc.
References
- 1.Ioannidis J.P., Ntzani E.E., Trikalinos T.A. ‘Racial’ differences in genetic effects for complex diseases. Nat. Genet. 2004;36:1312–1318. doi: 10.1038/ng1474. [DOI] [PubMed] [Google Scholar]
- 2.Huang R.S., Kistner E.O., Bleibel W.K., Shukla S.J., Dolan M.E. Effect of population and gender on chemotherapeutic agent-induced cytotoxicity. Mol. Cancer Ther. 2007;6:31–36. doi: 10.1158/1535-7163.MCT-06-0591. [DOI] [PMC free article] [PubMed] [Google Scholar]
- 3.Bowen R.L., Stebbing J., Jones L.J. A review of the ethnic differences in breast cancer. Pharmacogenomics. 2006;7:935–942. doi: 10.2217/14622416.7.6.935. [DOI] [PubMed] [Google Scholar]
- 4.Calvo E., Baselga J. Ethnic differences in response to epidermal growth factor receptor tyrosine kinase inhibitors. J. Clin. Oncol. 2006;24:2158–2163. doi: 10.1200/JCO.2006.06.5961. [DOI] [PubMed] [Google Scholar]
- 5.Falkner B. Differences in blacks and whites with essential hypertension: Biochemistry and endocrine. State of the art lecture. Hypertension. 1990;15:681–686. doi: 10.1161/01.hyp.15.6.681. [DOI] [PubMed] [Google Scholar]
- 6.Schadt E.E., Monks S.A., Drake T.A., Lusis A.J., Che N., Colinayo V., Ruff T.G., Milligan S.B., Lamb J.R., Cavet G. Genetics of gene expression surveyed in maize, mouse and man. Nature. 2003;422:297–302. doi: 10.1038/nature01434. [DOI] [PubMed] [Google Scholar]
- 7.Cheung V.G., Conlin L.K., Weber T.M., Arcaro M., Jen K.Y., Morley M., Spielman R.S. Natural variation in human gene expression assessed in lymphoblastoid cells. Nat. Genet. 2003;33:422–425. doi: 10.1038/ng1094. [DOI] [PubMed] [Google Scholar]
- 8.Cheung V.G., Jen K.Y., Weber T., Morley M., Devlin J.L., Ewens K.G., Spielman R.S. Genetics of quantitative variation in human gene expression. Cold Spring Harb. Symp. Quant. Biol. 2003;68:403–407. doi: 10.1101/sqb.2003.68.403. [DOI] [PubMed] [Google Scholar]
- 9.International HapMap Consortium A haplotype map of the human genome. Nature. 2005;437:1299–1320. doi: 10.1038/nature04226. [DOI] [PMC free article] [PubMed] [Google Scholar]
- 10.International HapMap Consortium The International HapMap Project. Nature. 2003;426:789–796. doi: 10.1038/nature02168. [DOI] [PubMed] [Google Scholar]
- 11.Forton J.T., Kwiatkowski D.P. Searching for the regulators of human gene expression. Bioessays. 2006;28:968–972. doi: 10.1002/bies.20466. [DOI] [PubMed] [Google Scholar]
- 12.Morley M., Molony C.M., Weber T.M., Devlin J.L., Ewens K.G., Spielman R.S., Cheung V.G. Genetic analysis of genome-wide variation in human gene expression. Nature. 2004;430:743–747. doi: 10.1038/nature02797. [DOI] [PMC free article] [PubMed] [Google Scholar]
- 13.Cheung V.G., Spielman R.S., Ewens K.G., Weber T.M., Morley M., Burdick J.T. Mapping determinants of human gene expression by regional and genome-wide association. Nature. 2005;437:1365–1369. doi: 10.1038/nature04244. [DOI] [PMC free article] [PubMed] [Google Scholar]
- 14.Stranger B.E., Forrest M.S., Clark A.G., Minichiello M.J., Deutsch S., Lyle R., Hunt S., Kahl B., Antonarakis S.E., Tavare S. Genome-wide associations of gene expression variation in humans. PLoS Genet. 2005;1:e78. doi: 10.1371/journal.pgen.0010078. [DOI] [PMC free article] [PubMed] [Google Scholar]
- 15.Spielman R.S., Bastone L.A., Burdick J.T., Morley M., Ewens W.J., Cheung V.G. Common genetic variants account for differences in gene expression among ethnic groups. Nat. Genet. 2007;39:226–231. doi: 10.1038/ng1955. [DOI] [PMC free article] [PubMed] [Google Scholar]
- 16.Akey J.M., Biswas S., Leek J.T., Storey J.D. On the design and analysis of gene expression studies in human populations. Nat. Genet. 2007;39:807–808. doi: 10.1038/ng0707-807. [DOI] [PubMed] [Google Scholar]
- 17.Storey J.D., Madeoy J., Strout J.L., Wurfel M., Ronald J., Akey J.M. Gene-expression variation within and among human populations. Am. J. Hum. Genet. 2007;80:502–509. doi: 10.1086/512017. [DOI] [PMC free article] [PubMed] [Google Scholar]
- 18.Dausset J., Cann H., Cohen D., Lathrop M., Lalouel J.M., White R. Centre d'etude du polymorphisme humain (CEPH): Collaborative genetic mapping of the human genome. Genomics. 1990;6:575–577. doi: 10.1016/0888-7543(90)90491-c. [DOI] [PubMed] [Google Scholar]
- 19.Kwan T., Benovoy D., Dias C., Gurd S., Serre D., Zuzan H., Clark T.A., Schweitzer A., Staples M.K., Wang H. Heritability of alternative splicing in the human genome. Genome Res. 2007;17:1210–1218. doi: 10.1101/gr.6281007. [DOI] [PMC free article] [PubMed] [Google Scholar]
- 20.Affymetrix Inc. (2007). Human Gene 1.0 ST Array Performance. Affymetrix GeneChip Gene and Exon Array Whitepaper Collection. http://www.affymetrix.com/support/technical/whitepapers/hugene_perf_whitepaper.pdf.
- 21.Irizarry R.A., Hobbs B., Collin F., Beazer-Barclay Y.D., Antonellis K.J., Scherf U., Speed T.P. Exploration, normalization, and summaries of high density oligonucleotide array probe level data. Biostatistics. 2003;4:249–264. doi: 10.1093/biostatistics/4.2.249. [DOI] [PubMed] [Google Scholar]
- 22.Westfall P.H., Young S.S. Wiley Publishers; New York: 1993. Resampling-Based Multiple Testing: Examples and Methods for p-Value Adjustment. [Google Scholar]
- 23.R Development Core Team (2005). R: A language and environment for statistical computing. (Vienna, Austria: R Foundation for Statistical Computing). http://www.R-project.org.
- 24.Storey J.D., Tibshirani R. Statistical significance for genomewide studies. Proc. Natl. Acad. Sci. USA. 2003;100:9440–9445. doi: 10.1073/pnas.1530509100. [DOI] [PMC free article] [PubMed] [Google Scholar]
- 25.Ghai R., Lindemann H., Chakraborty T. Integrated functional visualization of eukaryotic genomes. BMC Bioinformatics. 2006;7:348. doi: 10.1186/1471-2105-7-348. [DOI] [PMC free article] [PubMed] [Google Scholar]
- 26.Eisen M.B., Spellman P.T., Brown P.O., Botstein D. Cluster analysis and display of genome-wide expression patterns. Proc. Natl. Acad. Sci. USA. 1998;95:14863–14868. doi: 10.1073/pnas.95.25.14863. [DOI] [PMC free article] [PubMed] [Google Scholar]
- 27.Draghici S., Khatri P., Bhavsar P., Shah A., Krawetz S.A., Tainsky M.A. Onto-Tools, the toolkit of the modern biologist: Onto-Express, Onto-Compare, Onto-Design and Onto-Translate. Nucleic Acids Res. 2003;31:3775–3781. doi: 10.1093/nar/gkg624. [DOI] [PMC free article] [PubMed] [Google Scholar]
- 28.Khatri P., Bhavsar P., Bawa G., Draghici S. Onto-Tools: An ensemble of web-accessible, ontology-based tools for the functional design and interpretation of high-throughput gene expression experiments. Nucleic Acids Res. 2004;32:W449–W456. doi: 10.1093/nar/gkh409. [DOI] [PMC free article] [PubMed] [Google Scholar]
- 29.Draghici S., Khatri P., Martins R.P., Ostermeier G.C., Krawetz S.A. Global functional profiling of gene expression. Genomics. 2003;81:98–104. doi: 10.1016/s0888-7543(02)00021-6. [DOI] [PubMed] [Google Scholar]
- 30.Ashburner M., Ball C.A., Blake J.A., Botstein D., Butler H., Cherry J.M., Davis A.P., Dolinski K., Dwight S.S., Eppig J.T. Gene ontology: Tool for the unification of biology. The Gene Ontology Consortium. Nat. Genet. 2000;25:25–29. doi: 10.1038/75556. [DOI] [PMC free article] [PubMed] [Google Scholar]
- 31.Benjamini Y., Hochberg Y. Controlling the false discovery rate: A practical and powerful approach to multiple testing. Journal of the Royal Statistical Society B. 1995;57:289–300. [Google Scholar]
- 32.Kanehisa M., Goto S., Kawashima S., Okuno Y., Hattori M. The KEGG resource for deciphering the genome. Nucleic Acids Res. 2004;32:D277–D280. doi: 10.1093/nar/gkh063. [DOI] [PMC free article] [PubMed] [Google Scholar]
- 33.Wright S. Genetical structure of populations. Nature. 1950;166:247–249. doi: 10.1038/166247a0. [DOI] [PubMed] [Google Scholar]
- 34.Abecasis G.R., Cardon L.R., Cookson W.O. A general test of association for quantitative traits in nuclear families. Am. J. Hum. Genet. 2000;66:279–292. doi: 10.1086/302698. [DOI] [PMC free article] [PubMed] [Google Scholar]
- 35.Abecasis G.R., Cookson W.O., Cardon L.R. Pedigree tests of transmission disequilibrium. Eur. J. Hum. Genet. 2000;8:545–551. doi: 10.1038/sj.ejhg.5200494. [DOI] [PubMed] [Google Scholar]
- 36.Gilad Y., Rifkin S.A., Bertone P., Gerstein M., White K.P. Multi-species microarrays reveal the effect of sequence divergence on gene expression profiles. Genome Res. 2005;15:674–680. doi: 10.1101/gr.3335705. [DOI] [PMC free article] [PubMed] [Google Scholar]
- 37.Alberts R., Terpstra P., Li Y., Breitling R., Nap J.P., Jansen R.C. Sequence polymorphisms cause many false cis eQTLs. PLoS ONE. 2007;2:e622. doi: 10.1371/journal.pone.0000622. [DOI] [PMC free article] [PubMed] [Google Scholar]
- 38.Iafrate A.J., Feuk L., Rivera M.N., Listewnik M.L., Donahoe P.K., Qi Y., Scherer S.W., Lee C. Detection of large-scale variation in the human genome. Nat. Genet. 2004;36:949–951. doi: 10.1038/ng1416. [DOI] [PubMed] [Google Scholar]
- 39.Redon R., Ishikawa S., Fitch K.R., Feuk L., Perry G.H., Andrews T.D., Fiegler H., Shapero M.H., Carson A.R., Chen W. Global variation in copy number in the human genome. Nature. 2006;444:444–454. doi: 10.1038/nature05329. [DOI] [PMC free article] [PubMed] [Google Scholar]
- 40.Noble R.C., Miller B.R. Auxotypes and antimicrobial susceptibilities of Neisseria gonorrhoeae in black and white patients. Br. J. Vener. Dis. 1980;56:26–30. doi: 10.1136/sti.56.1.26. [DOI] [PMC free article] [PubMed] [Google Scholar]
- 41.Jordan W.J., Eskdale J., Lennon G.P., Pestoff R., Wu L., Fine D.H., Gallagher G. A non-conservative, coding single-nucleotide polymorphism in the N-terminal region of lactoferrin is associated with aggressive periodontitis in an African-American, but not a Caucasian population. Genes Immun. 2005;6:632–635. doi: 10.1038/sj.gene.6364239. [DOI] [PubMed] [Google Scholar]
- 42.Wilson F.H., Hariri A., Farhi A., Zhao H., Petersen K.F., Toka H.R., Nelson-Williams C., Raja K.M., Kashgarian M., Shulman G.I. A cluster of metabolic defects caused by mutation in a mitochondrial tRNA. Science. 2004;306:1190–1194. doi: 10.1126/science.1102521. [DOI] [PMC free article] [PubMed] [Google Scholar]
- 43.Ehebauer M., Hayward P., Martinez-Arias A. Notch signaling pathway. Sci. STKE. 2006;2006:cm7. doi: 10.1126/stke.3642006cm7. [DOI] [PubMed] [Google Scholar]
- 44.Kapur K., Xing Y., Ouyang Z., Wong W.H. Exon arrays provide accurate assessments of gene expression. Genome Biol. 2007;8:R82. doi: 10.1186/gb-2007-8-5-r82. [DOI] [PMC free article] [PubMed] [Google Scholar]
Associated Data
This section collects any data citations, data availability statements, or supplementary materials included in this article.