

Abstract
Accurate estimates of mitochondrial substitution rates are central to molecular studies of human evolution, but meaningful comparisons of published studies are problematic because of the wide range of methodologies and data sets employed. These differences are nowhere more pronounced than among rates estimated from phylogenies, genealogies, and pedigrees. By using a data set comprising mitochondrial genomes from 177 humans, we estimate substitution rates for various data partitions by using Bayesian phylogenetic analysis with a relaxed molecular clock. We compare the effect of multiple internal calibrations with the customary human-chimpanzee split. The analyses reveal wide variation among estimated substitution rates and divergence times made with different partitions and calibrations, with evidence of substitutional saturation, natural selection, and significant rate heterogeneity among lineages and among sites. Collectively, the results support dates for migration out of Africa and the common mitochondrial ancestor of humans that are considerably more recent than most previous estimates. Our results also demonstrate that human mitochondrial genomes exhibit a number of molecular evolutionary complexities that necessitate the use of sophisticated analytical models for genetic analyses.
Introduction
Understanding the time-frame of human evolution and migration is one of the most prominent goals of genetic analysis. A detailed and accurate knowledge of this time scale is critical for investigation of our evolutionary and demographic history,1,2 our relationships to other hominids,3–5 and our impact on the natural world.6,7 A critical component of these studies is the magnitude of the substitution rate employed in the calculation of divergence times with mitochondrial DNA (mtDNA), but prevailing uncertainties have hindered the development of any clear genetic-based consensus on the chronology of major events in human prehistory.
To date, few molecular estimates of the rate and time scale of human evolution have been made in a satisfactorily rigorous and comprehensive manner. Instead, the literature is characterized by the propagation of standard substitution rates for different mitochondrial-genome sections,8,9 which are not readily comparable because of differences in the methodologies and data sets employed in the estimation of them. Additionally, they are sometimes treated as errorless values without due consideration of associated uncertainty, which is often considerable in its magnitude. Given the importance of both mitochondrial protein-coding and D loop data for dating and demographic modeling, the production of substitution-rate estimates for various parts of the mitochondrial genome, with a standard methodology on a representative data set, is overdue.
Previous analyses of human mtDNA have employed a variety of calibration methods. Typically, substitution-rate estimates have been made with recourse to the human-chimpanzee calibration,4,8,10,11 but recent evidence12–15 has strengthened previous suspicions16 that adoption of a series of archaeological or biogeographic calibration points within the human tree is preferable.17 First, the antiquity of the split suggests that there is a high probability of saturation occurring within the D loop because of its elevated rate of mutation,18,19 which is especially pertinent to analyses of the hypervariable regions.20 Second, it is likely that there are differences in microevolutionary processes between the two species, leading to incongruent substitution patterns and rates.16,21,22 Third, human sequences have evolved on a genealogical scale, whereas the divergence between chimpanzees and humans relates to a phylogenetic time frame.14,23
Disparate substitution rates are observed on these different time scales when molecular evolution is proceeding in a nonneutral manner, because the differences observed among intraspecific sequences in a genealogy represent segregating sites, whereas interspecific differences in a phylogeny represent substitutions.14 Deeper calibration points generally yield slower estimates of substitution rates because of a reduced contribution from segregating sites to overall genetic divergence;12 in turn, this leads to a positive correlation between calibration age and the estimated time to the most recent common ancestor (TMRCA) of humans (Figure 1). This effect is compounded with the estimation bias introduced by sequence saturation, which might not be accounted for even with a correction for multiple hits.24,25 In view of this time dependency of rates, it is preferable to employ calibration points located within the human tree.13,14 It is also important to use a method that can explicitly accommodate variation in the substitution rate among lineages and among sites.20,22,25,26
Figure 1.
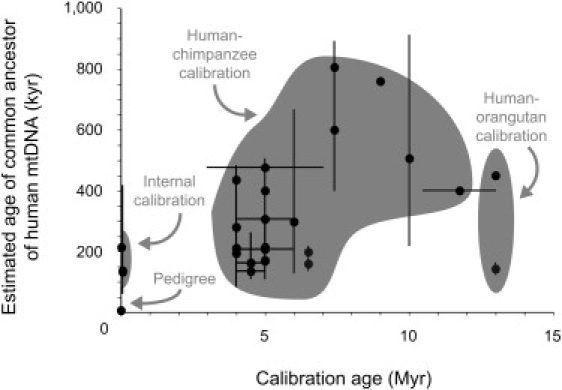
Simple Plot Showing the Positive Correlation between Calibration Age and the Estimated Age of the Most Recent Common Ancestor of Human mtDNA
Data points represent results from published studies, of which a full list is given in Table S1. Horizontal error bars (denoting uncertainty in calibration age) and vertical error bars (denoting uncertainty in molecular date estimates) are based on values quoted in the published studies.
In this paper, we present a comprehensive set of Bayesian phylogenetic analyses of 177 human mitochondrial genomes. The model-based approach allows for the accommodation of among-site rate heterogeneity, and by adopting a Bayesian phylogenetic framework, we are able to obtain posterior distributions of substitution rates and divergence times by using various partitions of the mitochondrial genome. By using relaxed-clock analysis, we contrast the effects of using external (human-chimpanzee) and internal (biogeographic) calibrations. The latter are based on mitochondrial haplogroups that are associated with well-attested archaeological dates for human settlement of (1) Australia and Island Melanesia and (2) postglacial Europe. The TMRCA of human mtDNA is estimated by the inclusion of representatives from the deepest rooting African mitochondrial clades. We compare the results to previous estimates of pedigree, genealogical, and phylogenetic rates for both the D loop and protein-coding regions of human mtDNA.
Material and Methods
Data Set
Complete mitochondrial genome sequences were obtained from GenBank for 177 humans and two chimpanzees (Table 1; GenBank accession numbers listed in Table S2 available online). Genomes were selected for their sequence accuracy27,28 and for representation of both African (haplogroups L0, L1, and L2) and non-African (haplogroups M and N) mitochondrial DNA; the size of the data set was limited so that computational tractability could be maintained. Sequences were manually aligned with the revised Cambridge Reference Sequence29,30 (CRS). Various subsets of this alignment were used for analysis: (1) D loop (sites 16,027–16,576 of CRS31), (2) hypervariable sequence 1 (HVS1; sites 16024–1640132), (3) hypervariable sequence 2 (HVS2; sites 29–40832), (4) loop regions of the two ribosomal RNA (rRNA) genes (12S and 16S), (5) first and second codon sites of protein-coding genes (PC1+2), (6) third codon sites of protein-coding genes (PC3), and (7) a concatenated, partitioned alignment of D loop, rRNA, PC1+2, and PC3. Remaining sections of the aligned genomes, including intergenic sites, rRNA stems, and transfer RNA genes, were discarded. Overlapping portions of protein-coding genes were also removed. The ND6 gene was excluded from all analyses because of its unusual patterns of substitutions and nucleotide composition, which result from its situation on the heavy strand of the mitochondrial genome.33
Table 1.
Summary of Sequences Analyzed in This Study
| Haplogroup | Individuals |
|---|---|
| E | 2 |
| H | |
| H1 | 11 |
| H3 | 9 |
| I | 1 |
| L | |
| L0 | 5 |
| L1 | 11 |
| L2 | 7 |
| M | |
| M27 | 7 |
| M28 | 4 |
| M29 | 4 |
| M31 | 10 |
| M32 | 3 |
| Other | 28 |
| N | 5 |
| O | 1 |
| P | 18 |
| Q | 11 |
| R | 19 |
| S | 9 |
| U | 9 |
| W | 3 |
| Total | 177 |
As a preliminary step, we investigated two potential sources of homoplasy in the alignments. First, differences in base composition between humans and chimpanzees were assessed with a chi-square test. Second, substitutional saturation in each of the six alignments was investigated with the software reticulate.34 This software is designed to investigate compatibility; two sites are defined as compatible if the observed variation at those sites can be parsimoniously explained with the same tree. This is done by the calculation of compatibility scores, which range from 0 (all sites are mutually incompatible) to 1 (all sites are mutually compatible). Lower scores are indicative of multiple substitutions, either in the form of parallel or superimposed changes, thereby reflecting the occurrence of saturation in the alignment.
Estimation of Substitution Rates and Divergence Times
For the estimation of substitution rates and divergence times from each alignment, Bayesian phylogenetic analysis was performed with BEAST 1.4.635 in a relaxed-clock framework.36 Substitution-model selection was performed for each of the six data partitions by comparison of Akaike Information Criterion scores in Modeltest 3.7.37 In the analyses of the concatenated alignment, a separate substitution model was used for each partition. In order to minimize prior assumptions about demographic history, which is treated as a nuisance parameter in this analysis, we adopted a Bayesian skyline plot approach in order to integrate over different coalescent histories.38 Rate variation among sites was modeled with a discrete gamma distribution with six rate categories. In the relaxed-molecular-clock model, rates were assumed to be a priori uncorrelated between neighboring branches and to follow a lognormal distribution (this model is described in detail by Drummond et al.36). The uncorrelated lognormal model allows two statistics to be obtained in the analysis: the coefficient of variation of rates, which measures the degree of departure from a global molecular clock, and the covariance of rates, which measures the amount of rate autocorrelation between neighboring branches in the tree.
Posterior distributions of parameters, including divergence times and substitution rates, were estimated by Markov chain Monte Carlo (MCMC) sampling in BEAST. In each analysis, samples were drawn every 10,000 MCMC steps from a total of 30,000,000 steps, after a discarded burn-in of 3,000,000 steps. Convergence to the stationary distribution and sufficient sampling were checked by inspection of posterior samples.
Calibrations
Each alignment was analyzed once with internal calibration and once with external calibration. Internal calibration was conducted by specifying priors on the ages of three nodes in the tree. On the basis of the earliest, well-supported dates for entry into Australia and New Guinea,39,40 the TMRCA of haplogroup P was assumed to follow a lognormal distribution, with a minimum of 40,000 years, with a mean of 45,000 years, and with 95% of the distribution lying between 40,000 and 55,000 years. The TMRCAs of haplogroups H1 and H3 were each assumed to follow a normal distribution with a mean of 18,000 years and standard deviation of 3,500 years;41,42 approximately 95% of the distribution lies between 11,000 and 25,000 years. These calibrations are based on the assumption that H1 and H3 underwent postglacial expansion, which would place an upper limit on the ages of their common ancestors. Nevertheless, we chose to describe these calibrations with a distribution that allows for bidirectional uncertainty,43 in order to allow for a scenario in which the basal genetic divergences within each clade might have antedated glacial retreat and the subsequent population expansion.
External calibration was conducted by specification of a prior on the age of the human-chimpanzee split, which was assumed to follow a lognormal distribution with a minimum of 5 million years (Myr), a mean of 6 Myr, and with 95% of the distribution lying between 5 and 7.5 Myr. These values were chosen for consistency with previous studies and information from the fossil record.44
Detecting Selection
In order to investigate the impact of natural selection on human mtDNA, we analyzed a concatenated data set containing the 12 protein-coding genes (excluding the ND6 gene) from the 177 mitochondrial genomes described above. To scan for sites under selection, we analyzed the alignment with the Single Likelihood Ancestor Counting method implemented in HyPhy.45 A site was regarded as being under selection if the ratio of rates of nonsynonymous to synonymous mutations (dN:dS) was significantly different from 1.0, a value that implies neutrality. Significance was assessed with a cutoff of 0.05. The tree inferred from the alignment of concatenated D loop, rRNA, PC1+2, and PC3 was used as a fixed topology.
We then investigated variation in dN:dS values among branches by allowing all internal branches to share one dN:dS value and all external (terminal) branches to share a second dN:dS value. A higher dN:dS in external compared with internal branches is consistent with the action of negative (purifying) selection.
Results
There was no evidence of differences in base composition between humans and chimpanzees. The largest observed compositional difference was in HVS1, but it was not significant (p = 0.79). The compatibility analysis produced evidence of some degree of saturation in all of the alignments (Table 2). There was a substantial reduction in the compatibility score for HVS1 when the two chimpanzee sequences were added to the alignment, which is a strong indication of the detrimental impact of substitutional saturation.
Table 2.
Phylogenetic Compatibility Scores for Six Mitochondrial Alignments
| Alignment | Compatibility Score |
|
|---|---|---|
| Humans Only | Humans and Chimpanzees | |
| PC1+2 | 0.947 | 0.971 |
| PC3 | 0.952 | 0.957 |
| rRNA (loops) | 0.965 | 0.946 |
| D-loop | 0.827 | 0.802 |
| HVS1 | 0.813 | 0.731 |
| HVS2 | 0.811 | 0.811 |
The different mitochondrial alignments yielded a diverse range of estimates for substitution rates, divergence times, and among-lineage rate heterogeneity (Table 3). The nodes used for internal calibration were poorly supported in the rRNA and D loop analyses, including those of HVS1 and HVS2, with generally poor resolution throughout the tree topology. Consequently, estimates of substitution rates and divergence times are not presented here for these analyses, although we are able to present the rates inferred from these data partitions in the analyses of concatenated data (Table 3).
Table 3.
Parameter Estimates for Various Mitochondrial Alignments from 177 Humans and Two Chimpanzees
| Descriptiona | Length (bp) | Substitution Rate (Subs/Site/Year)b |
Age of Human mtDNA Ancestor (kyr) |
||
|---|---|---|---|---|---|
| Mean | (95% HPD) | Mean | (95% HPD) | ||
| Humans Only (Internal Calibration) | |||||
| Concatenatedc | 11,940 | 9.66 × 10⁻⁸ | (7.35 × 10⁻⁸–1.16 × 10⁻⁷) | 108 | (82–134) |
| D loop | 1,143 | 3.02 × 10⁻⁷ | (2.23 × 10⁻⁷–3.73 × 10⁻⁷) | ||
| rRNA | 1,448 | 2.21 × 10⁻⁸ | (1.33 × 10⁻⁸–3.24 × 10⁻⁸) | ||
| PC1+2 | 7,198 | 1.11 × 10⁻⁸ | (7.23 × 10⁻⁹–1.53 × 10⁻⁸) | ||
| PC3 | 3,599 | 5.09 × 10⁻⁸ | (3.44 × 10⁻⁸–6.80 × 10⁻⁸) | ||
| PC1+2 | 7,198 | 1.30 × 10⁻⁸ | (1.01 × 10⁻⁸–1.58 × 10⁻⁸) | 79 | (60–106) |
| PC3 | 3,599 | 5.16 × 10⁻⁸ | (4.02 × 10⁻⁸–6.31 × 10⁻⁸) | 112 | (76–151) |
| Humans and Chimpanzees (External Calibration) | |||||
| Concatenated | 11,940 | 6.81 × 10⁻⁸ | (5.48 × 10⁻⁸–8.08 × 10⁻⁸) | 162 | (122–213) |
| D loop | 1,143 | 2.13 × 10⁻⁷ | (1.66 × 10⁻⁷–2.60 × 10⁻⁷) | ||
| rRNA | 1,448 | 1.51 × 10⁻⁸ | (9.69 × 10⁻⁹–2.20 × 10⁻⁸) | ||
| PC1+2 | 7,198 | 6.60 × 10⁻⁹ | (4.41 × 10⁻⁹–8.89 × 10⁻⁹) | ||
| PC3 | 3,599 | 3.79 × 10⁻⁸ | (2.72 × 10⁻⁸–5.04 × 10⁻⁸) | ||
| PC1+2 | 7,198 | 3.82 × 10⁻⁹ | (2.44 × 10⁻⁹–5.06 × 10⁻⁹) | 310 | (158–508) |
| PC3 | 3,599 | 4.84 × 10⁻⁸ | (3.18 × 10⁻⁸–6.31 × 10⁻⁸) | 133 | (78–209) |
Alignments given in indented italics denote partitions of the concatenated alignment; the estimates for these partitions were obtained indirectly. The mean rate estimate for each partition was obtained by multiplication of the mean rate for the whole concatenated alignment (first row) by the relative rate of the partition. The lower bound of the 95% HPD was obtained by multiplication of the lower 95% HPD bound on the mean concatenated rate by the lower 95% HPD bound on the relative rate of the partition. The upper bound of the 95% HPD was obtained similarly.
All of these rate estimates were made with substitution models assuming gamma-distributed rates among sites; they should not be used for analyses of uncorrected genetic distances.
Each partition in the concatenated alignment was given its own substitution model in the analysis, including its own gamma distribution for rate variation among sites. For details, refer to the methods described in the text.
The estimated TMRCA of all human mitochondria from the internally calibrated analysis of the concatenated data set was 108 thousand years (kyr) (95% highest posterior density [HPD]: 82–134 kyr); in contrast, the externally calibrated estimate was 162 kyr (95% HPD: 122–213 kyr). The magnitude of the internally calibrated estimate was very similar to that estimated from PC3 alone. For PC3, however, the age estimate was quite consistent between internally and externally calibrated analyses. Collectively, the internally calibrated estimates suggest a more recent time for the common ancestor than previous studies have indicated. The estimate for the TMRCA of haplogroups M and N (i.e., L3) is similarly reduced, with means of between 50 and 60 kyr (Table 4).
Table 4.
Age of Haplogroups M and N Estimated from Mitochondrial Alignments from 177 Humans and Two Chimpanzees
| Description | Age of M+N (Years) |
Age of M (Years) |
Age of N (Years) |
|||
|---|---|---|---|---|---|---|
| Mean | (95% HPD) | Mean | (95% HPD) | Mean | (95% HPD) | |
| Humans Only (Internal Calibration) | ||||||
| Concatenated | 54,400 | (44,700–67,900) | 44,100 | (35,300–54,500) | 45,500 | (40,000–54,400) |
| PC1+2 | 50,800 | (41,900–62,300) | 40,800 | (32,000–49,900) | 42,800 | (40,000–48,100) |
| PC3 | 52,400 | (41,200–65,700) | 40,300 | (31,200–50,400) | 44,400 | (40,000–52,200) |
| Humans and Chimpanzees (External Calibration) | ||||||
| Concatenated | 79,400 | (58,400–105,500) | 63,100 | (46,600–82,500) | 65,400 | (48,400–84,800) |
| PC1+2 | 221,000 | (112,400–360,000) | 148,400 | (83,600–235,500) | 165,400 | (93,600–270,400) |
| PC3 | 62,200 | (36,100–97,600) | 46,300 | (27,300–71,400) | 51,600 | (29,800–79,200) |
For all alignments of the D loop, the HVSs, and rRNA, the estimated shape parameter was less than 0.3, indicative of a high degree of rate heterogeneity among sites. Additionally, the D loop and both HVSs exhibited rate heterogeneity among lineages, with the 95% HPDs of the coefficients of variation of branch-specific rates excluding zero, reflecting a departure from the assumption of a molecular clock36 (Table 5). In contrast, there was no evidence of among-lineage rate variation in the rRNA genes or protein-coding sequences (PC1+2 and PC3), and only moderate rate heterogeneity among PC3 sites, with the shape parameter of the gamma distribution estimated at 1.13 (95% HPD: 0.75–1.61). The covariance of rates was not significantly different from 0 in any of the analyses, providing no evidence of rate autocorrelation between neighboring branches.
Table 5.
Estimated Coefficients of Variation of Rates, which Measure the Degree of Among-Lineage Rate Heterogeneity
| Alignment | Coefficient of Variationa |
|
|---|---|---|
| Humans Only | Humans and Chimpanzees | |
| Concatenated | 0.173 (0.058–0.268) | 0.158 (0.019–0.252) |
| PC1+2 | 0.153 (0.000–0.344) | 0.195 (0.000–0.411) |
| PC3 | 0.174 (0.000–0.332) | 0.170 (0.000–0.342) |
| rRNA (loops) | 0.278 (0.000–0.656) | 0.352 (0.000–0.798) |
| D loop | 0.150 (0.054–0.312) | 0.161 (0.000–0.324) |
| HVS1 | 0.374 (0.026–0.625) | 0.284 (0.000–0.528) |
| HVS2 | 0.728 (0.193–1.286) | 1.194 (0.689–1.724) |
Posterior mean, with 95% highest posterior density given in parentheses.
The analysis of selection revealed one codon under significant positive selection (in the CO1 gene) and 23 codons experiencing negative selection, qualitatively consistent with previous studies.46,47 Detailed results are given in Table S3. There is also a significantly higher dN:dS ratio in external, compared with internal, branches (p < 0.05).
Discussion
In most cases, calibration choice had a significant effect on estimates of substitution rates and divergence times, with internal calibration leading to an elevation of substitution rates and a concomitant contraction of the evolutionary time scale. The mean, externally calibrated estimate for the TMRCA of humans (162 kyr) is similar to those made in previous studies of whole mtDNA sequences: 167 kyr,31 198 kyr,8 and 190 kyr, and 238 kyr.10 Although this trend is unsurprising, a notable exception is observed in the estimates from PC3, in which there is a consistency between estimates made with internal and external calibrations. This is possibly due to the relaxed selection pressure at third codon sites, coupled with the relatively low level of sequence saturation. Additionally, the reduced selection will reduce the impact of ancestral polymorphisms,48 which would otherwise have the effect of inflating the internally calibrated rate estimate. In contrast, the 4-fold disparity between internally and externally calibrated estimates of the TMRCA of humans from PC1+2 can be at least partly attributed to the impact of negative selection. This is supported by the results from the analyses of selection; in the presence of incomplete purifying selection, an excess of transient polymorphisms can be found near the tips of the tree.49,50 This leads to a decrease in the observed substitution rate through time, although this factor alone is unlikely to be able to account entirely for the large discrepancy in the estimates obtained here for PC1+251.
The various D loop alignments exhibited considerable levels of saturation. This is also liable to contribute to a disparity between internally and externally calibrated estimates of divergence times.13 High evolutionary rates at mutational hot spots might not necessarily be accommodated by modeling rate variation among sites with a discrete gamma distribution,20 which will lead to an underestimation of genetic divergence over long time periods. The evidence of significant rate heterogeneity among sites suggests that approaches to molecular evolution that do not accommodate these sources of uncertainty lead to the production of biased age estimates for coalescence events, especially over long time frames. With a model-based approach, it is possible to allow for among-site rate heterogeneity explicitly.
The shortcomings of PC1+2 and the D loop are not present to the same extent in PC3. The PC3 results display little discrepancy between the internally and externally derived dates, consistent with the reduced expectation of saturation compared with the D loop and the relaxed selection relative to PC1+2. However, there are a number of examples within the human mtDNA phylogeny of lineages and haplogroups, such as those within L52 and M,53 that appear to be evolving at significantly different rates in the protein-coding region. Again, the model-based approach can explicitly identify and measure these departures from the molecular clock, whereas the application of model-free methods, such as uncorrected genetic distances, will generate unrealistic age estimates for coalescence events in these circumstances because of their assumption of a strict molecular clock. It is not clear, however, whether such a model is able to capture the complexities of variation in natural selection among lineages.54
Our internally calibrated dates for haplogroups M and N are significantly closer to the present than most previous mtDNA chronologies but are in good agreement with those from a recent, externally calibrated, genetic-distance study, which was based on synonymous changes occurring in the protein-coding region.46 This concordance between two different methodologies, using partitioned data sets that exclude transfer RNAs (tRNAs) and intergenic regions, provides an additional degree of confidence in our results. Our estimate for the TMRCA of L3 also agrees with one produced by a recent study of 50 nuclear loci (40–70kya).55 Collectively, these studies reiterate earlier suggestions that the genetic time frame for human prehistory needs to be amended.13
The externally calibrated rates estimated from both the concatenated and PC1+2 alignments were lower than the rates obtained via internal calibrations and lower than those from previous studies of equivalent regions of the mitochondrial genome.8,56 The averaged substitution rate from PC1+2 and PC3 is substantially lower than its pedigree counterpart,57 consistent with the prediction that the genealogical rate should be intermediate between the phylogenetic and pedigree rates.
Unfortunately, because of the poor topological support for key internal calibration nodes, we were not able to produce a direct substitution-rate estimate for the D loop, but we obtained an indirect one by multiplying the averaged substitution rate across the concatenated alignment by the relative rate for the D loop partition (Table 3). Compared with our results, existing estimates with D loop data have tended to produce slower rates, despite being restricted to the fastest evolving hypervariable sections. In studies calculating phylogenetic rates, the practice of using of an external calibration point can account for most of the disparity, because of the effect of saturation.32,58,59 However, the persistence of these differences when determining genealogical substitution rates9,16 suggests that the choice of calibration point and restricted data sets (both in terms of the global mtDNA tree and not using the entire D loop) can exacerbate the underlying problems of rate heterogeneity demonstrated by our analyses.17
Our results also suggest that it might not be appropriate to combine data from PC1+2, PC3, rRNA, and the D loop because of the differing influences on portions of the mitochondrial genome, such as selection on protein-coding sites and saturation in the D loop. This is supported by the recent findings of Howell et al.,52 who obtained evidence for a decoupling of relative substitution rates in protein-coding and D loop regions. In this regard, inclusion of tRNA and intergenic regions is only likely to introduce additional complications, because of RNA stem-pairing and strand-specific compositional variation. At the very least, a concatenated alignment needs to be partitioned, permitting the application of a separate evolutionary model to each partition. Nevertheless, the majority of current phylogenetic methods assume that data partitions share the same tree topology and branch lengths, which is inappropriate when different partitions exhibit incongruent patterns of among-lineage rate heterogeneity; the extent of the impact of this problem is not known, however, and further investigation is required.
The use of a human-chimpanzee calibration appears to be generally inappropriate for mitochondrial studies of human evolution, with the possible exception of data from third-codon sites. By using internal calibrations, our analyses have produced comparatively high estimates of substitution rates in the human mitochondrial genome, with an associated contraction of the evolutionary time scale. The influence of data selection on rate variation among lineages should be minimized by the use of a relaxed-clock model, although our rate estimates are most appropriately interpreted as mean values across the human tree. Future studies, with a greater assortment of calibrations, will be able to obtain a clearer picture of rate heterogeneity across the mitochondrial tree. Additionally, analyses of larger, representative data sets—for example, with a more comprehensive coverage of African mtDNA than that which was available for the present study—should be able to improve the precision and accuracy of the rate estimates presented here.
Our revised dates bring the mitochondrial estimates into better agreement with archaeological evidence for the expansion and dispersal of anatomically modern humans within Africa60 and Europe,61 and are supported by new chronologies derived from both nuclear and mitochondrial DNA, achieved by different methodologies.46,55 This suggests that improved resolution of the chronology of human dispersals with mtDNA will be achieved with partitioned data sets from the coding region (either PC3 or synonymous substitutions) and internal calibration points.
Supplemental Data
Three tables are available at http://www.ajhg.org/.
Supplemental Data
Acknowledgments
We would like to thank Georgi Hudjashov, Sheila Van Holst Pellikan, and the Anthropological Survey of India for sharing novel mitochondrial genome data with us in advance of publication and Vincent Macaulay and two anonymous reviewers for comments on the manuscript. P.E. was supported by the National Environmental Research Council of Great Britain and by Magdalen College, Oxford. S.Y.W.H. was supported by the Leverhulme Trust.
References
- 1.Ingman M., Gyllensten U. Mitochondrial genome variation and evolutionary history of Australian and New Guinean aborigines. Genome Res. 2003;13:1600–1606. doi: 10.1101/gr.686603. [DOI] [PMC free article] [PubMed] [Google Scholar]
- 2.Hey J. On the number of New World founders: A population genetic portrait of the peopling of the Americas. PLoS Biol. 2005;3:e193. doi: 10.1371/journal.pbio.0030193. [DOI] [PMC free article] [PubMed] [Google Scholar]
- 3.Noonan J.P., Coop G., Kudaravalli S., Smith D., Krause J., Alessi J., Chen F., Platt D., Pääbo S., Pritchard J.K. Sequencing and analysis of Neanderthal genomic DNA. Nature. 2006;314:1113–1118. doi: 10.1126/science.1131412. [DOI] [PMC free article] [PubMed] [Google Scholar]
- 4.Ovchinnikov I.V., Gotherstrom A., Romanova G.P., Kharitonov V.M., Liden K., Goodwin W. Molecular analysis of Neanderthal DNA from the northern Caucasus. Nature. 2000;404:490–493. doi: 10.1038/35006625. [DOI] [PubMed] [Google Scholar]
- 5.Krings M., Stone A.C., Schmitz R.W., Krainitzki H., Stoneking M., Pääbo S. Neandertal DNA sequences and the origin of modern humans. Cell. 1997;90:19–30. doi: 10.1016/s0092-8674(00)80310-4. [DOI] [PubMed] [Google Scholar]
- 6.Barnosky A.D., Koch P.L., Feranec R.S., Wing S.L., Shabel A.B. Assessing the causes of late Pleistocene extinctions on the continents. Science. 2004;306:70–75. doi: 10.1126/science.1101476. [DOI] [PubMed] [Google Scholar]
- 7.Brook B.W., Bowman D.M. Explaining the Pleistocene megafaunal extinctions: Models, chronologies, and assumptions. Proc. Natl. Acad. Sci. USA. 2002;99:14624–14627. doi: 10.1073/pnas.232126899. [DOI] [PMC free article] [PubMed] [Google Scholar]
- 8.Mishmar D., Ruiz-Pesini E., Golik P., Macaulay V., Clark A.G., Hosseini S., Brandon M., Easley K., Chen E., Brown M.D. Natural selection shaped regional mtDNA variation in humans. Proc. Natl. Acad. Sci. USA. 2003;100:171–176. doi: 10.1073/pnas.0136972100. [DOI] [PMC free article] [PubMed] [Google Scholar]
- 9.Forster P., Harding R., Torroni A., Bandelt H.J. Origin and evolution of Native American mtDNA variation: A reappraisal. Am. J. Hum. Genet. 1996;59:935–945. [PMC free article] [PubMed] [Google Scholar]
- 10.Tang H., Siegmund D.O., Shen P., Oefner P.J., Feldman M.W. Frequentist estimation of coalescence times from nucleotide sequence data using a tree-based partition. Genetics. 2002;161:447–459. doi: 10.1093/genetics/161.1.447. [DOI] [PMC free article] [PubMed] [Google Scholar]
- 11.Krings M., Geisert H., Schmitz R.W., Krainitzki H., Pääbo S. DNA sequence of the mitochondrial hypervariable region II from the neandertal type specimen. Proc. Natl. Acad. Sci. USA. 1999;96:5581–5585. doi: 10.1073/pnas.96.10.5581. [DOI] [PMC free article] [PubMed] [Google Scholar]
- 12.Ho S.Y.W., Shapiro B., Phillips M., Cooper A., Drummond A.J. Evidence for time dependency of molecular rate estimates. Syst. Biol. 2007;56:515–522. doi: 10.1080/10635150701435401. [DOI] [PubMed] [Google Scholar]
- 13.Ho S.Y.W., Phillips M.J., Cooper A., Drummond A.J. Time dependency of molecular rate estimates and systematic overestimation of recent divergence times. Mol. Biol. Evol. 2005;22:1561–1568. doi: 10.1093/molbev/msi145. [DOI] [PubMed] [Google Scholar]
- 14.Ho S.Y.W., Larson G. Molecular clocks: When times are a-changin'. Trends Genet. 2006;22:79–83. doi: 10.1016/j.tig.2005.11.006. [DOI] [PubMed] [Google Scholar]
- 15.Ho S.Y.W., Saarma U., Barnett R., Haile J., Shapiro B. The effect of inappropriate calibration in molecular ecological studies: Evidence from three case studies. PLoS ONE. 2008;3:e1615. doi: 10.1371/journal.pone.0001615. [DOI] [PMC free article] [PubMed] [Google Scholar]
- 16.Stoneking M., Sherry S.T., Redd A.J., Vigilant L. New approaches to dating suggest a recent age for human mtDNA ancestor. Philos. Trans. R. Soc. Lond. B Biol. Sci. 1992;337:167–175. doi: 10.1098/rstb.1992.0094. [DOI] [PubMed] [Google Scholar]
- 17.Bandelt H.-J., Kong Q.P., Richards M., Macaulay V. Estimation of mutation rates and coalescence times: some caveats. In: Bandelt H.-J., Macaulay V., Richards M., editors. Human Mitochondrial DNA and the Evolution of Homo sapiens. Springer; Berlin: 2006. pp. 47–90. [Google Scholar]
- 18.Galtier N., Enard D., Radondy Y., Bazin E., Belkhir K. Mutation hot spots in mammalian mitochondrial DNA. Genome Res. 2006;16:215–222. doi: 10.1101/gr.4305906. [DOI] [PMC free article] [PubMed] [Google Scholar]
- 19.Heyer E., Zietkiewicz E., Rochowski A., Yotova V., Puymirat J., Labuda D. Phylogenetic and familial estimates of mitochondrial substitution rates: Study of control region mutations in deep-rooting pedigrees. Am. J. Hum. Genet. 2001;69:1113–1126. doi: 10.1086/324024. [DOI] [PMC free article] [PubMed] [Google Scholar]
- 20.Meyer S., Weiss G., von Haeseler A. Pattern of nucleotide substitution and rate heterogeneity in the hypervariable regions I and II of human mtDNA. Genetics. 1999;152:1103–1110. doi: 10.1093/genetics/152.3.1103. [DOI] [PMC free article] [PubMed] [Google Scholar]
- 21.Hasegawa M., Cao Y., Yang Z. Preponderance of slightly deleterious polymorphism in mitochondrial DNA: Nonsynonymous/synonymous rate ratio is much higher within species than between species. Mol. Biol. Evol. 1998;15:1499–1505. doi: 10.1093/oxfordjournals.molbev.a025877. [DOI] [PubMed] [Google Scholar]
- 22.Hasegawa M., Horai S. Time of the deepest root for polymorphism in human mitochondrial DNA. J. Mol. Evol. 1991;32:37–42. doi: 10.1007/BF02099927. [DOI] [PubMed] [Google Scholar]
- 23.Penny D. Relativity for molecular clocks. Nature. 2005;426:183–184. doi: 10.1038/436183a. [DOI] [PubMed] [Google Scholar]
- 24.Ho S.Y.W., Jermiin L.S. Tracing the decay of the historical signal in biological sequence data. Syst. Biol. 2004;53:628–637. doi: 10.1080/10635150490503035. [DOI] [PubMed] [Google Scholar]
- 25.Excoffier L., Yang Z. Substitution rate variation among sites in mitochondrial hypervariable region I of humans and chimpanzees. Mol. Biol. Evol. 1999;16:1357–1368. doi: 10.1093/oxfordjournals.molbev.a026046. [DOI] [PubMed] [Google Scholar]
- 26.Wakeley J. Substitution rate variation among sites in hypervariable region I of human mitochondrial DNA. J. Mol. Evol. 1993;37:613–623. doi: 10.1007/BF00182747. [DOI] [PubMed] [Google Scholar]
- 27.Salas A., Carracedo A., Macaulay V., Richards M., Bandelt H.J. A practical guide to mitochondrial DNA error prevention in clinical, forensic, and population genetics. Biochem. Biophys. Res. Commun. 2005;335:891–899. doi: 10.1016/j.bbrc.2005.07.161. [DOI] [PubMed] [Google Scholar]
- 28.Bandelt H.-J., Lahermo P., Richards M., Macaulay V. Detecting errors in mtDNA data by phylogenetic analysis. Int. J. Legal Med. 2001;115:64–69. doi: 10.1007/s004140100228. [DOI] [PubMed] [Google Scholar]
- 29.Anderson S., Bankier A.T., Barrell B.G., de Bruijn M.H., Coulson A.R., Drouin J., Eperon I.C., Nierlich D.P., Roe B.A., Sanger F. Sequence and organisation of the human mitochondrial genome. Nature. 1981;290:457–465. doi: 10.1038/290457a0. [DOI] [PubMed] [Google Scholar]
- 30.Andrews R.M., Kubacka I., Chinnery P.F., Lightowlers R.N., Turnbull D.M., Howell N. Reanalysis and revision of the Cambridge reference sequence for human mitochondrial DNA. Nat. Genet. 1999;23:147. doi: 10.1038/13779. [DOI] [PubMed] [Google Scholar]
- 31.Ingman M., Gyllensten U. Analysis of the complete human mtDNA genome: Methodology and inferences for human evolution. J. Hered. 2001;92:454–461. doi: 10.1093/jhered/92.6.454. [DOI] [PubMed] [Google Scholar]
- 32.Horai S., Hayasaka K., Tsugane K., Takhata N. Recent African origin of modern humans revealed by complete sequences of hominoid mitochondrial DNAs. Proc. Natl. Acad. Sci. USA. 1995;92:532–536. doi: 10.1073/pnas.92.2.532. [DOI] [PMC free article] [PubMed] [Google Scholar]
- 33.Saccone C., Giorgi C.D., Gissi C., Pesole G., Reyes A. Evolutionary genomics in Metazoa: The mitochondrial DNA as a model system. Gene. 1999;238:195–209. doi: 10.1016/s0378-1119(99)00270-x. [DOI] [PubMed] [Google Scholar]
- 34.Jakobsen I.B., Easteal S. A program for calculating and displaying compatibility matrices as an aid in determining reticulate evolution in molecular sequences. Comput. Appl. Biosci. 1996;12:291–295. doi: 10.1093/bioinformatics/12.4.291. [DOI] [PubMed] [Google Scholar]
- 35.Drummond A.J., Rambaut A. BEAST: Bayesian evolutionary analysis by sampling trees. BMC Evol. Biol. 2007;7:214. doi: 10.1186/1471-2148-7-214. [DOI] [PMC free article] [PubMed] [Google Scholar]
- 36.Drummond A.J., Ho S.Y.W., Phillips M.J., Rambaut A. Relaxed phylogenetics and dating with confidence. PLoS Biol. 2006;4:e88. doi: 10.1371/journal.pbio.0040088. [DOI] [PMC free article] [PubMed] [Google Scholar]
- 37.Posada D., Crandall K.A. Modeltest: Testing the model of DNA substitution. Bioinformatics. 1998;14:817–818. doi: 10.1093/bioinformatics/14.9.817. [DOI] [PubMed] [Google Scholar]
- 38.Drummond A.J., Rambaut A., Shapiro B., Pybus O.G. Bayesian coalescent inference of past population dynamics from molecular sequences. Mol. Biol. Evol. 2005;22:1185–1192. doi: 10.1093/molbev/msi103. [DOI] [PubMed] [Google Scholar]
- 39.Hudjashov G., Kivisild T., Underhill P.A., Endicott P., Sanchez J.J., Lin A.A., Shen P., Oefner P., Renfrew C., Villems R. Revealing the prehistoric settlement of Australia by Y chromosome and mtDNA analysis. Proc. Natl. Acad. Sci. USA. 2007;104:8726–8730. doi: 10.1073/pnas.0702928104. [DOI] [PMC free article] [PubMed] [Google Scholar]
- 40.O'Connell J.F., Allen J. Dating the colonization of Sahul: A review of recent research. J. Archaeol. Sci. 2004;31:835–853. [Google Scholar]
- 41.Achilli A., Rengo C., Magri C., Battaglia V., Olivieri A., Scozzari R., Cruciani F., Zeviani M., Briem E., Carelli V. The molecular dissection of mtDNA haplogroup H confirms that the Franco-Cantabrian glacial refuge was a major source for the European gene pool. Am. J. Hum. Genet. 2004;75:910–918. doi: 10.1086/425590. [DOI] [PMC free article] [PubMed] [Google Scholar]
- 42.Gamble C., Davies W., Pettitt P., Richards M. Climate change and evolving human diversity in Europe during the last glacial. Philos. Trans. R. Soc. Lond. B Biol. Sci. 2004;359:243–253. doi: 10.1098/rstb.2003.1396. [DOI] [PMC free article] [PubMed] [Google Scholar]
- 43.Ho S.Y.W. Calibrating molecular estimates of substitution rates and divergence times in birds. J. Avian Biol. 2007;38:409–414. [Google Scholar]
- 44.Benton M.J., Donoghue P.C. Paleontological evidence to date the tree of life. Mol. Biol. Evol. 2007;24:26–53. doi: 10.1093/molbev/msl150. [DOI] [PubMed] [Google Scholar]
- 45.Kosakovsky Pond S.L., Frost S.D. Not so different after all: A comparison of methods for detecting amino acid sites under selection. Mol. Biol. Evol. 2005;22:1208–1222. doi: 10.1093/molbev/msi105. [DOI] [PubMed] [Google Scholar]
- 46.Kivisild T., Shen P., Wall D.P., Do B., Sung R., Davis K., Passarino G., Underhill P.A., Scharfe C., Torroni A. The role of selection in the evolution of human mitochondrial genomes. Genetics. 2006;172:373–387. doi: 10.1534/genetics.105.043901. [DOI] [PMC free article] [PubMed] [Google Scholar]
- 47.Ruiz-Pesini E., Mishmar D., Brandon M., Procaccio V., Wallace D.C. Effects of purifying and adaptive selection on regional variation in human mtDNA. Science. 2004;303:223–226. doi: 10.1126/science.1088434. [DOI] [PubMed] [Google Scholar]
- 48.Charlesworth B., Bartolomé C., Noël V. The detection of shared and ancestral polymorphisms. Genet. Res. 2005;86:149–157. doi: 10.1017/S0016672305007743. [DOI] [PubMed] [Google Scholar]
- 49.Williamson S., Orive M.E. The genealogy of a sequence subject to purifying selection at multiple sites. Mol. Biol. Evol. 2002;19:1376–1384. doi: 10.1093/oxfordjournals.molbev.a004199. [DOI] [PubMed] [Google Scholar]
- 50.Nielsen R., Weinreich D.M. The age of nonsynonymous and synonymous mutations in animal mtDNA and implications for the mildly deleterious theory. Genetics. 1999;153:497–506. doi: 10.1093/genetics/153.1.497. [DOI] [PMC free article] [PubMed] [Google Scholar]
- 51.Woodhams M. Can deleterious mutations explain the time dependency of molecular rate estimates? Mol. Biol. Evol. 2006;23:2271–2273. doi: 10.1093/molbev/msl107. [DOI] [PubMed] [Google Scholar]
- 52.Howell N., Elson J.L., Howell C., Turnbull D.M. Relative rates of evolution in the coding and control regions of African mtDNAs. Mol. Biol. Evol. 2007;24:2213–2221. doi: 10.1093/molbev/msm147. [DOI] [PubMed] [Google Scholar]
- 53.Sun C., Kong Q.P., Palanichamy M.G., Agrawal S., Bandelt H.J., Yao Y.G., Khan F., Zhu C.L., Chaudhuri T.K., Zhang Y.P. The dazzling array of basal branches in the mtDNA macrohaplogroup M from India as inferred from complete genomes. Mol. Biol. Evol. 2006;23:683–690. doi: 10.1093/molbev/msj078. [DOI] [PubMed] [Google Scholar]
- 54.Ingman M., Gyllensten U. Rate variation between mitochondrial domains and adaptive evolution in humans. Hum. Mol. Genet. 2007;16:2281–2287. doi: 10.1093/hmg/ddm180. [DOI] [PubMed] [Google Scholar]
- 55.Fagundes N.J.R., Ray N., Beaumont M., Neuenschwander S., Salzano F.M., Bonatto S.L., Excoffier L. Statistical evaluation of alternative models of human evolution. Proc. Natl. Acad. Sci. USA. 2007;104:17614–17619. doi: 10.1073/pnas.0708280104. [DOI] [PMC free article] [PubMed] [Google Scholar]
- 56.Ingman M., Kaessmann H., Paabo S., Gyllensten U. Mitochondrial genome variation and the origin of modern humans. Nature. 2000;408:708–713. doi: 10.1038/35047064. [DOI] [PubMed] [Google Scholar]
- 57.Howell N., Smejkal C.B., Mackey D.A., Chinnery P.F., Turnbull D.M., Herrnstadt C. The pedigree rate of sequence divergence in the human mitochondrial genome: There is a difference between phylogenetic and pedigree rates. Am. J. Hum. Genet. 2003;72:659–670. doi: 10.1086/368264. [DOI] [PMC free article] [PubMed] [Google Scholar]
- 58.Vigilant L., Stoneking M., Harpending H., Hawkes K., Wilson A.C. African populations and the evolution of human mitochondrial DNA. Science. 1991;253:1503–1507. doi: 10.1126/science.1840702. [DOI] [PubMed] [Google Scholar]
- 59.Ward R.H., Frazier B.L., Dew-Jager K., Pääbo S. Extensive mitochondrial diversity within a single Amerindian tribe. Proc. Natl. Acad. Sci. USA. 1991;88:8720–8724. doi: 10.1073/pnas.88.19.8720. [DOI] [PMC free article] [PubMed] [Google Scholar]
- 60.Mellars P. Why did modern human populations disperse from Africa ca. 60,000 years ago? A new model. Proc. Natl. Acad. Sci. USA. 2006;103:9381–9386. doi: 10.1073/pnas.0510792103. [DOI] [PMC free article] [PubMed] [Google Scholar]
- 61.Mellars P. A new radiocarbon revolution and the dispersal of modern humans in Eurasia. Nature. 2006;439:931–935. doi: 10.1038/nature04521. [DOI] [PubMed] [Google Scholar]
Associated Data
This section collects any data citations, data availability statements, or supplementary materials included in this article.