

Abstract
Variation in the level of gene expression is a major determinant of a cell's function and characteristics. Common allelic variants of genes can be expressed at different levels and thus contribute to phenotypic diversity. We have measured allelic expression differences at heterozygous loci in monozygotic twins and in unrelated individuals. We show that the extent of differential allelic expression is highly similar within monozygotic twin pairs for many loci, implying that allelic differences in gene expression are under genetic control. We also show that even subtle departures from equal allelic expression are often genetically determined.
Main Text
The alleles of an autosomal gene are not necessarily expressed at the same level.1–3 These allelic differences in gene expression are a major component of phenotypic variability and contribute to both Mendelian and complex genetic traits. Allelic differences in expression have been observed in family and population studies2,4–6. These expression differences (differential allelic expression, or “DAE”) can also be studied in heterozygotes.3 In the most extreme form of DAE, monoallelic expression, only one of the two alleles in heterozygotes is expressed. Until recently, it was thought that monoallelic expression occurred only for a few kinds of genes: those that undergo allelic exclusion (e.g., immunoglobulins, odorant receptors) or imprinting and X-linked genes affected by the inactivation of one X chromosome in females. In a recent study, investigators used multiple clones of cells from the same heterozygous individual and concluded that “monoallelic” expression is found for 5%–10% of autosomal genes in a large proportion of the clones studied.7 They also concluded that the choice of the expressed allele is made at random in different cells, and therefore represents epigenetic, not germline, effects. In contrast, our studies of twins show that germline effects must also be important. A parallel situation is found in X inactivation, when one allele is completely silenced. “Preferential X inactivation” is seen with rare promoter mutations of the XIST gene8 (MIM 314670), and additional evidence for a germline non-random component is seen in family and linkage studies.9
In this study, we investigated the genetic basis of DAE by studying monozygotic (MZ) twins. We found that for many genes, the degree of DAE is remarkably similar in the members of the MZ twin pair. Instead of setting an arbitrary threshold, we defined the degree of DAE by using the distribution of allelic expression among all individuals studied. By this approach, we show that the similarity in the degree of DAE between MZ twins is seen even when the departure from equal expression is small. These results show that individual variation in the degree of DAE is under genetic control. Such a strong genetic effect implies that the overall degree of DAE for many genes depends on a process that is not random.
We prepared DNA and mRNA from lymphoblastoid cell lines representing 21 monozygotic (MZ) twins and ten CEU individuals from the International HapMap Project.10 We obtained genotypes of the subjects by hybridizing their DNA on genotyping arrays (XbaI component of the 100K Affymetrix SNP array). Because the ten HapMap individuals have been genotyped at a very dense set of markers by the HapMap Project,11 we compared our individual genotypes with those from the HapMap and confirmed that they were identical.
We measured differential hybridization of cDNA to the “A” and “B” alleles at each single-nucleotide polymorphism (SNP) on the genotyping arrays and estimated the relative abundance of allelic transcripts by the method of Pant et al.12 with minor modifications due to the difference in our arrays. We adjusted for intrinsic differences in signal intensity between the two alleles by using the hybridization intensities of the alleles in the DNA samples on the arrays. Of the ∼58,000 SNPs interrogated by the array, approximately 700 occur in exonic regions of genes. These exonic SNPs allowed us to distinguish and quantify the two allelic transcripts in heterozygotes. The resulting data were checked and filtered for genotype and phenotype quality.
We first investigated the overall distribution of allelic expression differences among the 31 unrelated individuals (one randomly chosen member of each twin pair and 10 HapMap individuals). We restricted attention to SNPs heterozygous in five or more individuals, which resulted in 285 exonic SNPs for the analysis of DAE (Figure 1A). For each SNP, we determined the departure from equal expression of alleles A and B in every heterozygote. Then we calculated the proportion of A-bearing transcripts as an “allelic expression ratio” a/(a+b), where a and b are the intensities of hybridization signals, which we take as the relative contributions of the two alleles to the mRNA for that gene, as in Pant et al.12. Because this ratio represents the relative abundance of A-bearing transcripts, DAE (“allelic imbalance”) produces departures from the value 0.5. We used the distribution of a/(a+b) values among the heterozygotes, rather than an arbitrary threshold of allelic expression ratio, to assess the evidence for overall DAE of the corresponding gene. For each SNP, we converted the difference between the observed mean, , and the “expected” value, 0.5, to units of SE, the standard error of the mean. As is customary, values of that differed from 0.5 by more than 2 SE units were considered nominally significant (p < 0.05, two-tailed t test). Among the 285 SNPs, we found more than 50% (163 SNPs in 151 genes) with significant evidence of DAE, i.e., with different from 0.5 by ≥ 2 SE (see Table S1, available online). Among them, there were 17 with mean a/(a+b) greater than 0.66 or less than 0.33, representing a difference in expression of 2-fold or greater between the two alleles.
Figure 1.
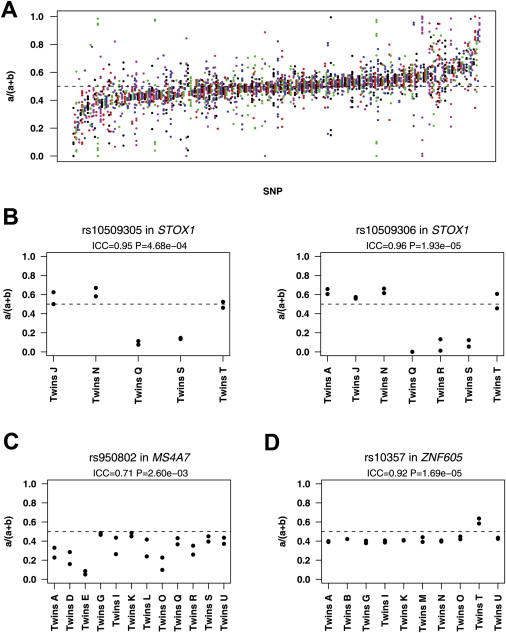
Differential Allelic Expression Is Extensive and Influenced by Genetic Variation
(A) Allelic expression ratio of 285 exonic SNPs measured in five or more unrelated individuals (colored dots) heterozygous at those sites. SNPs are ordered left to right by mean expression ratio, a/(a+b).
(B–D) Allelic expression ratios for selected SNPs in heterozygous MZ twin pairs (identified as in Table S2); twins have highly similar patterns of DAE. (B) Similar measurements were obtained from the two SNPs in STOX1. (C) Expression of the B allele is higher in all individuals studied [mean of a/(a+b) = 0.32 in 31 unrelated individuals]. (D) Twins are highly similar even when there is little evidence of DAE.
To assess the germline genetic contribution to DAE, we examined twin correlation of a/(a+b) in the sample of 21 MZ twin pairs. If cells from members of the same twin pair were grown in the same batch more often those from different pairs, the resulting batch effects could lead to artifactual similarity within pairs, i.e., exaggerated correlation of twins. We therefore grew cells from as many pairs as possible in the same batch (a total of two batches – see Table S2, available online). Thus, we were able to check that the results for twin similarity were not influenced by batch membership. For the RNA extraction and preparation of the cDNA samples for hybridization onto arrays, one batch consisted entirely of “twin 1” from each pair, and the other batch consisted of “twin 2,” so batch artifacts were completely eliminated from this procedure.
We used analysis of variance (ANOVA) to test the significance of twin resemblance. The ANOVA also provided an estimate of the intraclass correlation coefficient (ICC), the standard measure of similarity within pairs of subjects. ICC values less than or close to 0 indicate that MZ twins are no more similar than would be expected from the variation among unrelated individuals; values near 1 (the maximum) indicate that MZ twins are extremely similar.
Among the 211 SNPs heterozygous in five or more twin pairs, there are 63 (30%) with p < 0.05 for ICC (Table 1); among these, the values of ICC range from 0.47 to 0.98 (Table 1 and Figure S1). Among 211 SNPs, we expect approximately two with p < 0.01 by chance (we found 26) and much less than one with p < 10−4 (we found seven). Clearly, many more genes show evidence for genetic variation in allelic expression differences than would be expected by chance. When there were two SNPs in the same transcript, they gave similar results; for example, Figure 1B shows highly similar results for two SNPs in STOX1 (MIM 609397). (This result also provides evidence for technical reliability of the methods. Two SNPs in each of the transcripts for LOC388335 and SYNGR1 (MIM 603925) provide additional support—see Supplemental Data.)
Table 1.
63 SNPs with Significant1 Intraclass Correlation Coefficient for MZ Twins
| Gene | Accession Number | RS ID | Chromosome | Mean a/(a+b) | SE Units | Number of heterozygotes | Number Heterozygous Twin Pairs | ICC | ICC p Value |
|---|---|---|---|---|---|---|---|---|---|
| USP6 | NM_004505 | rs3890287 | 17 | 0.577 | 0.70 | 17 | 10 | 0.97 | 5.76E-08 |
| ZNF605 | NM_183238 | rs10357 | 12 | 0.440 | −2.66 | 12 | 10 | 0.92 | 1.69E-05 |
| STOX1 | NM_152709 | rs10509306 | 10 | 0.451 | −0.48 | 9 | 7 | 0.96 | 1.93E-05 |
| RPS23 | NM_001025 | rs9099 | 5 | 0.452 | −1.73 | 9 | 6 | 0.97 | 2.17E-05 |
| ABCA12 | NM_015657 | rs10498027 | 2 | 0.380 | −1.25 | 14 | 8 | 0.94 | 2.33E-05 |
| RAB31 | NM_006868 | rs1065548 | 18 | 0.487 | −0.23 | 10 | 5 | 0.98 | 5.06E-05 |
| SYNGR1 | NM_004711 | rs1010169 | 22 | 0.697 | 3.24 | 13 | 10 | 0.88 | 8.52E-05 |
| SYTL2 | NM_032943 | rs597480 | 11 | 0.587 | 1.68 | 14 | 9 | 0.89 | 1.29E-04 |
| C1orf174 | NM_207356 | rs4131373 | 1 | 0.467 | −0.93 | 8 | 8 | 0.91 | 1.36E-04 |
| LOC388335 | NM_001004313 | rs440655 | 17 | 0.457 | −3.02 | 16 | 12 | 0.82 | 1.75E-04 |
| APOBEC2 | NM_006789 | rs2076472 | 6 | 0.540 | 2.69 | 10 | 7 | 0.92 | 2.68E-04 |
| LOC388335 | NM_001004313 | rs435382 | 17 | 0.564 | 5.12 | 16 | 12 | 0.80 | 3.64E-04 |
| C20orf35 | NM_033542 | rs2664543 | 20 | 0.478 | −2.03 | 11 | 8 | 0.88 | 4.45E-04 |
| STOX1 | NM_152709 | rs10509305 | 10 | 0.412 | −1.02 | 7 | 5 | 0.95 | 4.68E-04 |
| RAB6IP2 | NM_015064 | rs1064125 | 12 | 0.481 | −0.48 | 14 | 10 | 0.83 | 4.95E-04 |
| BRWD1 | NM_018963 | rs2836933 | 21 | 0.486 | −1.04 | 16 | 13 | 0.76 | 5.42E-04 |
| PEMT | NM_007169 | rs7946 | 17 | 0.503 | 0.46 | 16 | 9 | 0.82 | 1.21E-03 |
| C20orf35 | NM_033542 | rs707576 | 20 | 0.504 | 0.33 | 11 | 8 | 0.82 | 1.90E-03 |
| ZNF313 | NM_018683 | rs6067282 | 20 | 0.530 | 5.09 | 18 | 13 | 0.70 | 2.00E-03 |
| MS4A7 | NM_021201 | rs950802 | 11 | 0.324 | −5.28 | 15 | 12 | 0.71 | 2.60E-03 |
| FYB | NM_001465 | rs379707 | 5 | 0.428 | −1.49 | 16 | 14 | 0.66 | 2.80E-03 |
| ARTS-1 | NM_001040458 | rs469783 | 5 | 0.535 | 1.78 | 21 | 15 | 0.64 | 3.02E-03 |
| VEZT | NM_017599 | rs4468424 | 12 | 0.582 | 7.35 | 11 | 7 | 0.79 | 5.73E-03 |
| IRF8 | NM_002163 | rs10514611 | 16 | 0.551 | 6.56 | 8 | 6 | 0.82 | 6.57E-03 |
| GALNT10 | NM_017540 | rs3172941 | 5 | 0.524 | 2.51 | 15 | 9 | 0.72 | 6.97E-03 |
| SLC25A26 | NM_173471 | rs13874 | 3 | 0.511 | 0.87 | 17 | 13 | 0.61 | 8.16E-03 |
| C9orf84 | NM_173521 | rs10512411 | 9 | 0.588 | 1.96 | 10 | 7 | 0.75 | 1.01E-02 |
| GALNT10 | NM_017540 | rs10796 | 5 | 0.479 | −2.80 | 12 | 8 | 0.72 | 1.08E-02 |
| EPB41L4A | NM_022140 | rs7703522 | 5 | 0.442 | −2.54 | 12 | 7 | 0.75 | 1.09E-02 |
| PRKD3 | NM_005813 | rs2302650 | 2 | 0.433 | −1.58 | 9 | 7 | 0.74 | 1.24E-02 |
| GCNT1 | NM_001490 | rs707739 | 9 | 0.474 | −1.19 | 10 | 7 | 0.74 | 1.26E-02 |
| VLDLR | NM_001018056 | rs8210 | 9 | 0.532 | 1.53 | 10 | 8 | 0.70 | 1.27E-02 |
| CCT5 | NM_012073 | rs2578639 | 5 | 0.639 | 7.30 | 12 | 10 | 0.63 | 1.55E-02 |
| SYNGR1 | NM_004711 | rs1010170 | 22 | 0.618 | 1.61 | 12 | 6 | 0.76 | 1.55E-02 |
| WRN | NM_000553 | rs1800392 | 8 | 0.513 | 1.01 | 15 | 7 | 0.71 | 1.66E-02 |
| GTF3C4 | NM_012204 | rs462791 | 9 | 0.569 | 32.27 | 14 | 12 | 0.57 | 1.76E-02 |
| KLF12 | NM_007249 | rs9318219 | 13 | 0.411 | −6.89 | 15 | 8 | 0.67 | 1.89E-02 |
| CD244 | NM_016382 | rs485618 | 1 | 0.538 | 1.40 | 21 | 12 | 0.56 | 2.04E-02 |
| HIP1 | NM_005338 | rs1167829 | 7 | 0.430 | −2.08 | 8 | 5 | 0.78 | 2.08E-02 |
| SBF2 | NM_030962 | rs3829252 | 11 | 0.456 | −1.84 | 13 | 9 | 0.62 | 2.13E-02 |
| TBC1D2B | NM_015079 | rs10519181 | 15 | 0.607 | 8.03 | 9 | 5 | 0.76 | 2.44E-02 |
| PTPLAD2 | NM_001010915 | rs1134090 | 9 | 0.508 | 0.60 | 16 | 10 | 0.58 | 2.49E-02 |
| ANKRD28 | NM_015199 | rs2470549 | 3 | 0.541 | 2.74 | 14 | 8 | 0.64 | 2.55E-02 |
| ZNF192 | NM_006298 | rs9295759 | 6 | 0.535 | 6.45 | 11 | 7 | 0.67 | 2.58E-02 |
| RNF36 | NM_080745 | rs2470911 | 15 | 0.489 | −0.30 | 12 | 8 | 0.63 | 2.73E-02 |
| LOC93349 | NM_138402 | rs7559665 | 2 | 0.583 | 12.42 | 14 | 8 | 0.62 | 2.92E-02 |
| ZNF135 | NM_003436 | rs2229375 | 19 | 0.494 | −0.16 | 18 | 13 | 0.50 | 3.01E-02 |
| ZCCHC10 | NM_017665 | rs3087646 | 5 | 0.523 | 6.10 | 18 | 11 | 0.54 | 3.09E-02 |
| FLJ11506 | NM_024666 | rs10518716 | 15 | 0.487 | −1.83 | 19 | 13 | 0.49 | 3.40E-02 |
| ADI1 | NM_018269 | rs1130333 | 2 | 0.410 | −2.87 | 10 | 8 | 0.60 | 3.59E-02 |
| TMEM106B | NM_018374 | rs10488193 | 7 | 0.430 | −10.10 | 13 | 10 | 0.54 | 3.79E-02 |
| SMC2 | NM_001042550 | rs7872034 | 9 | 0.461 | −5.01 | 18 | 11 | 0.51 | 3.83E-02 |
| QRSL1 | NM_018292 | rs1026619 | 6 | 0.327 | −23.79 | 10 | 6 | 0.66 | 3.99E-02 |
| NR1I2 | NM_003889 | rs10511395 | 3 | 0.443 | −2.65 | 7 | 6 | 0.66 | 4.01E-02 |
| PSCDBP | NM_004288 | rs267992 | 2 | 0.429 | −7.61 | 9 | 7 | 0.62 | 4.03E-02 |
| NT5DC3 | NM_016575 | rs9142 | 12 | 0.601 | 12.19 | 14 | 10 | 0.53 | 4.08E-02 |
| GPR55 | NM_005683 | rs1992188 | 2 | 0.561 | 2.50 | 13 | 9 | 0.55 | 4.10E-02 |
| KLHL5 | NM_001007075 | rs3733275 | 4 | 0.461 | −3.56 | 12 | 9 | 0.55 | 4.10E-02 |
| CD80 | NM_005191 | rs1599796 | 3 | 0.549 | 11.61 | 11 | 8 | 0.58 | 4.25E-02 |
| ALKBH3 | NM_139178 | rs2292889 | 11 | 0.415 | −9.62 | 8 | 6 | 0.65 | 4.28E-02 |
| ARSK | NM_198150 | rs10491246 | 5 | 0.507 | 0.84 | 9 | 9 | 0.54 | 4.48E-02 |
| COX4NB | NM_006067 | rs8587 | 16 | 0.536 | 4.93 | 18 | 12 | 0.47 | 4.56E-02 |
| SEPP1 | NM_005410 | rs6413428 | 5 | 0.536 | 0.39 | 13 | 8 | 0.57 | 4.64E-02 |
p < 0.05.
The marked twin resemblance in the magnitude of DAE was seen not only for genes such as MS4A7 (MIM 606502), for which there are large departures from equal allelic expression (Figure 1C), but also for genes whose allelic forms are expressed at similar levels, i.e., for which there is no significant evidence of DAE, as in ZNF605 (Figure 1D).
Our findings lead to several conclusions. First, for at least 50% of genes expressed in lymphoblastoid B cells, the entire distribution of the allelic expression ratio is significantly shifted away from the expected mean of 0.5 (equal allelic expression). This conclusion results from our analysis of the distribution of allelic ratios. If an arbitrary threshold had been used to define DAE, it would not have been possible to detect the small departures, where the expression phenotype as a whole shows small but significant DAE in normal individuals. In contrast, some of the differences are very large; they amount to two-fold or greater in average expression level between alleles. Second, the results from MZ twins show that the degree of DAE is significantly correlated within a twin pair for at least 30% of genes. This suggests that not just the presence of DAE, but also its quantitative extent, is under genetic control. This twin correlation is found even for genes where the average departure from the expected equal allelic expression is small and not significant. Third, our analysis suggests a genetic interpretation of the recent finding of widespread random monoallelic expression.7 Gimelbrant and colleagues7 studied cloned lymphoblastoid B cells and concluded that an individual is mosaic with regard to 5%–10% of genes expressed in B cells; for these genes, some cells express only the paternally derived allele, some express only the maternally derived allele, and (for most genes) some express both alleles. In our study, we also found that allelic differences in gene expression are common. However, the twin correlations show that even if the population of B cells is mosaic, the extent of differential allelic expression for the entire population of B cells in an individual is not random but rather is influenced by inherited variation. This implies that the determinants of allele-specific gene expression can be identified by genetic analyses. Further studies to map these genetic determinants of DAE will lead to a better understanding of regulation of human gene expression, a major determinant of cellular phenotype.
Acknowledgments
We thank M. Bartolomei, D. L. George, and H. H. Kazazian for comments. This work is supported by grants from the National Institutes of Health to V.G.C. and R.S.S.
Supplemental Data
Web Resources
The URLs for SNPs and genes referred to herein are as follows:
International HapMap Project, http://www.hapmap.org/
Online Mendelian Inheritance in Man, http://www.ncbi.nlm.nih.gov/Omim
References
- 1.Lo H.S., Wang Z., Hu Y., Yang H.H., Gere S., Buetow K.H., Lee M.P. Allelic variation in gene expression is common in the human genome. Genome Res. 2003;13:1855–1862. doi: 10.1101/gr.1006603. [DOI] [PMC free article] [PubMed] [Google Scholar]
- 2.Morley M., Molony C.M., Weber T.M., Devlin J.L., Ewens K.G., Spielman R.S., Cheung V.G. Genetic analysis of genome-wide variation in human gene expression. Nature. 2004;430:743–747. doi: 10.1038/nature02797. [DOI] [PMC free article] [PubMed] [Google Scholar]
- 3.Yan H., Yuan W., Velculescu V.E., Vogelstein B., Kinzler K.W. Allelic variation in human gene expression. Science. 2002;297:1143. doi: 10.1126/science.1072545. [DOI] [PubMed] [Google Scholar]
- 4.Cheung V.G., Spielman R.S., Ewens K.G., Weber T.M., Morley M., Burdick J. Mapping determinants of human gene expression by regional and genome-wide association. Nature. 2005;437:1365–1369. doi: 10.1038/nature04244. [DOI] [PMC free article] [PubMed] [Google Scholar]
- 5.Schadt E.E., Monks S.A., Drake T.A., Lusis A.J., Che N., Colinayo V., Ruff T.G., Milligan S.B., Lamb J.R., Cavet G. Genetics of gene expression surveyed in maize, mouse and man. Nature. 2003;422:297–302. doi: 10.1038/nature01434. [DOI] [PubMed] [Google Scholar]
- 6.Stranger B.E., Forrest M.S., Clark A.G., Minichiello M.J., Deutsch S., Lyle R., Hunt S., Kahl B., Antonarakis S.E., Tavare S. Genome-wide associations of gene expression variation in humans. PLoS Genet. 2005;1:e78. doi: 10.1371/journal.pgen.0010078. [DOI] [PMC free article] [PubMed] [Google Scholar]
- 7.Gimelbrant A., Hutchinson J.N., Thompson B.R., Chess A. Widespread monoallelic expression on human autosomes. Science. 2007;318:1136–1140. doi: 10.1126/science.1148910. [DOI] [PubMed] [Google Scholar]
- 8.Plenge R.M., Hendrich B.D., Schwartz C., Arena J.F., Naumova A., Sapienza C., Winter R.M., Willard H.F. A promoter mutation in the XIST gene in two unrelated families with skewed X-chromosome inactivation. Nat. Genet. 1997;17:353–356. doi: 10.1038/ng1197-353. [DOI] [PubMed] [Google Scholar]
- 9.Naumova A.K., Olien L., Bird L.M., Smith M., Verner A.E., Leppert M., Morgan K., Sapienza C. Genetic mapping of X-linked loci involved in skewing of X chromosome inactivation in the human. Eur. J. Hum. Genet. 1998;6:552–562. doi: 10.1038/sj.ejhg.5200255. [DOI] [PubMed] [Google Scholar]
- 10.International HapMap Consortium The international HapMap project. Nature. 2003;426:789–796. doi: 10.1038/nature02168. [DOI] [PubMed] [Google Scholar]
- 11.Frazer K.A., Ballinger D.G., Cox D.R., Hinds D.A., Stuve L.L., Gibbs R.A., Belmont J.W., Boudreau A., Hardenbol P., Leal S.M. A second generation human haplotype map of over 3.1 million SNPs. Nature. 2007;449:851–861. doi: 10.1038/nature06258. [DOI] [PMC free article] [PubMed] [Google Scholar]
- 12.Pant P.V., Tao H., Beilharz E.J., Ballinger D.G., Cox D.R., Frazer K.A. Analysis of allelic differential expression in human white blood cells. Genome Res. 2006;16:331–339. doi: 10.1101/gr.4559106. [DOI] [PMC free article] [PubMed] [Google Scholar]
Associated Data
This section collects any data citations, data availability statements, or supplementary materials included in this article.