

Abstract
Molecular modeling is advocated here as a key methodology for research and development in bionanotechnology. Molecular modeling provides nanoscale images at atomic and even electronic resolution, predicts the nanoscale interaction of yet unfamiliar combinations of biological and inorganic materials, and can evaluate strategies for redesigning biopolymers for nanotechnological uses. The methodology is illustrated in this paper through three case studies. The first involves the use of single-walled carbon nanotubes as biomedical sensors where a computationally efficient, yet accurate description of the influence of biomolecules on nanotube electronic properties and a description of nanotube - biomolecule interactions were developed; this development furnishes the ability to test nanotube electronic properties in realistic biological environments. The second case study involves the use of nanopores manufactured into electronic nanodevices based on silicon compounds for single molecule electrical recording, in particular, for DNA sequencing. Here, modeling combining classical molecular dynamics, material science, and device physics, describes the interaction of biopolymers, e.g., DNA, with silicon nitrate and silicon oxide pores, furnishes accurate dynamic images of pore translocation processes, and predicts signals. The third case study involves the development of nanoscale lipid bilayers for the study of embedded membrane proteins and cholesterol. Molecular modeling tested scaffold proteins, redesigned lipoproteins found in mammalian plasma that hold the discoidal membranes in shape, and predicted the assembly as well as final structure of the nanodiscs. In entirely new technological areas like bionanotechnology qualitative concepts, pictures, and suggestions are sorely needed; these three case studies document that molecular modeling can serve a critical role in this respect, even though it may still fall short on quantitative precision.
Keywords: molecular dynamics, nanodevice, carbon nanotube, synthetic nanopore, DNA sequencing, lipoprotein
Introduction
The physical sciences underwent a revolution during the last century that transformed our understanding of the inorganic world and our industry. This revolution resulted in no small part from crystallography that clearly demonstrated the atomic composition of every day materials, as well as the geometric order underlying the atomic assembly of these materials, and provided a firm basis for building an understanding of the chemistry and physics of the human environment. The scientific advance was accompanied by a steady stream of new technologies.
One can clearly forecast that the present revolution of the life sciences will not only transform our understanding of the living world, but will also continuously spawn new technologies. The key foundation for the life science revolution is our increasingly firm knowledge of the atomic composition of life forms and the atomic level structures underlying the machinery of biological cells, where crystallography and other structure resolution methods continue to play the key role. Like a century ago with materials we see life scientists taking an active role by exploiting and redesigning systems discovered, thereby expanding old industries like the pharmaceutical industry as well as starting new ones.
Naturally, these new technologies are tied to the scale of biological cells and their modules, namely the nanoscale. At the present time, investigation of nanoscale systems is hampered by a wide lack of imaging tools: the nanoscale is too small for light microscopy and too large for X-ray crystallography; it is too heterogeneous for NMR and too “wet” for electron microscopy. However, it turns out that computer simulations are an excellent match for imaging in bionanotechnology, covering the length scale rather well and covering time scales up to many nanoseconds for atomic level descriptions and much longer for coarser descriptions. This has been achieved through recent advances in computer hardware and software as well as through developing multi-scale simulation methodologies.
Ordinarily, one does not think of computer simulations as imaging modalities, at least not reliable ones. However, the veracity of computer simulations has steadily improved over time and has reached in some cases a level that matches the accuracy of good experimental methods. An example is the simulation of membrane channels where errors, e.g., in voltage - current relationships, are on the order of 10% [1]. Likewise, simulations of synthetic nanopores (see below) have reached such close agreement with observation that researchers have begun to rely on the methodology in their design strategies. Images based on experimental procedures invariably come with a degree of significant artifacts, yet researchers would probably always prefer having a less than perfect image over having no image at all. This wisdom should be applied to imaging by means of computer modeling as well.
Naturally, bionanotechnology merges biomaterials with technical materials, often in an unconventional marriage, i.e., the participating materials seldom having been observed together. Prime examples are nanotubes used as sensors for high sensitivity assays or employed even in living cells; other examples include electronic chips made of silicon compounds used to assay biomolecules. Biomolecules on the one hand and nanotubes or silicon wafers on the other hand are well known separately and, even though not trivial, computer simulations have excellent chances to describe correctly the interactions between the newly wedded materials, though some effort is required involving concepts and methodologies typically not known at the same time to computational material scientists or to computational life scientists.
Lastly, bionanotechnology views biological cells as bags full of tricks that can be exploited for technical aims like bioremediation or the future energy economy. This requires one to redesign for example proteins (or whole organisms), stripping them to the bare essentials needed for the desired function, and making them more robust for technical deployment. In case of proteins, when they are structurally known, computational modeling has come a long way in describing functions and it is actually a rather straightforward, though not necessarily easy, task to modify proteins computationally towards a desired technical end.
The authors of this paper strongly advocate the use of modern biomolecular simulation approaches for bionanotechnology. However, the advocacy is for cases where technological development requires ideas, not where it requires otherwise unavailable data. Three case studies demonstrate the great impact that modeling can have in nanotechnology, but in all cases modeling delivers strategic suggestions, not quantitative data like unknown affinities or partition coefficients. Sometimes, such data can be provided through modeling, but in this role computational modeling is not at its best. The three cases presented below involve genuine bionanotechnological systems, the use of nanotubes as in situ biosensors, the use of nanopores in electronic nanotechnology for single biomolecule recordings, and the design of lipoproteins into scaffold proteins that assemble with lipids and membrane proteins into discoidal particles of nanometer extension. We describe below what role computational modeling played in each case.
Towards an efficient description of carbon nanotube-biomolecule interaction
Carbon nanotubes (CNTs) are hollow microtubules discovered in 1991 [2]. With narrow diameters at the nanometer scale, CNTs can grow as long as several microns, or even centimeters. A single tubule is referred to as a single-walled carbon nanotube (SWNT), while nested SWNTs form Russian doll-like structures, known as multi-walled carbon nanotubes. Unlike ordinary materials, SWNTs can be either metallic or semiconducting depending on their structural details [3].
After the discovery of CNTs, scientists and engineers started to pursue CNTs’ promising potential in biological applications, in particular, as drug delivery devices [4, 5, 6] and biosensors [7, 8]. Experimental evidence suggests that SWNTs can be internalized into living cells through endocytosis without apparent toxic effects [4, 5]. As a molecular transporter, SWNTs can shuttle various cargoes across the cellular membrane, opening a new route for drug delivery. In addition, SWNTs exhibit strong absorption and emission at near-infrared (NIR) wavelengths, where human tissue and biological fluids are nearly transparent. The NIR fluorescence intensity of SWNTs is subjected to change when the SWNTs are interacting with the biological environment. Thus, monitoring the variation in optical intensity allows sensitive detection of target biomolecules, qualifying SWNTs for in vivo biosensor applications [7]. The transporting ability of SWNTs combined with NIR technology give rise to a novel mechanism for cancer therapy as well [6]. Once functionalized with specific tumor markers, SWNTs can be recognized and uptaken by cancer cells. Subsequent NIR radiation heats the SWNTs and causes the selective destruction of tumor cells [6].
Central to the proposed biological applications is the interplay between SWNTs and the biological environment, such as the environmental influence on the optical property of SWNTs, their cellular uptake pathway, and their cytotoxicity. Due to the difficulty of manipulating and tracking these tiny little devices, information gleaned from experimental techniques on the above issues are quite limited, which requires important complements from molecular modeling methods to provide atomic details about the interface between SWNTs and the biological environment. For example, molecular dynamics (MD) simulations revealed the insertion mechanism of a short SWNT into the cell membrane [9], as well as the molecular transport dynamics of SWNT channels conducting water [10, 11, 12, 13], ions [14], polymers [15], and nucleic acids [16]. MD simulations also predicted that SWNT-confined water molecules form well-organized structures [11, 12], which were later confirmed by neutron scattering experiments [17].
To faithfully characterize the nanotube-biomolecule interaction in MD simulations, two types of interactions need to be well-understood, the van der Waals (vdW) and the Coulomb interaction. The vdW interaction results in a weak attraction, as exemplified by the observed entry of water molecules into the hydrophobic interior of SWNTs [10]. Key physical quantities governing the Coulomb interaction are the atomic partial charges and the dielectric constants. Unfortunately, in the existing classical MD simulations, the atomic partial charge on each carbon atom is assumed neutral without justification, and the nanotube polarizability is overlooked. This oversimplified picture may harm the accuracy and weaken the strength of molecular modeling.
During recent decades, tremendous efforts have been made to develop polarizable models for water and proteins [18, 19, 20], however comparable studies on SWNTs were rarely seen, in spite of the fact that the dielectric response of channels is expected to affect the filling statistics [21]. Unlike many biological channels, SWNTs are highly polarizable due to their delocalized π-electrons, which respond strongly to external fields [3]. A study of screening effects of infinitely long SWNTs to an external point charge impurity has revealed that metallic nanotubes can effiectively screen out the long-range Coulomb potential along the axial direction, while screening effects in semiconducting tubes are weaker [22]. Therefore, a polarizable SWNT model is highly demanded to accurately evaluate the contribution of the SWNT electrons to inter-molecular forces. Since the forces acting on system atoms need to be updated very frequently, e.g., at 1 fs time intervals in typical MD simulations, the model has to be computationally efficient to the extreme, yet accurate.
Polarizable SWNT model
To address this issue, we proposed a polarizable SWNT model [23, 24], where fixed atomic partial charges are parameterized to reproduce the first principle electrostatic potential field under a numerical fitting scheme [25, 26], and where induced atomic partial charges, i.e., the dielectric response of SWNTs, are determined “on-the-fly” through a semi-empirical quantum mechanical approach [23]. For long tube segments, where first principle calculations are too costly, empirical expressions of partial charges are suggested [24]. When compared to the results from the computationally expensive first principle method, a good agreement is found for key properties including energy gaps and dielectric constants [24] in the suggested model despite its extreme computational simplicity.
The body of the model SWNT structures contains a number of carbon sections (C1, C2, …) with 12 carbon atoms in each section; the open nanotube ends are saturated by hydrogen atoms. The structure of a 12-section SWNT is shown in figure 1 a, b. Our calculations [24] suggest that the atomic partial charges at the tube edges are an order of magnitude larger than those in the middle of the tube, and each hydrogen atom loses 0.13 – 0.14 electrons to carbon atoms, as a hydrogen atom has a lower electronegativity than a carbon atom. The charge transfer creates an appreciable dipole moment at the tube edges, which can interact with the solutes and affect their transport behavior through the SWNT.
Figure 1.
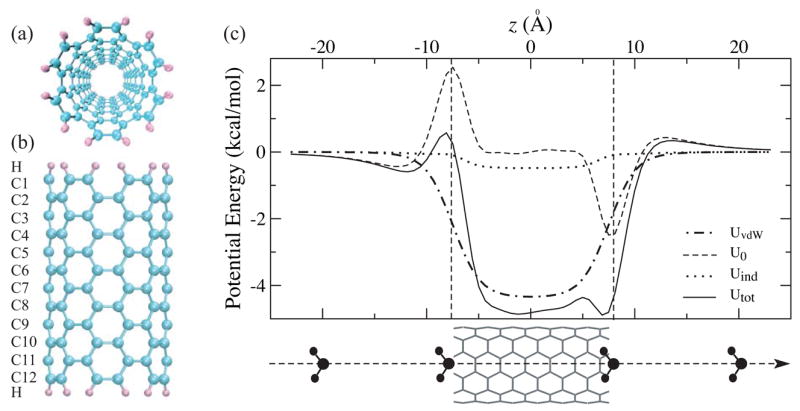
(a) Top view and (b) side view of an ideal 12-section SWNT. (c) Potential energy profiles for the same SWNT interacting with a water molecule of fixed orientation at various positions along the tube axis.
The dielectric properties of SWNTs are described through a semi-empirical quantum mechanical model [23, 24], where the induced charges of a SWNT can be determined on each carbon atom under any given external electric field. When a uniform electric field is applied parallel or perpendicular to a SWNT, the screening ability of the SWNT is measured as the ratio of the external electric field over the total electric field (the sum of the external and the induced electric fields), defined as the dielectric constants. For a 12-section SWNT, both parallel and perpendicular dielectric constants are about 5. When the tube length increases, the parallel dielectric constants grow linearly, while the perpendicular dielectric constants converges rapidly to a value close to 5 [23].
For biological applications of SWNTs, knowledge of the water-SWNT and ion-SWNT interactions is of fundamental importance. In the following, the suitability of the polarizable SWNT model, demonstrated through studies [23, 24, 27] of these two types of interactions, is reviewed.
Water-nanotube interaction
The water-SWNT interaction includes the short-range vdW interaction, UvdW, the Coulomb interaction arising from the static atomic partial charges, U0, and the interaction between water and charges induced on the SWNT, Uind. In figure 1 c, we present the potential energy between a water molecule and a 12-section SWNT segment [24]. The oxygen atom of a water molecule is moved along the tube axis z, and the hydrogen atoms are symmetrically placed giving the water molecule a fixed orientation. Geometry and atomic partial charges of the water molecule are assumed to be those of the TIP3P model, and the C-O vdW interaction takes the form of Lennard-Jones potential with parameters adopted from the Amber 94 force field, i.e., UvdW(r) = 4.0 εco [(σco/r)12 − (σco/r)6], where εco = 0.1143 kcal/mol and σco = 3.2752 Å.
As one can see, UvdW is symmetric with a simple potential well of −4.34 kcal/mol in the middle of the tube. The edge dipoles of the SWNT strongly affect the energetics of water transport by creating a high potential barrier of 2.97 kcal/mol on the left edge and a potential well of the same magnitude on the right edge. This anti-symmetric feature of U0 is due to the assumed fixed orientation of the water molecule. In the middle of the tube, U0 is nearly vanishing. Uind has a similar shape as UvdW, but is an order of magnitude smaller. Therefore, the major contribution of the total potential Utot stems from UvdW, but at the edges, the shape is dominated by U0. A previous study [28] indicated that water flow is primarily limited by the barriers at the entry and exit of the nanotube, so it becomes more important to improve the potential field near the tube edges by including the contribution from U0.
Although Uind of a single water molecule is small compared to other contributions in figure 1 c, it becomes significant for water chains, ions, and charged molecules. Figure 2 is a snapshot taken from a classical MD simulation [13]. Due to the confinement of the tube interior, six water molecules are arranged into a water chain. By forming hydrogen bonds, their dipole moments are preferably aligned along the tube axis. For the given snapshot, the magnitude of the total water dipole is 12.23 Debye. The electrostatic field of the water dipoles polarizes the nanotube and induces a charge distribution on the nanotube surface (see figure 2). The resulting effective counter-dipole leads to a net dipole of only 5.24 Debye, much less than the original value (12.23 Debye) [23]. In this case, Uind reaches 3.7 kcal/mol, which turns out to be appreciable. For a point charge +e located at the tube center, Uind was found to be as large as 15.2 kcal/mol [23]. Technically, people want to control the transport of ions or charge molecules through SWNTs by means of applying external electric fields. Neglect of the screening ability of SWNTs in the modeling should overestimate the impact of external fields.
Figure 2.
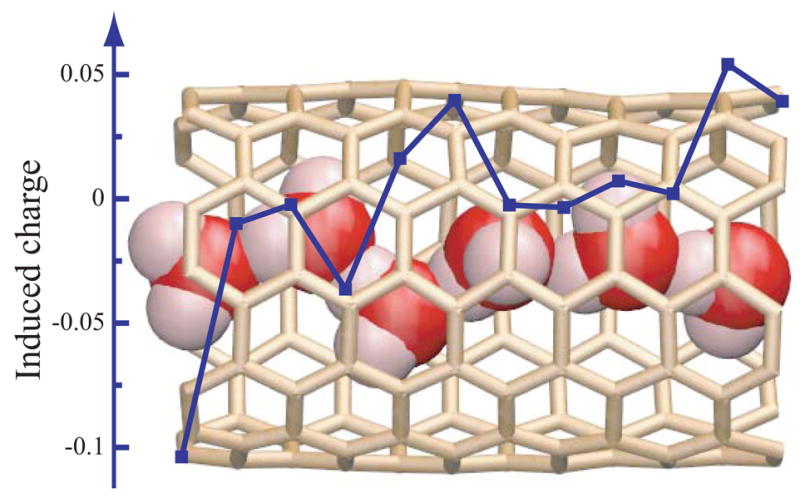
The background is a snapshot taken from a MD simulation of a 6-water-wire (vdW representation) inside a nanotube segment. Water molecules outside the nanotube are not shown for clarity. The overlaying curve plots the total induced surface charges (in squares) of each section of the nanotube.
Ion-nanotube interaction
The ion-nanotube interaction is demonstrated through a system consisting of a potassium ion (K+) and a 12-section SWNT [27]. The interaction potential U(R⃗) is expressed as
| (1) |
where Q and R⃗, respectively, are the charge and coordinates of the K+ ion. The summation index, i, runs through each atomic site of the SWNT. The vdW interaction was described by the Lennard-Jones potential with parameters taken from the CHARMM27 force field, i.e., εKH = 0.043749 kcal/mol, εKC = 0.078039 kcal/mol, σKH = 2.7473 Å, and σKC = 3.3464 Å. The initial atomic partial charges q0i were determined from the polarizable SWNT model [24]. As the SWNT is polarized by the ion, the instantaneous atomic partial charges of the SWNT are updated constantly as the sum of the bare charges, q0, and the induced charges, δq, in order to take into account the polarization effect in MD simulations.
The potential profile along the z axis is plotted in figure 3 a, which is dominated by the electrostatic interactions. As one can see, U0 is attractive inside the SWNT and repulsive outside, a feature caused by the dipole fields from the edge dipole moments of the SWNT. In a nonpolarizable model, the access barrier of UvdW +U0 amounts to 7.02 kcal/mol, which would make it extremely difficult for a K+ ion to enter the SWNT at room temperature. However, Uind causes a substantial K+-SWNT attraction. As a consequence, the access barrier of Utot is lowered to only 1.05 kcal/mol. Inside the SWNT, Utot becomes strongly attractive with a minimum at about −30 kcal/mol. Compared to the nonpolarizable model, the edge of the central potential energy well becomes much steeper. As revealed by the polarizable model, the lowered access barrier enables the K+ ion to enter the SWNT spontaneously at room temperature, and the deep well traps the ion firmly. In the radial direction, the ion is confined within a few Å from the center due to the vdW repulsion.
Figure 3.
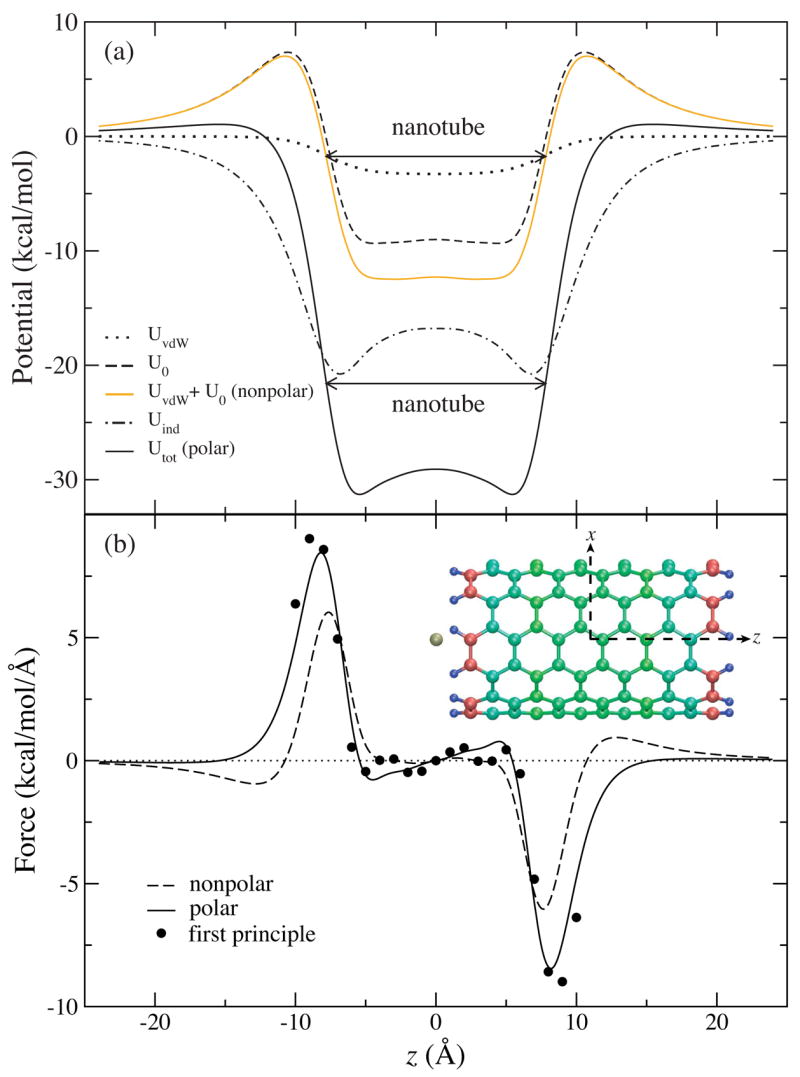
Energetics of the K+-SWNT system. (a) Interaction energies between the potassium ion and the nanotube along the z-axis. (b) Force acting on the ion positioned along the z-axis. Comparison is made between a nonpolarizable nanotube model (dashed line), a polarizable nanotube model (solid line), and first principle calculations (solid circles). Inset shows the configuration of the K+-SWNT complex with the SWNT colored according to initial atomic partial charges (Blue: positive; Red: negative).
To evaluate the quality of the suggested SWNT model, the force acting on the ion positioned along the z-axis was also calculated from the first principle method. In figure 3 b, we notice a remarkable agreement between the first principle and the semi-empirical forces, even though the methods differ by a factor of about a thousand in computational cost. The consistency indicates that by employing the polarizable SWNT model in a MD simulation, one can capture the dynamics of the K+-SWNT complex.
The system was simulated for 4.84 ps in a microcanonical ensemble with the SWNT frozen at its ideal geometry. At the beginning of the simulation, a K+ ion was released 1.0 Å away from one end of the SWNT on the z-axis with zero initial velocity. The ion is attracted by the potential well, and began to oscillate. During the simulation, the ion finished two complete oscillation cycles with a frequency of 0.43 terahertz (THz) [27]. The motion of the ion naturally drags the electrons of the SWNT to oscillate at the same frequency. The total energy of the ion, a sum of potential energy and kinetic energy, was conserved throughout the simulation with a peak deviation of 0.02% [27]. The simulation method has recently been verified by comparing the main results to a Car-Parrinello molecular dynamics calculation on a Li+ ion confined in an 8-section SWNT [29]. Despite the huge difference in the computational cost, the method agreed well in the THz oscillation behavior of the ion.
The K+-SWNT simulation demonstrates the accuracy and efficiency of the polarizable SWNT model, which is computational cheap for large scale simulations and takes into account the electronic degrees of freedom of SWNTs as well. Implementation of the suggested model into a classical MD engine yields a quantum mechanical/molecular mechanical description, which can provide guidance for practical issues such as selecting biomolecules for SWNT-biosensor coating, explaining the mechanism of nanotube internalization and trafficking, and furnishing the quantum mechanical theory for nanotube optical spectra and their interpretation in terms of nanotube - adsorbate interactions.
Nanopore device for high-throughput sequencing of DNA
The sequence of a human genome is about 3 billion base pairs long. Certain variations in the genome sequence, either inherited at birth or acquired with time through mutations, are known to cause serious health problems. With current technology, individual genomes can be determined to the desired 99.99% accuracy within two months for approximately 10 million dollars, which is obviously too lengthy and too costly to be useful in personal medicine. As research in nanotechnology extends the tools for fabrication of integrated circuits to nanometer dimensions, alternative technologies for faster and cheaper DNA sequencing are likely to emerge. For example, a device for high-throughput DNA sequencing may be built around a 2-nm-diameter pore in a thin (2–5 nm thick) synthetic membrane [30, 31, 32, 33]. The sequence of a DNA molecule can be read by such a device, in principle, through a semiconductor detector, integrated within the pore, that records electric signals induced by DNA passing through the pore [34].
Sequencing DNA strands with a nanopore device has not been achieved yet. As A, C, G, and T DNA nucleotides differ from each other by only a few atoms, in order to relate the sequence of DNA to the measured electrical signals, it is essential to characterize the conformations of DNA inside the pore in atomic detail. At present, MD is the only methodology that can provide realistic images of microscopic events taking place inside the nanosensor. Atom by atom, we build microscopic models of the experimental systems and simulate, adapting the methodology developed by us for membrane proteins [35, 36], translocation of DNA through pores in synthetic membranes [1]. Below we describe how one can simulate with MD electric field-driven translocation of DNA through nanopores in silicon nitride (Si3N4), compute electric signals produced by the DNA translocation, and expand the scope of MD simulations to other synthetic materials, i.e., silicon dioxide.
MD simulation of DNA translocation through a synthetic nanopore
To construct a microscopic model of a nanopore, we first build a Si3N4 membrane by replicating a unit cell of a β-Si3N4 crystal. By removing atoms from the Si3N4 membrane, we produce pores of symmetric double-conical (hourglass) shapes with radii that correspond to experiment. After placing a DNA molecule in front of the pore, we add water and ions on both sides of the membrane. The final systems measure from 10 to 30 nm in the direction normal to the membrane and include up to 200,000 atoms. To accomplish MD simulations on a system comprising of DNA and Si3N4, the molecular force field describing water, ions, and nucleic acids [37] is combined with the MSXX molecular force field for Si3N4 [38]. The protocols of the simulation are described in detail elsewhere [1].
When a uniform electrical field is applied to all atoms in our system, it induces, at the beginning of the simulation, a rearrangement of the ions and water that focuses the electrical field to the vicinity of the membrane, neutralizing the field in the bulk. The resulting voltage bias V across the simulated system depends both on the magnitude of the applied field E and the dimension LZ of the system in the direction of the field [39], i.e., V = ELz; the electrostatic potential near the pore is not uniform.
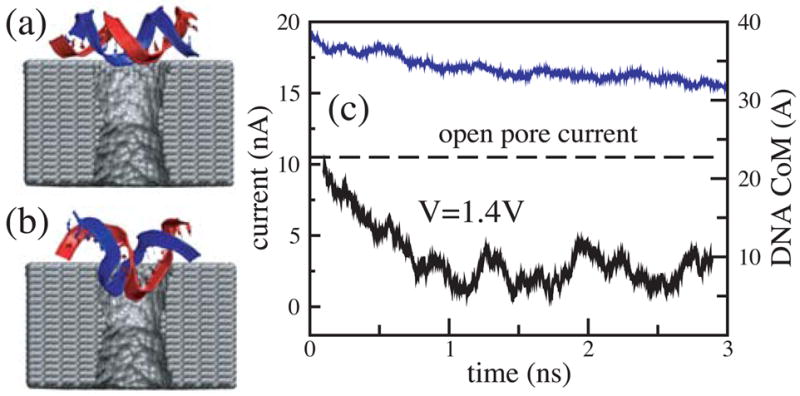
Applying a 1.4 V bias over a 5.2-nm-thick membrane we can observe, within the time scale of a MD simulation, a full permeation of a short (20–60 base pairs) DNA fragment through the nanopore. A typical translocation event is shown in figure 4. At the beginning of the simulation, a 20 base pair fragment of double stranded (ds) DNA is placed in front of a 2.2 × 2.6 nm2 pore, as shown in figure 4 a. Within the first 2 ns, the end of DNA nearest to the pore is pulled into the pore by its charged backbone. The rest of the molecule follows that end, which, after 4 ns, encounters the narrowest part of the pore. At this point, the terminal Watson-Crick base-pair splits, and the freed nucleotides adhere with their bases to the surface of the pore, as shown in figure 4 b. The translocation proceeds further until it halts after 20 ns in the conformation similar to the one shown in figure 4 c. At this point, the three Watson-Crick base-pairs that were first to enter the pore are split; one of the terminal bases continues to adhere strongly to the pore surface. The system is driven out of this metastable conformation by increasing the voltage bias from 1.4 to 4.4 V for 0.3 ns (approximately after 30 ns from the beginning of the simulation). Subsequently, the simulation was continued at a 1.4 V bias. DNA slowly exits the pore, while one of the bases holds firmly to the surface of the pore (figure 4 d). After about 50 ns, most of the DNA has left the pore, but a few bases remain attached to the pore surface (figure 4 e); nine of twenty base-pairs are split.
Figure 4.
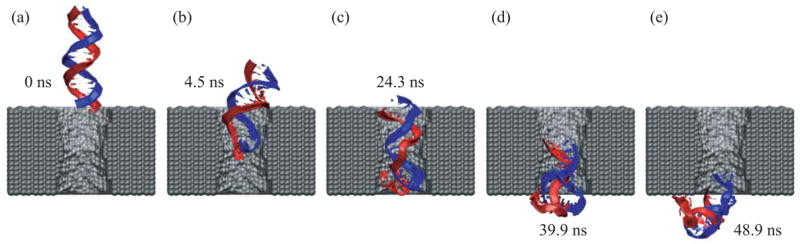
MD simulation of DNA translocation through a nanopore in a Si3N4 membrane. (a) Beginning of the simulation. (b) The moment when the terminal Watson-Crick base pair splits at the narrowest part of the pore. (c) A moment during the time interval of 8 ns that DNA spends in the conformation shown without moving. (d) The moment when DNA exits the pore while one base at the DNA end remains firmly attached to the surface of the nanopore. (e) End of the simulation, when most of the DNA has left the pore and the ionic current has returned to the open pore level.
Computing electric signals resulting from DNA translocation
In addition to driving DNA through the nanopore, the electric field induces displacements of ions, forcing them to move through the pore in opposite directions. When DNA enters the pore, it reduces the ionic current; however, after the DNA translocation is completed, the ionic current recovers to the open pore level. Using this simple principle, Kasianowicz and co-workers [40] measured, for the first time, the ionic current blockades produced by RNA and DNA strands electrophoretically driven through the transmembrane pore of the α-hemolysin channel [41], which was suspended in a lipid bilayer. The subsequent studies showed that using this approach, one can discriminate different sequences of RNA [42], of DNA homopolymers [43], as well as the segments of purine or pyrimidine nucleotides within a single RNA strand [42]. Single nucleotide resolution has been demonstrated for DNA hairpins [44, 45, 46], raising the prospect of creating a nanopore sensor capable of reading the nucleotide sequence directly from a DNA or RNA strand. Similar studies carried out on synthetic nanopores showed only limited success [31, 33, 47]. Using MD simulation, we could demonstrate that, in the case of synthetic nanopores, current blockades do not necessary reflect translocation of DNA through the nanopore [1].
The ionic current can be computed from a MD trajectory by summing up local displacements of all ions over a time interval Δt:
| (2) |
where zi and qi are the z coordinate and the charge of atom i, respectively; Lz is the length of the simulated system in the direction of the applied electric field (the z axis in our case); the sum runs over all ions [1, 48]. In figure 5 we plot the ionic current (black) and the z coordinate of the DNA center of mass (blue) versus time for the MD trajectory illustrated by figure 4. The very first part of the figure (time < 1 ns) corresponds to a simulation in which DNA does not block the ionic current. When DNA is placed in front of the pore (vertical dashed line in figure 5), it is rapidly captured by the pore, which is reflected by the reduction of the ionic current. When DNA translocates through the membrane, the level of total ionic current appears to be correlated with the DNA velocity inside the pore: the faster DNA moves, the less it blocks the ionic current. The current returns to the open pore level after most of the DNA has left the pore, although some DNA remains inside the pore at the end of the simulation (figure 4 e).
Figure 5.

Simulated recording of the ionic current during DNA translocation through the nanopore. The black trace indicate the total ionic current, which is shown at the left vertical axes. The blue line represents the position of the DNA center of mass relative to the center of the Si3N4 membrane, which is shown at the right vertical axes. The vertical dashed line marks the moment when DNA was placed in front of the pore; the horizontal dashed lines indicates the open pore current. Snapshots from this simulation are shown in figure 4.
We have demonstrated so far that translocation of DNA through a synthetic nanopore results in a transient reduction of the ionic current. The reverse conjecture, i.e., that the transient reduction of the ionic current indicates DNA translocation through a nanopore, is not always valid. As the electrical field in the bulk of the electrolyte is zero, one can assume that DNA approaches the pore by diffusion, and, hence, the conformation in which DNA collides with the pore for the first time is random. Hence, the starting configuration in which DNA is placed in front of the pore normal to the surface of the membrane (figure 4 a) represents only a fraction of DNA’s first encounters with the nanopore. The other extreme case would be for DNA to approach the pore in the conformation shown in figure 6 a, i.e., parallel to the surface of the Si3N4 membrane.
Figure 6.
Blocking current without translocation. (a) Starting configuration of this MD simulation. (b) DNA conformation after 3 ns. (c) The ionic current (black) and the DNA center of mass (blue) versus time. Although DNA cannot permeate the pore in the conformation shown in b, the current reduction is comparable to that when DNA permeates the pore (c.f. figure 5). The pore has the same dimensions as in figure 5.
We started our next simulation from such conformation, placing the same 20 base pair fragment of dsDNA 12 Å away from the membrane. Within 3 ns, a 1.4 V bias drove DNA into the mouth of the pore, (figure 6 b). The ionic current was observed to drop by 75%, which is comparable to the level of the current blockade when DNA permeates the pore (figure 5). Thus, by comparing the results of the two MD simulations, we learn that large blockades of the ionic current do not necessarily indicate DNA translocation through a synthetic nanopore, implying that the ionic current readout is ambiguous in the case of synthetic nanopores. This apparent ambiguity can be resolved when instead of a Si3N4 membrane, the pore is made in a multi-layered silicon wafer, in which a thin layer of silicon dioxide is sandwiched between two layers of doped silicon. When DNA is driven through such a pore, it produces two independent voltage signals in the doped silicon layers, allowing one to unambiguously differentiate translocation of DNA from the obstruction of the pore mouth [34].
While the setup of our simulations faithfully reproduces the experimental conditions, our simulations have the following limitations. First, the time scale of MD simulations is currently limited to a few tens of nanoseconds, which does not allow us to investigate processes that occur on a longer time scale. Second, our description of the silicon nitride surface is approximate, and more work has to be done in order to develop a microscopic force field that would quantitatively reproduce binding energies between DNA and a silicon nitride surface. Nevertheless, due to the double helical structure of dsDNA, binding of DNA nucleotides to the surface of the pore does not occur before dsDNA reaches the pore constriction. This allowed us to make quantitative predictions about the conditions of dsDNA permeation through Si3N4 nanopores, which were later confirmed by experiment [49, 50].
Mastering silica nanopore interactions
Molecular dynamics simulations have been successfully used to study and understand Si3N4 nanopore experiments [1, 31, 49, 50] and the methodology can be extended to simulate solid-state nanopores based on silica [34, 51]. However, a major hurdle in simulating those systems composed of inorganic materials and biological macromolecules is to describe the magnitudes of the interacting forces between the nanopore surface with water and biomacromolecules. A mathematical description of the system, a so-called force field, provides a set of functions for the potential energy of the system based on their atomic coordinates. Previous silica force fields were focused on reproducing bulk properties and then refined to describe surface properties, but they were not designed to take into account the interaction energies of silica with biopolymers in aqueous environments. A second problem is that the surface properties strongly depend on the particular arrangement of the exposed atoms; therefore, a detailed description of the nanopore surface is needed.
Our aim is to develop a model of silica surface to be used in MD simulations that accurately describes the interactions with water and biomacromolecules. The hydrophobicity, a key attribute of the surface, has been used to tune silica force fields. This property can be quantified by measuring the water contact angle (WCA), the angle between the tangent of a sessile water droplet and the solid surface. If the WCA is close to zero, the surface is considered “wet” or hydrophilic. If the angle is less than 90°, the surface is considered “partially wet”. The WCA value is the result of a delicate balance between specific solid-water interactions and the surface roughness. For silica, the WCA does not have a unique value, but depends on the thermal treatment of the sample. Exposed functional groups define the interacting regions and thus the wetting properties. Consequently, intermolecular interactions of silica, composed of vdW and electrostatic terms, can be adjusted to reproduce the surface wetting dependence.
Understanding the wetting behavior of silica is critical for the technical uses of silica nanopores. For example, in case of nanopores in Si3N4 membrane, wetting a dry pore takes about 20 hours [52]. At the silica surface, the silanol group (-Si-OH), with a hydroxyl group, controls the surface hydrophilicity through attracting water to the surface. Not all silanols are equivalent, and the arrangement of the neighboring atoms can also affect the affinity towards water. A complete dehydroxylated silica surface (without silanols) would exhibit a WCA of 42° [53]. Conversely, a complete hydroxylated surface, with a surface concentration of 4.6 silanol/nm2 [54], is completely hydrophilic. An experimental relationship has been established between the water contact angle and the number of surface silanols [53],
| (3) |
where aSiOH is the number of silanols per nm2 of silica surface divided by 4.6 and θ is the water contact angle.
Silica wetting can be studied by simulating a drop of water on top of a silica surface. Diverse silica surfaces can be obtained using numerical procedures that mimic experimental annealing [53, 55, 56, 57], varying the heating and quenching rates. In simulated annealed surfaces, exposed singly coordinated oxygens and triply coordinated silicons, called dangling atoms, resemble the silanol behavior and act as hydrophilic centers of diverse intensity. By using different water droplet-silica surface systems, the silica hydrophilicity can be estimated through measuring the WCA from the final overall droplet shape. Our simulations confirm that the number of dangling atoms is the main factor for wetting (figure 7). Due to their accessibility, dangling atoms enhance water attraction, and their interactions with water can be modulated to match the relationship between silanol concentration and the WCA. Our model is a close representation of the real surface, providing a good compromise between the heterogeneity of amorphous silica and the magnitude of the intermolecular forces. A silica force field based on wetting phenomena, can be employed to study permeation and translocation through nanopores [58].
Figure 7.
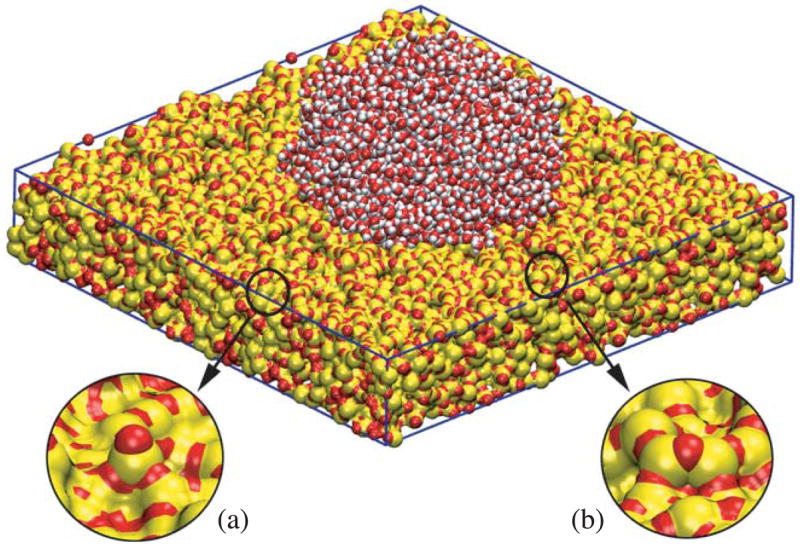
Water contact angle dependence on the surface. (a) Dangling atoms are singly coordinated oxygens and triply coordinated silicons. They are hydrophilic centers and their surface concentration determines the wettability of the surface. (b) No dangling atoms are effiectively screened by neighbors and expose less area, producing hydrophobic behavior.
The integration between solid-state nanodevices and biomacromolecules, i.e., between “dry” and “wet” nanotechnology, is expected to be at the forefront of scientific research in the next decade [59]. However, simulating the diversity of aspects that happen in the confined nanopore environment demands fine-tuned force fields for intermolecular interactions. Some aspects to be described are: water permeation, blockage of ionic current, the distribution of the electrostatic potential, as well as interactions between the nanopore-surface, DNA, and ions. All these events are affected by the atomic structure of the nanopore and the interacting forces. Computer simulations are valuable tools to gain insight into that complexity, and to view the processes involved in single molecule recordings. Quite literally, computer simulations play the role of nanoscopes.
Nanodiscs: discoidal protein-lipid particles
Nanodiscs are nanometer sized lipid bilayers which are stabilized by amphiphathic proteins. They provide a platform in which to embed, solubilize, and study single-molecule membrane proteins. Membrane proteins perform a wide range of functions such as cell-cell signaling and formation of transmembrane channels and pores. They comprise around 30 percent of the total proteins in cells and are often the target of pharmaceutical drugs. However, membrane proteins can be difficult to study experimentally due to their hydrophobic domains, which necessitate the use of detergents to remove them from the membrane and maintain their solubility. Because of this, membrane proteins are often studied under non-native conditions such as high detergent concentrations and in micelles. The effect of these non-native environments on the structure and function of the proteins are unknown. It is therefore desirable to be able to study membrane proteins, especially integral membrane proteins, in a more native lipid bilayer environment. The difficulties arising from studying membrane proteins are what has motivated scientists to engineer nanometer sized discoidal lipid bilayers stabilized by amphipathic helical proteins, termed nanodiscs [60, 61]. Such discs furnish the desired nanoenvironment for membrane proteins.
Engineering nanodiscs
Nanodiscs are homogeneous protein-lipid particles of discrete size and composition. The proteins forming nanodiscs are uniquely engineered to solubilize a small lipid bilayer. These proteins, termed membrane scaffold proteins, are long helical amphipathic proteins, having a hydrophobic and a hydrophilic face. The hydrophobic face of the protein wraps around the hydrophobic lipid tails, leaving the hydrophilic face oriented out towards the aqueous environment. This unique property is what allows the membrane scaffold protein to solubilize the lipid bilayer core [61]. The inspiration for developing nanodiscs came directly from Nature. High-density lipoprotein (HDL) particles circulate in the blood of higher animals accumulating cholesterol, lipids and fatty acids from peripheral tissues and transporting them to the liver for processing and degradation. Nascent discoidal HDLs form when the primary protein component, apolipoprotein A-1 (apo A-1) associates with lipids. These particles are generally heterogeneous in size forming nanometer-sized lipid bilayers which are soluble due to the amphipathic nature of apo A-1. Thus, Nature has provided a solution to the problem of studying membrane proteins in a native lipid bilayer environment. Scientists simply had to adapt what had been developed during biological evolution. For this purpose, they designed systems that furnished homogeneous discoidal lipid-protein particles of discrete size and composition, in other words, nanodiscs [61, 62].
In order to create homogeneous particles, apo A-1 was truncated, removing the N-terminal globular domain and leaving the C-terminal lipid binding domain. This left only the portion of the amphipathic helical apo A-1 protein which binds to the lipids forming the nanometer sized discoidal particles. The remaining protein consisted of 200 amino acid residues, eight 22-mer and two 11-mer amphipathic helical repeats, punctuated by proline and glycine residues [63, 64]. These truncated proteins were given the name membrane scaffold proteins [61]. Extensions and deletions of 11 or 22-mer helical segments were used to create nanodiscs ranging from 10–13 nm in diameter (figure 8) [62]. This range in diameter allows for control of the oligomerization state of incorporated membrane proteins [65].
Figure 8.
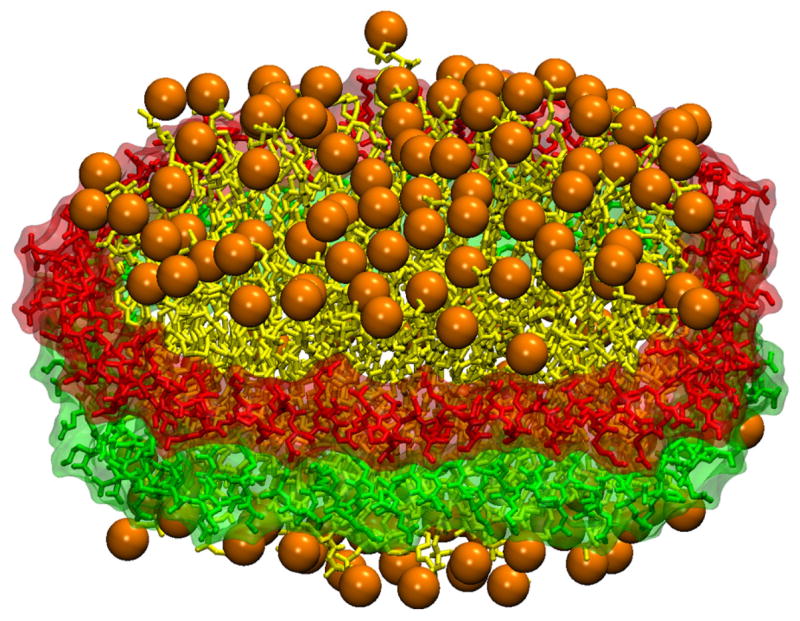
Nanodiscs are discoidal lipid-protein complexes. They consist of two membrane scaffold proteins shown in red and green surrounding a lipid bilayer core shown in yellow with the lipid head groups highlighted in orange.
A variety of membrane proteins have been successfully incorporated into nanodiscs and characterized: cytochrome P450 2B4 [66], P450 cytochrome monoxygenase [65, 67, 68], bacteriorhodopsin [69, 70] (figure 9), and a type of G protein-coupled receptors (GPCR) called β2 adrenergic receptor [71]. Additionally, nanodiscs have provided a route to study various lipid bilayer properties. For instance, differences in phospholipid phase transitions were observed between the lipid bilayer in nanodiscs and liposomal preparations [72], and the effects of lipid domain size and the protein-lipid interface on lipid structure were investigated in the thermotropic phase transition of various lipids using nanodiscs [73].
Figure 9.
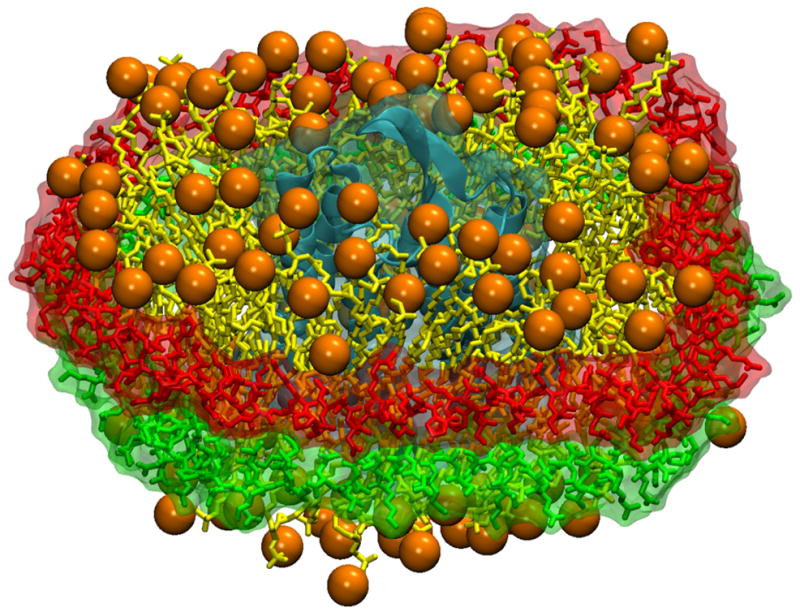
Nanodiscs provide a native lipid-bilayer environment in which to embed and study membrane proteins. Shown here is a bacteriorhodopsin monomer (in cyan) embedded in a nanodisc with membrane scaffold proteins (colored in green and red) surrounding a lipid bilayer (in orange and yellow).
Even though HDL particles have been experimentally studied for decades, a debate continues concerning the structure of apo A-1. The structure of apo A-1 is applicable to nanodiscs because the original membrane scaffold protein (without additional truncations or extensions) mimics the lipid binding domain of apo A-1 [61]. The structure of apo A-1 in its nascent discoidal form has not been resolved using high-resolution structural techniques such as X-ray crystallography or NMR. Several models exist for the structure of apo A-1 in discoidal HDL particles including the double-belt [74, 75], picket-fence [76, 77], and helical-hairpin [78, 79] models. A recent review article by Davidson and Silva (2005) [80] provides an overview of the various models of discoidal HDL (as well as lipid-free and mature spherical HDL) and the experimental results supporting each model. Molecular modeling verified by experiments can step in and develop a structural model of discoidal lipoproteins. Without such a model, data can be difficult to interpret and the de novo design of scaffold proteins challenging, if not impossible.
Lipid binding domain of apo A-1 studied by all-atom molecular dynamics
Apo A-1 protein was originally predicted to contain a 200-residue lipid binding domain and the initial membrane scaffold proteins were produced to be identical to them. However, nanodiscs assembled from 11 or 22 N-terminal residue truncated membrane scaffold proteins resulted in nanodiscs of identical dimensions as full 200-residue scaffold protein nanodiscs. This led to the belief that the eliminated residues are not needed to form these ~10 nm protein-lipid particles. All-atom molecular dynamics was employed to investigate the structure of the membrane scaffold protein surrounding a lipid bilayer core. Simulations were carried out on nanodiscs produced from full-length 200-residue scaffold proteins as well as scaffold proteins with 11 or 22 residue truncations. Two membrane scaffold proteins were wrapped around a 160 DPPC lipid bilayer core in a double-belt fashion (figure 8). Each nanodisc remained stable within the multiple nanosecond simulations; however, differences in size and planarity of the nanodiscs provided evidence on their structure. Simple measurements of the nanodisc diameter revealed that indeed the removal of the first 22 residues of the membrane scaffold proteins did not result in smaller discs.
Simulated all-atom structures were used to calculate small-angle X-ray scattering curves for comparison with experimental data collected on nanodiscs. Small-angle X-ray scattering is a low-resolution technique which is useful in determining the size and shape of homogeneous particles in solution. The technique is also sensitive to changes in the lipid bilayer, such as bilayer thickness. Comparisons between all-atom simulations and experimental data revealed that indeed the first 17 to 18 residues of the originally predicted 200 residue lipid-binding domain were not needed and most likely did not bind to lipids in these nanodiscs [70]. This had implications to not only nanodiscs, but to nascent discoidal HDL particles as well, suggesting that in HDL particles with the same stoichiometry and size as these nanodiscs, the lipid binding domain is actually smaller than the originally predicted 200 C-terminal residues of apo A-1. However, despite the apparent agreement between experiments and simulations, conclusive evidence for the structure of nanodiscs, in particular the geometry of the scaffold proteins wrapping around the lipid tails, does not exist. This deficit warrants further investigation.
Assembly of nanodiscs using coarse grained molecular dynamics
The assembly of nanodiscs has been optimized to produce homogeneous particles [61]. The process uses a detergent to solubilize the lipids and membrane scaffold proteins. The detergent is removed using either dialysis or detergent removal beads. Using an optimized starting ratio of protein to lipid, homogeneous discoidal nanodiscs form with discrete size and composition [61, 62]. One way to predict the structure of nanodiscs would be to simulate the experimental assembly. However, conventional all-atom simulations cover too short of a timescale to account for the assembly of discoidal HDL particles.
Due to the short timescales which can be realistically simulated using all-atom molecular dynamics, a coarse grained approach was adapted for assembly of nanodiscs and HDL particles on a millisecond timescale. Recent advances in coarse grained modeling have resulted in several coarse grained lipid models which allow the study of lipid assembly on a micrometer length scale and on a millisecond timescale. Coarse grained models reduce the overall system size compared with all-atom models by mapping clusters of atoms onto coarse grained beads. In addition to the reduction in system size, coarse grained models use a combination of short-range electrostatics and a minimal number of bead types to further improve computational efficiency [81, 82].
A coarse grained protein-lipid model was developed based on the Marrink et al. [82] coarse grained lipid-water model. The coarse grained lipid model of Marrink et al. [82] was adapted unaltered to reproduce lipid assembly, including DPPC lipids. This model excels through the ease of implementing the potential energy function in a molecular dynamics program, and indeed it was similarly implemented in the authors’ program NAMD2 [83]. The lipid-water coarse grained model was extended to include a description for protein coarse graining. In the new model, protein amino acid residues are represented by two coarse grained beads (except for glycine which is represented by a single bead); DPPC lipids are represented by 12 coarse grained beads, and four water molecules are represented by a single coarse grained bead. The coarse graining reduces system size by about ten-fold and allows integration time steps of 25 to 50 fs. Along with the use of short-range electrostatics and the minimal number of bead types, an effiective speed-up of 1500 times that of all-atom simulations can be achieved [84].
This coarse grained model was used to simulate preformed nanodiscs and was found to reproduce very well the overall structural features such as nanodisc diameter and lipid bilayer thickness at various temperatures. Lipid perturbations near the protein-lipid interface were also found with this model to be consistent with all-atom and experimental results [84]. The model was next used to assemble a nanodisc. A preformed lipid micelle was used and the membrane scaffold proteins were wrapped around either side of the lipid micelle in a semicircle (figure 10 a). The simulations showed that the lipid micelle quickly forms a bilayer and the two scaffold proteins attach and reorient themselves onto either side, exhibiting a structure similar to the picket-fence model, but with much more protein disorder (figure 10 b and c) [84].
Figure 10.
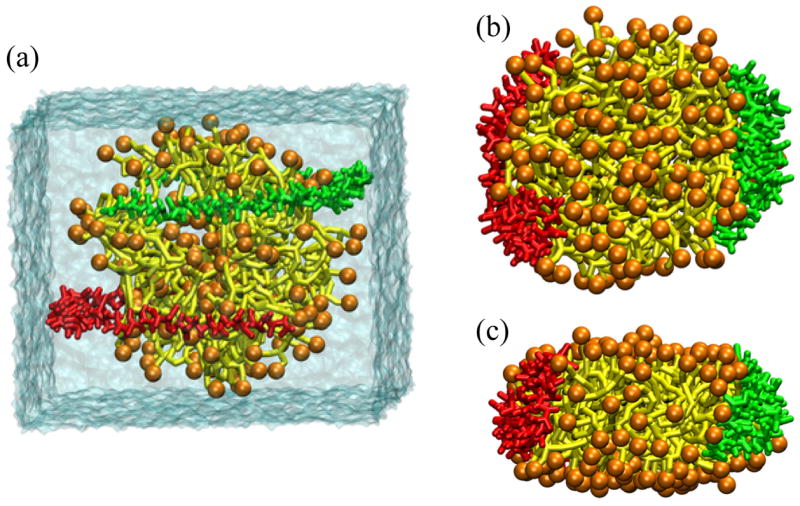
Coarse-grained molecular dynamics assembly of nanodiscs. The nanodiscs are shown with the lipid head groups in orange and the lipid tails in yellow, the two membrane scaffold proteins are shown in green and red. (a) The initial configuration is shown with the lipids preassembled in a micelle with the scaffold proteins wrapped around either side in semi-circles. The results of a 1.3 μs simulation are shown from a (b) top view and (c) side view [84].
It appears plausible that the picket-fence-like structure is more realistic for lipoproteins in vivo and most likely is a key intermediate structure in nanodisc formation. The picket-fence model seems favorable because it is easily formed from a random starting configuration of lipids and scaffold proteins, whereas the double-belt model carries a high entropic penalty. The double-belt structure may develop after longer times due to the formation of energetically favorable salt-bridging between the two scaffold protein strands, and only as a result of optimized ratios of proteins to lipids, as for nanodiscs. These optimized assembly conditions may never present themselves in lipoproteins in vivo.
Conclusion
The three case studies described above are intended to showcase how molecular modeling contributes successfully to bionanotechnology. In case of the use of nanotubes in biomedicine the key issue of the methodology is that the electronic system of π-electrons in the SWNTs are highly polarizable and easily influenced by environmental molecular factors. This influence, which affects also the optical absorption properties, turns SWNTs into sensors and contributes to interaction energies between molecules internalized or absorbed by SWNTs as well. A systematic development needs to merge the physics of SWNTs with molecular cell biology. This is where modeling stepped in by developing a simulation method flexible enough to be effiectively employed for SWNTs embedded into biological environments, yet accurate enough to reproduce effects described by computationally expensive physical theories. The case study illustrates that modeling in the bionanotechnology field needs to adapt to new challenges, e.g., here to add new materials (SWNTs) to biomolecular modeling and to describe how biomolecules, e.g., DNA strands, affect the electronic properties of SWNTs.
In case of synthetic nanopores the issue is the single molecule electrical recording with the eventual aim of cheap, fast, and accurate DNA sequencing. In this case modeling needs to adapt to new materials, Si3N4 as well as SiO2. Furthermore, modeling needs to provide images of the translocation processes and electrostatics of the permeant - pore systems that are essential for guiding experiments and technological development. The images provided by the modelers, tested through predictions like blockage currents or ion conductivities verified by observation, are invaluable to the engineers. Not presented, but done already, are predictions of electronic signals measured along the nanopores translocating DNA; such predictions combine molecular dynamics simulations with the theory of electronic devices and yield clear estimates regarding the sensitivity of measured signals to DNA properties like base pair sequence.
In case of nanodiscs the issue is to make available a nanoscale lipid bilayer membrane for study of related biomedical processes like receptor binding or cholesterol uptake. On the one hand, proteins native to human cells need to be redesigned for the technical purpose, on the other hand the actual equilibrium structures and dynamical properties of proteins and cholesterol in nanodiscs need to be visualized. Biomolecular modeling played a role in both aspects, testing the properties of redesigned scaffold proteins maintaining nanodisc shapes, and illustrating the most likely assembly of nanodiscs. Both activities are essential for guiding the technical use of nanodiscs.
The three case studies shown are exemplary for the many opportunities that biomolecular modeling offers in modern bionanotechnology. Modeling is a rather new research and development methodology, unfamiliar to many bench scientists and often considered not trustworthy. However, in entirely new technological areas like bionanotechnology qualitative concepts, pictures and suggestions are sorely needed and we hope that our examples have shown that biomolecular modeling can serve a critical role in this respect.
Acknowledgments
This work was supported by grants from the National Institutes of Health PHS-5-P41-RR05969; 1 R01 GM067887; R01-HG003713, and the National Science Foundation CCR 02-10843; MCB02-34938. The authors gladly acknowledge supercomputer time provided by Pittsburgh Supercomputer Center and the National Center for Supercomputing Applications via National Resources Allocation Committee grants MCA93S028 and MCA05S028S.
Footnotes
PACS numbers: 83.10.Mj, 87.15.Kg, 31.15.Ct, 81.07.-b
References
- 1.Aksimentiev A, Heng JB, Timp G, Schulten K. Microscopic kinetics of DNA translocation through synthetic nanopores. Biophys J. 2004;87:2086–97. doi: 10.1529/biophysj.104.042960. [DOI] [PMC free article] [PubMed] [Google Scholar]
- 2.Iijima S. Helical microtubules of graphitic carbon. Nature. 1991;354:56–8. [Google Scholar]
- 3.Saito R, Dresselhaus G, Dresselhaus MS. Physical Properties of Carbon Nanotubes. Imperial College Press; 1998. [Google Scholar]
- 4.Kam NWS, Jessop TC, Wender PA, Dai H. Nanotube molecular transporters: Internalization of carbon nanotube-protein conjugates into mammalian cells. J Am Chem Soc. 2004;126:6850–1. doi: 10.1021/ja0486059. [DOI] [PubMed] [Google Scholar]
- 5.Cherukuri P, Bachilo SM, Litovsky SH, Weisman RB. Near-infrared fluorescence microscopy of single-walled carbon nanotubes in phagocytic cells. J Am Chem Soc. 2004;126:15638–9. doi: 10.1021/ja0466311. [DOI] [PubMed] [Google Scholar]
- 6.Kam NWS, O’Connell M, Wisdom JA, Dai H. Carbon nanotubes as multifunctional biological transporters and near-infrared agents for selective cancer cell destruction. Proc Natl Acad Sci USA. 2005;102:11600–5. doi: 10.1073/pnas.0502680102. [DOI] [PMC free article] [PubMed] [Google Scholar]
- 7.Barone PW, Baik S, Heller DA, Strano MS. Near-infrared optical sensors based on single-walled carbon nanotubes. Nat Mater. 2005;4:86–92. doi: 10.1038/nmat1276. [DOI] [PubMed] [Google Scholar]
- 8.Staii C, Johnson AT., Jr DNA-decorated carbon nanotubes for chemical sensing. Nano Lett. 2005;5:1774–8. doi: 10.1021/nl051261f. [DOI] [PubMed] [Google Scholar]
- 9.Lopez CF, Nielsen SO, Moore PB, Klein ML. Understanding nature’s design for a nanosyringe. Proc Natl Acad Sci USA. 2004;101:4431–4. doi: 10.1073/pnas.0400352101. [DOI] [PMC free article] [PubMed] [Google Scholar]
- 10.Hummer G, Rasaiah JC, Noworyta JP. Water conduction through the hydrophobic channel of a carbon nanotube. Nature. 2001;414:188–90. doi: 10.1038/35102535. [DOI] [PubMed] [Google Scholar]
- 11.Noon WH, Ausman KD, Smalley RE, Ma J. Helical ice-sheets inside carbon nanotubes in the physiological condition. Chem Phys Lett. 2002;355:445–8. [Google Scholar]
- 12.Mashl RJ, Joseph S, Aluru NR, Jakobsson E. Anomalously immobilized water: A new water phase induced by confinement in nanotubes. Nano Letters. 2003;3:589–92. [Google Scholar]
- 13.Zhu F, Schulten K. Water and proton conduction through carbon nanotubes as models for biological channels. Biophys J. 2003;85:236–44. doi: 10.1016/S0006-3495(03)74469-5. [DOI] [PMC free article] [PubMed] [Google Scholar]
- 14.Joseph S, Mashl RJ, Jakobsson E, Aluru NR. Electrolytic transport in modified carbon nanotubes. Nano Letters. 2003;3:1399–403. [Google Scholar]
- 15.Wei C, Srivastava D. Theory of transport of long polymer molecules through carbon nanotube channel. Phys Rev Lett. 2003;91:235901. doi: 10.1103/PhysRevLett.91.235901. [DOI] [PubMed] [Google Scholar]
- 16.Yeh IC, Hummer G. Nucleic acid transport through carbon nanotube membranes. Proc Natl Acad Sci USA. 2004;101:12177–82. doi: 10.1073/pnas.0402699101. [DOI] [PMC free article] [PubMed] [Google Scholar]
- 17.Kolesnikov AI, Zanotti JM, Loong CK, Thiyagarajan P, Moravsky AP, Loutfy RO, Burnham CJ. Anomalously soft dynamics of water in a nanotube: A revelation of nanoscale confinement. Phys Rev Lett. 2004;93:035503. doi: 10.1103/PhysRevLett.93.035503. [DOI] [PubMed] [Google Scholar]
- 18.Sprik M, Klein ML. A polarizable model for water using distributed charge sites. J Chem Phys. 1988;89:7556–60. [Google Scholar]
- 19.Rappé AK, Goddard WA., III Charge equilibration for molecular dynamics simulations. J Phys Chem. 1991;95:3358–63. [Google Scholar]
- 20.Rick SW, Stuart SJ, Berne BJ. Dynamical fluctuating charge force fields: Application to liquid water. J Chem Phys. 1994;101:6141–56. [Google Scholar]
- 21.Allen R, Melchinnoa S, Hansen JP. Permeation of nanopores by water: the effects of channel polarization. J Phys: Condens Matter. 2003;15:S297–S302. [Google Scholar]
- 22.Lin MF, Chuu DS. Impurity screening in carbon nanotubes. Phys Rev B. 1997;56:4996–5002. [Google Scholar]
- 23.Lu D, Li Y, Rotkin SV, Ravaioli U, Schulten K. Finite-size effect and wall polarization in a carbon nanotube channel. Nano Lett. 2004;4:2383–7. [Google Scholar]
- 24.Lu D, Li Y, Ravaioli U, Schulten K. Empirical nanotube model for biological applications. J Phys Chem B. 2005;109:11461–7. doi: 10.1021/jp050420g. [DOI] [PMC free article] [PubMed] [Google Scholar]
- 25.Bayly CI, Cieplak P, Cornell WD, Kollman PA. A well-behaved electrostatic potential based method using charge restraints for deriving atomic charges - the resp model. J Phys Chem. 1993;97:10269–80. [Google Scholar]
- 26.Cornell WD, Cieplak P, Bayly CI, Kollman PA. Application of resp charges to calculate conformational energies, hydrogen-bond energies. & free-energies of solvation. J Am Chem Soc. 1993;115:9620–31. [Google Scholar]
- 27.Lu D, Li Y, Ravaioli U, Schulten K. Ion-nanotube terahertz oscillator. Phys Rev Lett. 2005 doi: 10.1103/PhysRevLett.95.246801. In press. [DOI] [PMC free article] [PubMed] [Google Scholar]
- 28.Kalra A, Garde S, Hummer G. Osmotic water transport through carbon nanotube membranes. Proc Natl Acad Sci USA. 2003;100:10175–80. doi: 10.1073/pnas.1633354100. [DOI] [PMC free article] [PubMed] [Google Scholar]
- 29.Cicero G, Galli G. 2005. private communication.
- 30.Li J, Gershow M, Stein D, Brandin E, Golovchenko JA. DNA molecules and configurations in a solid-state nanopore microscope. Nature Mater. 2003;2:611–5. doi: 10.1038/nmat965. [DOI] [PubMed] [Google Scholar]
- 31.Heng JB, Ho C, Kim T, Timp R, Aksimentiev A, Grinkova YV, Sligar S, Schulten K, Timp G. Sizing DNA using a nanometer-diameter pore. Biophys J. 2004;87:2905–11. doi: 10.1529/biophysj.104.041814. [DOI] [PMC free article] [PubMed] [Google Scholar]
- 32.Chang H, Kosari F, Andreadakis G, Alam MA, Vasmatzis G, Bashir R. DNA-mediated fluctuations in ionic current through silicon oxide nanopore channels. Nano Lett. 2004;4:1551–6. [Google Scholar]
- 33.Storm AJ, Chen JH, Zandbergen HW, Dekker C. Translocation of double-strand dna through a silicon oxide nanopore. Phys Rev E. 2005;71:051903–13. doi: 10.1103/PhysRevE.71.051903. [DOI] [PubMed] [Google Scholar]
- 34.Heng JB, Aksimentiev A, Ho C, Dimitrov V, Sorsch T, Miner J, Mansfield W, Schulten K, Timp G. Beyond the gene chip. Bell Labs Tech J. 2005 doi: 10.1002/bltj.20102. In press. [DOI] [PMC free article] [PubMed] [Google Scholar]
- 35.Tajkhorshid E, Nollert P, Jensen MØ, Miercke LJW, O’Connell J, Stroud RM, Schulten K. Control of the selectivity of the aquaporin water channel family by global orientational tuning. Science. 2002;296:525–30. doi: 10.1126/science.1067778. [DOI] [PubMed] [Google Scholar]
- 36.Aksimentiev A, Balabin IA, Fillingame RH, Schulten K. Insights into the molecular mechanism of rotation in the Fo sector of ATP synthase. Biophys J. 2004;86:1332–44. doi: 10.1016/S0006-3495(04)74205-8. [DOI] [PMC free article] [PubMed] [Google Scholar]
- 37.Cornell WD, Cieplak P, Bayly CI, Gould IR, Merz KM, Jr, Ferguson DM, Spellmeyer DC, Fox T, Caldwell JW, Kollman PA. A second generation force field for the simulation of proteins, nucleic acids. & organic molecules. J Am Chem Soc. 1995;117:5179–97. [Google Scholar]
- 38.Wendel JA, Goddard WA., III The hessian biased force-field for silicon nitride ceramics: Predictions of the thermodynamic and mechanical properties for α- and β-Si3N4. J Chem Phys. 1992;97:5048–62. [Google Scholar]
- 39.Crozier PS, Henderson D, Rowley RL, Busath DD. Model channel ion currents in NaCl-extended simple point charge water solution with applied-field molecular dynamics. Biophys J. 2001;81:3077–89. doi: 10.1016/S0006-3495(01)75946-2. [DOI] [PMC free article] [PubMed] [Google Scholar]
- 40.Kasianowicz JJ, Brandin E, Branton D, Deamer DW. Characterization of individual polynucleotide molecules using a membrane channel. Proc Natl Acad Sci USA. 1996;93:13770–3. doi: 10.1073/pnas.93.24.13770. [DOI] [PMC free article] [PubMed] [Google Scholar]
- 41.Song L, Hobaugh MR, Shustak C, Cheley S, Bayley H, Gouaux JE. Structure of staphylococcal α-hemolysin, a heptameric transmembrane pore. Science. 1996;274:1859–65. doi: 10.1126/science.274.5294.1859. [DOI] [PubMed] [Google Scholar]
- 42.Akenson M, Branton D, Kasianowicz JJ, Brandin E, Deamer DW. Microsecond time-scale discrimination among polycytidylic acid, polyadenylic acid. & polyuridylic acid as homopolymers or as segments within singe RNA molecules. Biophys J. 1999;77:3227–33. doi: 10.1016/S0006-3495(99)77153-5. [DOI] [PMC free article] [PubMed] [Google Scholar]
- 43.Meller A, Nivon L, Brandin E, Golovchenko J, Branton D. Rapid nanopore discrimination between single polynucleotide molecules. Proc Natl Acad Sci USA. 2000;97:1079–84. doi: 10.1073/pnas.97.3.1079. [DOI] [PMC free article] [PubMed] [Google Scholar]
- 44.Vercoutere W, Winters-Hilt S, Olsen H, Deamer D, Haussler D, Akeson M. Rapid discrimination among individual DNA hairpin molecules at single-nucleotide resolution using an ion channel. Nature Biotech. 2001;19:248–52. doi: 10.1038/85696. [DOI] [PubMed] [Google Scholar]
- 45.Vercoutere WA, Winters-Hilt S, DeGuzman VS, Deamer D, Ridino SE, Rodgers JT, Olsen HE, Marziali A, Akeson M. Discrimination among individual Watson-Crick base pairs at the termini of single DNA hairpin molecules. Nucl Acids Res. 2003;31:1311–8. doi: 10.1093/nar/gkg218. [DOI] [PMC free article] [PubMed] [Google Scholar]
- 46.Ashkenasy N, Sánchez-Quesada J, Bayley H, Ghadiri MR. Recognizing a single base in an individual DNA strand: A step toward DNA sequencing in nanopores. Angew Chem Int Ed Engl. 2005;44:1401–4. doi: 10.1002/anie.200462114. [DOI] [PMC free article] [PubMed] [Google Scholar]
- 47.Fologea D, Gershow M, Ledden B, McNabb DS, Golovchenko JA, Li J. Detecting single stranded dna with a solid state nanopore. Nano Lett. 2005;5:1905–9. doi: 10.1021/nl051199m. [DOI] [PMC free article] [PubMed] [Google Scholar]
- 48.Aksimentiev A, Schulten K. Imaging alpha-hemolysin with molecular dynamics: Ionic conductance, osmotic permeability and the electrostatic potential map. Biophys J. 2005;88:3745–61. doi: 10.1529/biophysj.104.058727. [DOI] [PMC free article] [PubMed] [Google Scholar]
- 49.Heng JB, Aksimentiev A, Ho C, Marks P, Grinkova YV, Sligar S, Schulten K, Timp G. Stretching DNA using an electric field in a synthetic nanopore. Nano Lett. 2005;5:1883–8. doi: 10.1021/nl0510816. [DOI] [PMC free article] [PubMed] [Google Scholar]
- 50.Heng JB, Aksimentiev A, Ho C, Marks P, Grinkova YV, Sligar S, Schulten K, Timp G. The electromechanics of DNA in a nanopore. Biophys J. 2005 doi: 10.1529/biophysj.105.070672. In press. [DOI] [PMC free article] [PubMed] [Google Scholar]
- 51.Storm AJ, Chen JH, Ling XS, Zandergen HW, Dekker C. Fabrication of solid-state nanopore with single-nanometre precision. Nature Mater. 2003;2:537–40. doi: 10.1038/nmat941. [DOI] [PubMed] [Google Scholar]
- 52.Ho C, Qiao R, Chatterjee A, Timp RJ, Aluru NR, Timp G. Electrolytic transport through a synthetic nanometer-diameter pore. Proc Natl Acad Sci USA. 2005;102:10445–50. doi: 10.1073/pnas.0500796102. [DOI] [PMC free article] [PubMed] [Google Scholar]
- 53.Lamb RN, Furlong DN. Controlled wettability of quartz surfaces. J Chem Soc – Faraday Trans 1. 1982;78:61–73. [Google Scholar]
- 54.Zhuralev LT. The surface chemistry of amorphous silica. Zhuralev model. Coll Surf. 2000;173:1–38. [Google Scholar]
- 55.Feuston BP, Garofalini SH. Topological and bonding defects in vitreous silica surfaces. J Chem Phys. 1989;91:564–70. [Google Scholar]
- 56.Bakaev VA, Steele WA. On the computer simulation of a hydrophobic vitreous silica surface. J Chem Phys. 1999;111:9803–12. [Google Scholar]
- 57.D’Souza AS, Pantano CG. Hydroxylation and dehydroxylation behavior of silica glass fracture surfaces. J Am Chem Soc. 2002;85:1499–504. [Google Scholar]
- 58.Cruz-Chu ER, Aksimentiev A, Schulten K. in preparation. [Google Scholar]
- 59.Roco MC. Nanotechnology: Convergence with modern biology and medicine. Curr Op Biotech. 2003;14:337–46. doi: 10.1016/s0958-1669(03)00068-5. [DOI] [PubMed] [Google Scholar]
- 60.Sligar SG. Finding a single-molecule solution for membrane proteins. Biochem Biophys Res Commun. 2003;312:115–9. doi: 10.1016/j.bbrc.2003.09.188. [DOI] [PubMed] [Google Scholar]
- 61.Bayburt TH, Grinkova YV, Sligar SG. Self-assembly of discoidal phospholipid bilayer nanoparticles with membrane scaffold proteins. Nano Letters. 2002;2:853–6. [Google Scholar]
- 62.Denisov IG, Grinkova YV, Lazarides AA, Sligar SG. Directed self-assembly of monodisperse phospholipid bilayer nanodiscs with controlled size. J Am Chem Soc. 2004;126:3477–87. doi: 10.1021/ja0393574. [DOI] [PubMed] [Google Scholar]
- 63.Boguski MS, Freeman M, Elshourbagy NA, Taylor JM, Gordon JI. On computer-assisted analysis of biological sequences: proline punctuation, consensus sequences. & apolipoprotein repeats. J Lipid Res. 1986;27:1011–34. [PubMed] [Google Scholar]
- 64.Nolte RT, Atkinson D. Conformational analysis of apolipoprotein A-1 and E-3 based on primary sequence and circular dichroism. Biophys J. 1992;63:1221–39. doi: 10.1016/S0006-3495(92)81698-3. [DOI] [PMC free article] [PubMed] [Google Scholar]
- 65.Baas BJ, Denisov IG, Sligar SG. Homotropic cooperativity of monomeric cytochrome P450 3A4 in a nanoscale native bilayer environment. Arch Biochem Biophys. 2004;430:218–28. doi: 10.1016/j.abb.2004.07.003. [DOI] [PubMed] [Google Scholar]
- 66.Bayburt TH, Sligar SG. Single-molecule height measurements on microsomal cytochrome P450 in nanometer-scale phospholipid bilayer disks. Proc Natl Acad Sci USA. 2002;99:6725–30. doi: 10.1073/pnas.062565599. [DOI] [PMC free article] [PubMed] [Google Scholar]
- 67.Civjan NR, Bayburt TH, Schuler MA, Sligar SG. Direct solubilization of heterologously expressed membrane proteins by incorporation into nanoscale lipid bilayers. Biotechniques. 2003;35:556–60. 562–3. doi: 10.2144/03353rr02. [DOI] [PubMed] [Google Scholar]
- 68.Duan H, Civjan NR, Sligar SG, Schuler MA. Co-incorporation of heterologously expressed arabidopsis cytochrome P450 and P450 reductase into soluble nanoscale lipid bilayers. Arch Biochem Biophys. 2004;424:141–53. doi: 10.1016/j.abb.2004.02.010. [DOI] [PubMed] [Google Scholar]
- 69.Bayburt TH, Sligar SG. Self-assembly of single intergral membrane proteins into soluble nanoscale phospholipid bilayers. Prot Sci. 2003;12:2476–81. doi: 10.1110/ps.03267503. [DOI] [PMC free article] [PubMed] [Google Scholar]
- 70.Shih AY, Denisov IG, Phillips JC, Sligar SG, Schulten K. Molecular dynamics simulations of discoidal bilayers assembled from truncated human lipoproteins. Biophys J. 2005;88:548–56. doi: 10.1529/biophysj.104.046896. [DOI] [PMC free article] [PubMed] [Google Scholar]
- 71.Service RF. Sushi-like discs give inside view of elusive membrane protein. Science. 2004;304:674. doi: 10.1126/science.304.5671.674a. [DOI] [PubMed] [Google Scholar]
- 72.Shaw AW, McLean MA, Sligar SG. Phospholipid phase transitions in homogeneous nanometer scale bilayer discs. FEBS Lett. 2004;556:260–4. doi: 10.1016/s0014-5793(03)01400-5. [DOI] [PubMed] [Google Scholar]
- 73.Denisov IG, McLean MA, Shaw AW, Grinkova YV, Sligar SG. Thermotropic phase transition in soluble nanoscale lipid bilayers. J Phys Chem B. 2005;109:15580–8. doi: 10.1021/jp051385g. [DOI] [PMC free article] [PubMed] [Google Scholar]
- 74.Segrest JP, Jones MK, Klon AE, Sheldahl CJ, Hellinger M, De Loof H, Harvey SC. A detailed molecular belt model for apolipoprotein A-I in discoidal high density lipoprotein. J Biol Chem. 1999;274:31755–8. doi: 10.1074/jbc.274.45.31755. [DOI] [PubMed] [Google Scholar]
- 75.Segrest JP. Amphipathic helixes and plasma lipoproteins: thermodynamic and geometric considerations. Chem Phys Lipids. 1977;18:7–22. doi: 10.1016/0009-3084(77)90023-8. [DOI] [PubMed] [Google Scholar]
- 76.Jonas A, Kezdy KE, Wald JH. Defined apolipoprotein A-I conformations in reconstituted high density lipoprotein discs. J Biol Chem. 1989;264:4818–24. [PubMed] [Google Scholar]
- 77.Phillips JC, Wriggers W, Li Z, Jonas A, Schulten K. Predicting the structure of apolipoprotein A-I in reconstituted high density lipoprotein disks. Biophys J. 1997;73:2337–46. doi: 10.1016/S0006-3495(97)78264-X. [DOI] [PMC free article] [PubMed] [Google Scholar]
- 78.Brouillette CG, Anantharamaiah GM. Structural models of human apolipoprotein A-I. Biochim Biophys Acta. 1995;1256:103–29. doi: 10.1016/0005-2760(95)00018-8. [DOI] [PubMed] [Google Scholar]
- 79.Rogers DP, Roberts LM, Lebowitz J, Engler JA, Brouillette CG. Structural analysis of apolipoprotein A-1: effects of amino- and carboxy-terminal deletions on the lipid-free structure. Biochemistry. 1998;37:945–55. doi: 10.1021/bi9713512. [DOI] [PubMed] [Google Scholar]
- 80.Davidson WS, Silva RAGD. Apolipoprotein structural organization in high density lipoproteins: belts, bundles, hinges and hairpins. Curr Opin Lipidol. 2005;16:295–300. doi: 10.1097/01.mol.0000169349.38321.ad. [DOI] [PubMed] [Google Scholar]
- 81.Shelley JC, Shelley MY, Reeder RC, Bandyopadhyay S, Moore PB, Klein ML. Simulations of phospholipids using a coarse grain model. J Phys Chem B. 2001;105:9785–92. [Google Scholar]
- 82.Marrink SJ, de Vries AH, Mark AE. Coarse grained model for semiquantitative lipid simulations. J Phys Chem B. 2004;108:750–60. [Google Scholar]
- 83.Phillips JC, Braun R, Wang W, Gumbart J, Tajkhorshid E, Villa E, Chipote C, Skeel RD, Kale L, Schulten K. Scalable molecular dynamics with NAMD. J Comp Chem. 2005;26:1781–802. doi: 10.1002/jcc.20289. [DOI] [PMC free article] [PubMed] [Google Scholar]
- 84.Shih AY, Arkhipov A, Freddolino PL, Schulten K. A coarse grained protein-lipid model with application to lipoprotein particles. J Phys Chem B. 2005 doi: 10.1021/jp0550816. Submitted. [DOI] [PMC free article] [PubMed] [Google Scholar]