

Abstract
Background and Purpose
Evidence supports a substantial genetic contribution to the risk of intracranial aneurysm (IA). The purpose of this study was to identify chromosomal regions likely to harbor genes that contribute to the risk of IA.
Methods
Multiplex families having at least 2 individuals with “definite” or “probable” IA were ascertained through an international consortium. First-degree relatives of individuals with IA who were at increased risk of an IA because of a history of hypertension or present smoking were offered cerebral magnetic resonance angiography. A genome screen was completed using the Illumina 6K SNP system, and the resulting data from 192 families, containing 1155 genotyped individuals, were analyzed. Narrow and broad disease definitions were used when testing for linkage using multipoint model-independent methods. Ordered subset analysis was performed to test for a gene×smoking (pack-years) interaction.
Results
The greatest evidence of linkage was found on chromosomes 4 (LOD=2.5; 156 cM), 7 (LOD=1.7; 183 cM), 8 (LOD=1.9; 70 cM), and 12 (LOD=1.6; 102 cM) using the broad disease definition. Using the average pack-years for the affected individuals in each family, the genes on chromosomes 4 (LOD=3.5; P=0.03), 7 (LOD=4.1; P=0.01) and 12 (LOD=3.6; P=0.02) all appear to be modulated by the degree of smoking in the affected members of the family. On chromosome 8, inclusion of smoking as a covariate did not significantly strengthen the linkage evidence, suggesting no interaction between the loci in this region and smoking.
Conclusions
We have detected possible evidence of linkage to 4 chromosomal regions. There is potential evidence for a gene×smoking interaction with 3 of the loci.
Keywords: intracranial aneurysm, linkage, single nucleotide polymorphism, gene × environment interaction, smoking
Studies have consistently demonstrated a genetic component to the risk for subarachnoid hemorrhage (SAH) and intracranial aneurysm (IA). For example, 9% to 14% of patients with SAH attributable to aneurysms have a family history of SAH in a first degree relative as compared to 3% to 6% of age matched controls (odds ratios ranging from 1.8 to 4.2).1–4 Bromberg et al reported the relative risk for SAH in first degree relatives of an SAH to be as high as 6.6 (95% CI 2.0 to 21).5
Studies have also shown that first degree relatives of an SAH or IA patient are at increased risk for an unruptured IA. It is estimated that 1% of the general population harbors an unruptured intracranial aneurysm.6 Ronkainen et al performed magnetic resonance angiography (MRA) in 438 apparently unaffected individuals from multiplex IA families and identified 38 (8.7%) subjects with an unsuspected IA, which was subsequently confirmed by digital subtraction intraarterial angiography.7 Brown and Soldevilla found 6 of 63 (9.5%) apparently unaffected individuals with a first degree relative with an IA had an IA documented by MRA and cerebral angiography.8 Nakagawa et al found 34 of 244 (13.9%) apparently unaffected first or second degree relatives of an SAH patient had an unruptured IA identified by MRA or CT angiography.9
Different approaches have been used to identify the genetic factors increasing the risk for IA. A number of candidate genes potentially contributing to the risk for IA have been examined. However, these studies have not yielded consistent replicated evidence of association to any particular gene. Family based linkage analysis has also been performed. Some studies have focused on a single large family with evidence of a Mendelian form of disease,10–13 whereas several others have ascertained large numbers of smaller families with typically only 2 affected genotyped persons per family.14–17 Whereas linkage to multiple regions of the genome has been reported, evidence to several chromosomes, 1p36, 5q31, 7q11, 14q22, 17cen, 19q13 and Xp22, has been found in more than one study.
Environmental factors are critical in the formation and rupture of IAs and must be considered in the search for relevant genes. The incidence of SAH increases moderately with advancing age, and women have a higher age-adjusted risk of SAH as compared to men.18 Cigarette smoking has consistently been identified as the most important modifiable risk factor for SAH1 with an odds ratio of 3.1.1,19 In population-based and cohort studies, 70% to 75% of persons with SAH have a prior history of smoking and 50% to 60% are present smokers.1 Hypertension is the next most important risk factor for SAH,1,19 with an odds ratio of 2.6. Hypertension accounts for an estimated 20% of all cases of SAH secondary to IA.1 African-Americans have twice the age- and gender-adjusted risk of SAH compared to whites.1 The known excess hypertension and higher smoking rates among young and middle-aged African-Americans as compared to whites is a possible explanation for this difference, but this hypothesis has yet to be proven.
In this study, we have ascertained and genotyped the largest sample of multiplex IA families identified through an international consortium. This is the first IA study to perform a whole genome SNP linkage study which allowed for a more complete assessment of the evidence for linkage throughout the genome. We also examined the evidence for gene×smoking interaction.
Materials and Methods
Subjects
Details of the Familial Intracranial Aneurysm (FIA) study have been outlined elsewhere.20 In brief, subjects were recruited through 26 clinical centers with extensive experience in the clinical management and imaging of IAs. These centers included 41 recruitment sites and were located throughout North America, New Zealand, and Australia. The FIA study was approved by the Institutional Review Boards/Ethics Committees at all clinical and analytic centers and recruitment sites.
Probands were identified by the recruitment sites and screened to determine whether they met study eligibility. Eligible families for this study included those with 1 of the following: (1) at least 2 living affected siblings; (2) at least 2 affected siblings, one of whom is living and the other whose genotype could be reconstructed through the collection of closely related, living family members (ie, spouse and children); (3) 3 or more affected family members (eg, cousin, uncle, aunt), 2 of whom are alive and have living connecting relatives; and (4) 3 or more affected family members, with 1 living affected and at least 1 other affected relative whose genotype could be reconstructed through the collection of closely related, living family members.
Exclusion criteria included: (1) a fusiform-shaped unruptured IA of a major intracranial trunk artery; (2) an IA which is part of an arteriovenous malformation; (3) a family history of polycystic kidney disease, Ehlers Danlos Syndrome, Marfan Syndrome, fibromuscular dysplasia, or Moya-moya disease; or (4) failure to obtain informed consent from the patient or family members.
Questionnaire data regarding demographics, environmental risk factors, and family history of IA were obtained from persons with an IA and their unaffected family members. Blood was obtained for the isolation of DNA as well as the establishment of an immortalized cell line. DNA and cryopreserved lymphocytes were stored at the NINDS Repository (http://ccr.coriell.org/ninds/). The first degree relatives of affected family members who met study criteria for a higher risk of IA were offered a free study MRA. Higher risk was defined as: (1) 30 years of age or older and (2) either had a 10 pack year history of present or former smoking; or had an average blood pressure reading of ≥140 mm Hg systolic or ≥90 mm Hg diastolic.
All medical records and the phone screen of the proband and family members with a reported history of IA, SAH, or intracerebral hemorrhage (ICH) were examined by a Verification Committee. Two neurologists on the Verification Committee independently reviewed the subject's records and decided whether the subject meets all the inclusion and exclusion criteria. In cases of disagreement, a third neurologist was used to resolve the case diagnosis. Each potential affected family member was ranked as definite, probable, possible, or not a case (Table 1).
Table 1. Disease Phenotypes.
| Classification | Definition |
|---|---|
| Definite | Medical records document intracerebral aneurysm (IA) on angiogram, operative report, autopsy, or a non-invasive imaging report (MRA, CTA) demonstrates an IA measuring 7 mm or greater. |
| Probable | Death certificate mentions probable intracranial aneurysm without supporting documentation or autopsy. Death certificate mentions subarachnoid hemorrhage (SAH) without mention of IA and a phone screen is consistent with ruptured IA (severe headache or altered level of consciousness) rapidly leading to death. An MRA documents an IA that is less than 7 mm but greater than 3 mm. |
| Possible | Non-invasive imaging report documents an aneurysm measuring between 2 and 3 mm. SAH was noted on death certificate, without any supporting documentation, autopsy or recording of headache or altered level of consciousness on phone screen. Death certificate lists aneurysm without specifying cerebral location or accompanying SAH. |
| Not a case | There is no supporting information for a possible IA. |
Genotyping
The FIA Study applied for and was granted access to the genotyping facility available at the Center for Inherited Disease Research (CIDR) operated by National Human Genome Research Institute (NHGRI) CIDR performed genotyping using the 6K Illumina array (http://www.illumina.com/pages.IM?ID=162), which includes 5953 markers. Genotyping was performed on 1404 individuals in 223 families. A total of 8 935 185 genotypes were generated. The error rate, based on paired genotypes from 63 duplicate samples, was 0.003%. The percentage genotypic data missing was 0.25%.
Before initiating any genetic analyses, extensive quality control assessment was performed. First, the family structure was verified with the genotypes returned from CIDR using the program RELPAIR.21 Pedigrees were altered as necessary. The most common pedigree structure alterations included removal of 1 member of a pair of monozygotic twins (n=8), altering full siblings to half siblings (n=29), removing individuals who were unrelated to the rest of the family (n=7), and removal of families who were no longer informative for linkage because of the loss of key individuals or change in disease status attributable to the final phenotypic verification (n=8 families). Once the family structures were appropriately altered, the remaining marker data were reviewed. All markers with fewer than 90% of the individuals genotyped were removed (n=28). All individuals with fewer than 90% of the markers genotyped were also removed from further analyses (n=1). Markers that violated Hardy Weinberg equilibrium at P<0.001 (n=4) or with very low informativeness (minor allele frequency <0.05; n=62) were removed from further analysis. Mendelian errors in each family were reviewed and genotypes were removed as needed to eliminate inconsistencies. Final genotypic quality control focused on removing any remaining genotypes that were likely to be erroneous as determined by evidence of recombination with adjacent markers.22 A total of 7488 genotypes were removed in this final step.
Statistical Analysis
It has been shown that including markers in high linkage disequilibrium (LD) can inflate the evidence of linkage.23 Several approaches were evaluated to reduce the influence of LD in the linkage analyses. Initially, we used the approach implemented in the program, Merlin,22 to designate clusters of markers and correct for LD in the linkage analysis.
Unfortunately, given the complexity of the pedigrees and the relatively large LD clusters that were present, many families exceeded computational limits and could not be included in the analysis. With the loss of many of the largest families in the study, the resulting power was unacceptable. Therefore, we instead computed pairwise LD (using both D' and r2 statistics) and in all cases where D' exceeded 0.70, we retained the SNP with the highest minor allele frequency (ie, the most informative marker). Analyses were also performed to assess the effect of employing r2 as the measure of LD. In this instance, a threshold of r2>0.40 was used to identify SNPs with high LD. Results were similar using both thresholds. Final SNP selection was based on results from the D' statistic.
The final sample available and informative for linkage analyses consisted of 192 families with 1155 genotyped individuals. A total of 5075 markers with 5 857 825 genotypes were included in the final genome screen. Two models of disease were used. The first and narrower disease definition classified as affected only those individuals who met the definite criteria (Table 1). The second and broader disease definition classified as affected those individuals who met criteria for either definite or probable IA (Table 1). The primary analytic approach used multipoint, model independent methods. The multipoint approach reduces the influence of single SNPs and instead focuses on the evidence of linkage obtained from multiple markers. This approach also maximizes the information content at any point across the genome, because each individual SNP has less power to detect linkage than a single microsatellite marker.
We subsequently performed analyses using only those families classified as Caucasian (n=153 of the 170 narrow disease definition families; n=172 of the 192 broad disease definition families). Allele frequency estimates are necessary for linkage analysis to estimate marker allele sharing identical by descent; however, if there are ethnic/racial differences in allele frequencies, this may result in spurious results or limited power to detect linkage in an ethnically or racially heterogeneous sample. Each chromosomal region was reviewed to determine whether the evidence of linkage was strengthened or weakened based on the inclusion of only Caucasian families. For each linkage region, the family-specific evidence for linkage was also computed.
The risk of IA is substantially modulated by several well known environmental risk factors. In this study, data were collected for 2 well known risk factors, smoking and hypertension. Smoking is a greater risk factor for IA and was also collected as a quantitative trait, making it a more informative phenotype than risk of hypertension, which was collected as a dichotomous trait. Therefore, to maximize the power to detect gene×environment effects and limit the extent of testing, only smoking was evaluated for its effect as an environmental covariate and testing was limited to those regions of the genome that had provided possible evidence of linkage.
Ordered subset analysis (OSA)24,25 was used to test for gene×environment interactions. A quantitative measure of cumulative smoking (pack-years) before the diagnosis of an aneurysm was computed for each affected individual in the genotyped families. Then, the average number of pack-years for each family was calculated using only the affected individuals. This calculation was performed separately for each of the 2 disease model definitions (narrow and broad). Then, families were ranked in ascending order based on the average pack-years for the family.
Multipoint model-independent linkage analysis was then performed for the subset of families in the first rank (ie, lowest average pack years) using the computer program Genehunter,25,26 and these linkage results were stored. The families in the next rank were then added to the first-rank families, and linkage analysis was performed again on this expanded set of families. This process was repeated until all families had been added to the analysis, at which point the “ordered subset” of families with the maximum LOD score (and the corresponding chromosomal position) were identified. The process was then repeated after ranking the families in the opposite (descending) order based on their average pack-years. Statistical significance of any observed increase in the maximum LOD score was determined using permutation methods by randomly ranking families. In the permutation procedure, the pack-years covariate values were randomly assigned to the families without replacement. The linkage analysis of ordered subsets was performed on this replicate as for the observed data, and the maximum LOD score on the chromosome was stored. 10 000 replicates were permuted in this fashion, and a probability value for significance of the OSA result (LOD score as a function of smoking) was calculated by determining the proportion of these replicates that met or exceeded the observed OSA LOD score.
Results
The total sample included 192 multiplex IA families (Table 2). In the narrower disease definition, which only included as affected those individuals meeting criteria for definite IA, the analytic sample included 170 families with 412 affected individuals. A total of 983 individuals were genotyped in these families. Under the broader disease definition, which included as affected those individuals meeting criteria for either definite or probable IA, the analytic sample included all 192 families with 482 affected individuals.
Table 2. Sample Demographics.
| Narrow Disease Model
(n=170 families) |
Broad Disease Model
(n=192 families) |
|
|---|---|---|
| No. of genotyped individuals | 983 | 1155 |
| No. of individuals meeting criteria for IA | 412 | 482 |
| % Female for those meeting criteria for IA | 72.1 | 72.3 |
| Average age at diagnosis (years) | 49.2 | 49.9 |
| Average pack years of smoking for individuals meeting criteria for IA | 23.14 | 23.80 |
| % reporting hypertension for individuals meeting criteria for IA | 43.7 | 44.9 |
| # of all FIA family members undergoing MRA | 292 | 340 |
| % positive MRA (definite or probable) | 6.16 | 6.18 |
Genome wide linkage results are shown in Figure. The evidence of linkage using the narrower disease model, which included fewer families and a smaller number of affected individuals, was modest. LOD scores above 1.5 were observed on chromosomes 7 and 8. Analyses using the broader disease model detected evidence of possible linkage with a LOD score of 1.5 or greater to chromosomes 4 (156 cM), 7 (183 cM), 8 (70 cM), and 12 (102 cM). In each region, the most strongly linked families were primarily Caucasian, and the evidence of linkage was provided by multiple families.
Figure.
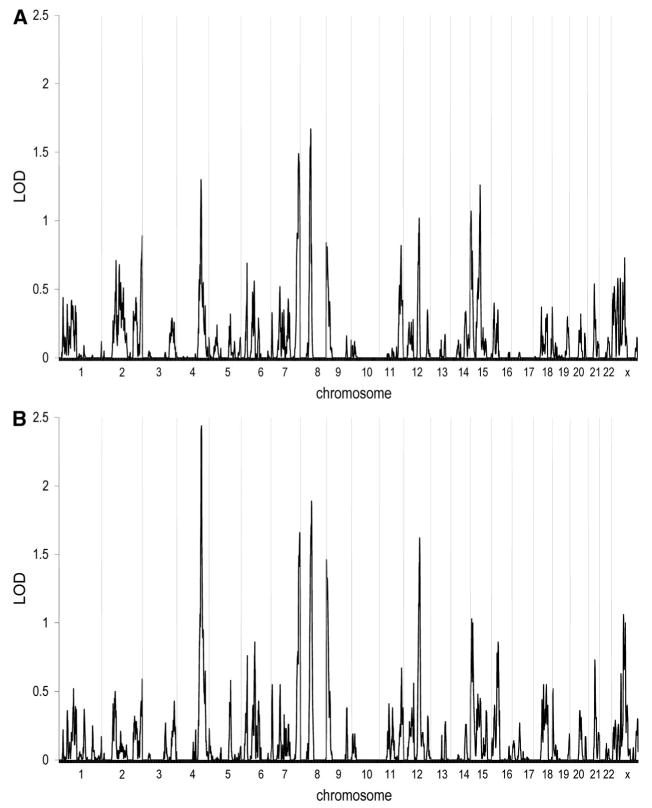
Results of multipoint model-independent linkage analysis. The x-axis depicts the various chromosomes across the genome with chromosome 1 at the far left and the X chromosome at the far right. The y-axis indicates the LOD score at the various chromosomal positions across the genome. A, Narrow disease definition (n=170 families); B, Broad disease definition (n=192 families).
Because unique loci may be segregating in families of differing racial origin, analyses were performed limiting the sample to only the Caucasian families. As would be expected when performing the analysis using 90% of the original sample, the linkage results were quite similar, but each of the regions identified in the initial screen had slightly lower maximal LOD scores. Considering the data across the entire genome for the narrower disease model, only a region on chromosome 8 (LOD=1.6 at 68 cM) and a region on the X chromosome (LOD=1.6 at 4 cM) produced maximal LOD scores above 1.5. For the broader disease model, LOD scores of 1.5 or greater were observed for chromosomes 4 (LOD=1.9 at 158 cM), 7 (LOD=1.5 at 182 cM), 8 (LOD=1.9 at 72 cM) and 9 (LOD=1.6 at 4 cM).
Additional analyses were then performed to determine whether any of the 4 chromosomal regions identified in the full sample (chromosomes 4, 7, 8, and 12) provide evidence for a gene × environment interaction. Analyses were performed using smoking as a covariate (Table 3). On chromosome 4, using the 67 families with the highest rate of smoking (mean=44.6 pack-years) yielded a LOD score of 3.5 (P=0.03). On chromosome 7, the 64 families with the highest smoking (mean=45.3 pack-years) produced a LOD score of 4.1 (P=0.01). On chromosome 12, the top 134 smoking families (mean=32.7 pack-years) resulted in a LOD score of 3.2 (P=0.02). On chromosome 8, inclusion of smoking as a covariate did not significantly strengthen the linkage evidence. These results would suggest that there is an interaction between the genetic locus at chromosomes 4, 7, and 12 and smoking, but no such evidence of interaction at chromosome 8.
Table 3. Results of Ordered Subset Analysis.
| Narrow Disease Model (n=170 families)
|
Broad Disease Model (n=192 families)
|
|||
|---|---|---|---|---|
| Chromosome*/Position†/Marker‡ | Gene Only LOD Score | Gene×Smoke LOD Score
(P Value)§ |
Gene Only LOD Score | Gene×Smoke LOD Score
(P Value)§ |
| 4q32.2/156 cM/rs1458149 | 1.3 | 2.4 (0.17) | 2.5 | 3.5 (0.03) |
| 7q36.3/183 cM/rs7795368 | 1.5 | 3.7 (0.02) | 1.7 | 4.1 (0.01) |
| 8q12.1/70 cM/rs1873104 | 1.7 | NS¶ | 1.9 | NS |
| 12q21.33/102 cM/rs337663 | 1.0 | 3.0 (0.05) | 1.6 | 3.6 (0.02) |
Cytogenetic position of the maximum LOD score.
Location of the maximum LOD score on the deCode map.
Genotyped marker closest to the maximum LOD score.
Permutation testing was performed to obtain P values associated with the increase in LOD score observed when modeling gene×smoking interaction when compared with modeling for genetic effects only.
NS indicates not significant.
Discussion
We have performed the largest linkage study completed to date in a sample of 192 multiplex families whose clinical data were reviewed and classified using strict diagnostic criteria for IA. There are several strengths of this study. First, we have used SNPs rather than microsatellite markers to improve our ability to detect linkage. Second, a unique approach of this study was the extensive use of reconstruction of the likely genotypes of deceased affected individuals. By collecting the offspring of deceased affected individuals, we increased the power of this study to detect linkage. Third, we have included an important environmental effect, cigarette smoking, in our linkage analysis, which allowed us to postulate that 3 of our linkages have identified susceptibility loci which are modulated by heavy smoking. This latter finding emphasizes the importance of smoking cessation among all family members of persons with a known IA, even though the specific genes related to IA have yet to be identified.
Similar to other studies of IA as well as studies of other stroke subtypes, we did not detect strong linkage to any particular chromosomal region. Given the size of our sample, this would suggest that there is not a single common gene of large effect that has a major influence on the risk of IA. Rather, similar to the results of other studies, we have detected linkage to several different chromosomal regions, each of which appears to exert a more modest effect. Interestingly, 3 of the 4 loci we detected all appear to have greater effect in that subset of multiplex IA families with the highest exposure to smoking, as calculated by pack-years. These data suggest that the risk of IA is mediated through the action of multiple loci of small to moderate effect and these loci likely exert their effect in concert with environmental factors such as smoking.
Unlike several other studies, MRA screening was only offered to a subset of the at-risk members of the multiplex IA families. Criteria for MRA were designed to maximize the likelihood that an IA would be identified by screening those individuals with relevant environmental risk factors (age, hypertension or smoking) which would make it more likely that an unruptured IA might be detected. As a result of this strategy, we may have augmented the likelihood that we would identify genetic loci that had an interaction with smoking.
Previous genome-wide studies using microsatellite markers in multiplex IA families have detected significant or suggestive evidence of linkage to many different chromosomal regions. A sample of 104 Japanese IA sibling pairs detected linkage to chromosomes 7q11 (LOD=3.2), near the elastin gene, 14q22 (LOD=2.3) and 5q22-31 (LOD=2.2).16 Another Japanese sample of 29 multiplex IA families detected linkage to chromosome 17cen (LOD=3.0), 19q13 (LOD=2.1), and Xp22 (LOD=2.2).17 Analyses in multiplex Finnish pedigrees detected linkage to chromosome 19q1315 with a sample of only 48 affected sibling pairs (LOD=2.6). Subsequent analyses in an expanded set of Finnish pedigrees narrowed the region on chromosome 19q13 to only 12 cM around the marker D19S246.27 Studies in a few large extended pedigrees have detected linkage to chromosomes 1p34.3 to 36.13 (LOD=4.2 under a dominant model10), 5p15.2 to 14.3 (LOD=3.6 under a dominant model12), 11q24-25 (LOD=4.3 under a dominant model13), and 14q23-31 (LOD=3.0 under a dominant model13). Recently, a subset of 9 of the 29 Japanese multiplex IA families who were consistent with autosomal dominant inheritance were reanalyzed using an autosomal dominant, affecteds only analysis.14 Evidence of linkage was found to chromosome 19q13 (LOD=4.1). A large consanguineous Dutch family was previously linked to chromosome 2p1311; however, 2 members of the family have now been found to have aneurysms. In addition, 1 member of the family previously designated as affected because of the presence of an unruptured IA identified on MRA has now been found at follow-up MRA not to have a visible unruptured IA and is now not classified as affected. As a result of the changes in phenotypic classification, the linkage to chromosome 2 is no longer significant. Rather, a new genome screen that includes these phenotypic changes has detected linkage to chromosomes 1p36.11-p36.13 with an NPL of 3.2 and the Xp22.2-p22.32 region with an NPL of 4.5.28 Interestingly, in reviewing these analyses, evidence to chromosomes 1p36, 5q31, 7q11, 14q22, 17cen, 19q13, and Xp22 has been found in more than 1 study.
Several studies have detected evidence of linkage to chromosome 7. Analyses in a sample of 13 extended Mormon pedigrees detected some evidence of linkage to chromosome 7q11 (LOD=2.3).29 The linkage in our sample was at 7q36.3. This is more than 100 cM from the region linked in the Mormon sample and the Japanese sample of Onda et al (7q11) and is also 100 cM from the elastin (ELN) gene. ELN has been examined by many studies for its potential linkage or association with IA. Despite the strong evidence of ELN as a positional candidate gene, most studies have not detected association or linkage to this gene30–34 although some positive associations have been reported.16,35,36 Interestingly, linkage to a broad region on chromosome 4q31 (peak at 140 cM) was reported in a sample of 119 families with at least 2 members with abdominal aortic aneurysm.37 The maximum LOD score reported in the FIA study sample reported here is at 156 cM with a 1-LOD support interval from 152 to 162 cM.
There are several potential explanations for the lack of replication across the linkage studies. First, the size of the samples used in the linkage analyses has varied widely. Some studies have used only a single large family whereas others have used a modest number of multiplex families consisting primarily of affected sibling pairs. In this study, we have analyzed the largest number of multiplex families, 192, which included a very large number of both genotyped and reconstructed affected individuals. Second, there has been variability in the phenotypic definitions across studies. We have used both a narrow and broad disease definition using a very well defined process for phenotyping by multiple vascular neurologists and neuroradiologists. Using this strategy, we found the greatest evidence of linkage using the broader disease model. These data are consistent with the observation that subjects classified as probable cases are highly likely to have an IA. In addition, the use of probable as well as definite phenotypes increased the power to detect loci through the use of larger, more informative families in the linkage analysis.
Similar to most linkage studies, we have identified linkage regions which include hundreds of potential candidate genes. We are currently collecting an independent sample of multiplex IA families in which we intend to replicate our present linkage findings. Based on the results in this replication sample, we will then proceed to prioritize the linkage regions and perform more detailed linkage and association analyses to narrow the critical interval in which an IA susceptibility locus is likely to lie.
Summary
We have performed a whole genome linkage study using more than 5000 SNPs in a sample of 192 informative multiplex IA pedigrees. We detected evidence of possible linkage to chromosomes 4, 7, 8, and 12. Potential evidence of a gene-smoking interaction was found for chromosomes 4, 7, and 12.
Acknowledgments
Sources of Funding: This study was funded by a grant from the National Institute of Neurological Diseases and Stroke (NINDS RO1 NS39512). Genotyping services were provided by the Center for Inherited Disease Research (CIDR). CIDR is fully funded through a federal contract from the National Institutes of Health to The Johns Hopkins University, Contract Number N01-HG-65403.
Appendix I
Clinical Centers – University of Alabama at Birmingham: W. Fisher, (PI), H. Forson, coordinator; Clinical Trials Research Unit, University of Auckland and Auckland City Hospital, New Zealand: C. Anderson, (PI), E. Mee, (PI), C. Howe, coordinator, S. Vos, coordinator; Royal Perth Hospital, Sir Charles Gairdner Hospital, Royal Adelaide Hospital, Royal Melbourne Hospital, Alfred Hospital, Westmead Hospital, Royal North Shore Hospital, Royal Prince Alfred Hospital, Australia: C. Anderson, (PI), G. Hankey, (PI), N. Knuckey, (PI), J. Laidlaw, (PI), P. Reilly, (PI), N. Dorsch, (PI), M. Morgan, (PI), M. Besser, (PI), J. Rosenfeld, (PI), K. Athanasiadis, coordinator, A Claxton, coordinator, V. Dunne, coordinator, J. Griffith, coordinator, J. Davidson, coordinator, S. Pope, coordinator, Amanda Froelich, coordinator; Brigham & Women's Hospital: A. Day, (PI), R. Brach, coordinator; University of Cincinnati: D. Woo, co-(PI), M. Zuccarello, co-(PI), A. Ringer, co-(PI), H. Yeh, co-(PI), K. Franklin, coordinator; Cleveland Clinic Foundation: P. Ramussen, (PI), D. Andrews-Hinders, coordinator, T. Wheeler, coordinator; Columbia University: E.S. Connolly, (PI), R. Sacco, co-(PI), D. LaMonica, coordinator; University of Florida: S.B. Lewis, (PI), A. Royster, coordinator; Indianapolis Neurosurgical Group: T. Payner, (PI), N. Miracle, coordinator; Johns Hopkins: K. Murphy (PI), B. Kohler, coordinator; Massachusettes General Hospital: C. Ogilvy, (PI), D. Buckley, coordinator, J. Manansala, coordinator; London Health Science Center Research Inc.: G. Ferguson, (PI), C. Mayer, coordinator, J. Peacock, coordinator; Notre Dame Hospital: G. Rouleau, (PI), A. Desjarlais, coordinator; University of Maryland: E.F. Aldrich, (PI), C. Aldrich, coordinator, C. Byard, coordinator; Mayo Clinic: R.D. Brown (PI), L. Jaeger, coordinator; University of Michigan: L. Morgenstern, (PI), M. Concannon, Coordinator; New Jersey Medical School: A.I. Qureshi, (PI), P. Harris-Ln, coordinator; Northwestern University: H. Batjer, (PI), G. Joven, S. Thompson, coordinator; University of Ottawa: M.T. Richard, (PI), A. Hopper, (PI); University of Pittsburgh: A.B, Kassam, (PI), K. Lee, coordinator; University of California, SF, C. Johnston, (PI), K. Katsura, coordinator; University of Southern California: S. Giannotta, (PI), D. Fishback, coordinator; Stanford University Medical Center: G. Steinberg, (PI), D. Luu, coordinator, M. Coburn, coordinator; University of Texas at Houston: M. Malkoff, (PI), A. Wojner, coordinator; University of Virginia: N. Kassel, (PI), B. Worrall, co-(PI), G. Radakovic, coordinator; University of Washington: D. Tirschwell, (PI), P. Tanzi, coordinator; Washington University: C. Derdeyn, (PI), M. Catanzaro, coordinator; University of Manitoba (Winnipeg), A. Kaufmann, (PI), D. Gladish, coordinator.
Footnotes
Disclosures: None.
References
- 1.Kissela BM, Sauerbeck L, Woo D, Khoury J, Carrozzella J, Pancioli A, Jauch E, Moomaw CJ, Shukla R, Gebel J, Fontaine R, Broderick J. Subarachnoid hemorrhage: a preventable disease with a heritable component. Stroke. 2002;33:1321–1326. doi: 10.1161/01.str.0000014773.57733.3e. [DOI] [PubMed] [Google Scholar]
- 2.Schievink WI, Schaid DJ, Michels VV, Piepgras DG. Familial aneurysmal subarachnoid hemorrhage: a community-based study. J Neurosurg. 1995;83:426–429. doi: 10.3171/jns.1995.83.3.0426. [DOI] [PubMed] [Google Scholar]
- 3.De BM, Perusse L, Cantin L, Bouchard JM, Mathieu J. A study of inbreeding and kinship in intracranial aneurysms in the Saguenay Lac-Saint-Jean region (Quebec, Canada) Ann Hum Genet. 1996;60(Pt 2):99–104. doi: 10.1111/j.1469-1809.1996.tb01181.x. [DOI] [PubMed] [Google Scholar]
- 4.Wang PS, Longstreth WT, Jr, Koepsell TD. Subarachnoid hemorrhage and family history. A population-based case-control study. Arch Neurol. 1995;52:202–204. doi: 10.1001/archneur.1995.00540260108026. [DOI] [PubMed] [Google Scholar]
- 5.Bromberg JE, Rinkel GJ, Algra A, van Duyn CM, Greebe P, Ramos LM, van GJ. Familial subarachnoid hemorrhage: distinctive features and patterns of inheritance. Ann Neurol. 1995;38:929–934. doi: 10.1002/ana.410380614. [DOI] [PubMed] [Google Scholar]
- 6.Atkinson JL, Sundt TM, Jr, Houser OW, Whisnant JP. Angiographic frequency of anterior circulation intracranial aneurysms. J Neurosurg. 1989;70:551–555. doi: 10.3171/jns.1989.70.4.0551. [DOI] [PubMed] [Google Scholar]
- 7.Ronkainen A, Hernesniemi J, Puranen M, Niemitukia L, Vanninen R, Ryynanen M, Kuivaniemi H, Tromp G. Familial intracranial aneurysms. Lancet. 1997;349:380–384. doi: 10.1016/S0140-6736(97)80009-8. [DOI] [PubMed] [Google Scholar]
- 8.Brown BM, Soldevilla F. MR angiography and surgery for unruptured familial intracranial aneurysms in persons with a family history of cerebral aneurysms. AJR Am J Roentgenol. 1999;173:133–138. doi: 10.2214/ajr.173.1.10397113. [DOI] [PubMed] [Google Scholar]
- 9.Nakagawa T, Hashi K, Kurokawa Y, Yamamura A. Family history of subarachnoid hemorrhage and the incidence of asymptomatic, unruptured cerebral aneurysms. J Neurosurg. 1999;91:391–395. doi: 10.3171/jns.1999.91.3.0391. [DOI] [PubMed] [Google Scholar]
- 10.Nahed BV, Seker A, Guclu B, Ozturk AK, Finberg K, Hawkins AA, DiLuna ML, State M, Lifton RP, Gunel M. Mapping a Mendelian form of intracranial aneurysm to 1p34.3-p36.13. Am J Hum Genet. 2005;76:172–179. doi: 10.1086/426953. [DOI] [PMC free article] [PubMed] [Google Scholar]
- 11.Roos YB, Pals G, Struycken PM, Rinkel GJ, Limburg M, Pronk JC, van den Berg JS, Luijten JA, Pearson PL, Vermeulen M, Westerveld A. Genome-wide linkage in a large Dutch consanguineous family maps a locus for intracranial aneurysms to chromosome 2p13. Stroke. 2004;35:2276–2281. doi: 10.1161/01.STR.0000141415.28155.46. [DOI] [PubMed] [Google Scholar]
- 12.Verlaan DJ, Dube MP, St-Onge J, Noreau A, Roussel J, Satge N, Wallace MC, Rouleau GA. A new locus for autosomal dominant intracranial aneurysm, ANIB4, maps to chromosome 5p15.2-14.3. J Med Genet. 2006;43:e31. doi: 10.1136/jmg.2005.033209. [DOI] [PMC free article] [PubMed] [Google Scholar]
- 13.Ozturk AK, Nahed BV, Bydon M, Bilguvar K, Goksu E, Bademci G, Guclu B, Johnson MH, Amar A, Lifton RP, Gunel M. Molecular genetic analysis of two large kindreds with intracranial aneurysms demonstrates linkage to 11q24-25 and 14q23-31. Stroke. 2006;37:1021–1027. doi: 10.1161/01.STR.0000206153.92675.b9. [DOI] [PubMed] [Google Scholar]
- 14.Mineharu Y, Inoue K, Inoue S, Yamada S, Nozaki K, Hashimoto N, Koizumi A. Model-based linkage analyses confirm chromosome 19q13.3 as a susceptibility locus for intracranial aneurysm. Stroke. 2007;38:1174–1178. doi: 10.1161/01.STR.0000259657.73682.03. [DOI] [PubMed] [Google Scholar]
- 15.Olson JM, Vongpunsawad S, Kuivaniemi H, Ronkainen A, Hernesniemi J, Ryynanen M, Kim LL, Tromp G. Search for intracranial aneurysm susceptibility gene (s) using Finnish families. BMC Med Genet. 2002;3:7. doi: 10.1186/1471-2350-3-7. [DOI] [PMC free article] [PubMed] [Google Scholar]
- 16.Onda H, Kasuya H, Yoneyama T, Takakura K, Hori T, Takeda J, Nakajima T, Inoue I. Genomewide-linkage and haplotype-association studies map intracranial aneurysm to chromosome 7q11. Am J Hum Genet. 2001;69:804–819. doi: 10.1086/323614. [DOI] [PMC free article] [PubMed] [Google Scholar]
- 17.Yamada S, Utsunomiya M, Inoue K, Nozaki K, Inoue S, Takenaka K, Hashimoto N, Koizumi A. Genome-wide scan for Japanese familial intracranial aneurysms: linkage to several chromosomal regions. Circulation. 2004;110:3727–3733. doi: 10.1161/01.CIR.0000143077.23367.18. [DOI] [PubMed] [Google Scholar]
- 18.Broderick JP, Brott T, Tomsick T, Huster G, Miller R. The risk of subarachnoid and intracerebral hemorrhages in blacks as compared with whites. N Engl J Med. 1992;326:733–736. doi: 10.1056/NEJM199203123261103. [DOI] [PubMed] [Google Scholar]
- 19.Feigin VL, Rinkel GJ, Lawes CM, Algra A, Bennett DA, van GJ, Anderson CS. Risk factors for subarachnoid hemorrhage: an updated systematic review of epidemiological studies. Stroke. 2005;36:2773–2780. doi: 10.1161/01.STR.0000190838.02954.e8. [DOI] [PubMed] [Google Scholar]
- 20.Broderick JP, Sauerbeck LR, Foroud T, Huston J, III, Pankratz N, Meissner I, Brown RD., Jr The Familial Intracranial Aneurysm (FIA) study protocol. BMC Med Genet. 2005;6:17. doi: 10.1186/1471-2350-6-17. [DOI] [PMC free article] [PubMed] [Google Scholar]
- 21.Boehnke M, Cox NJ. Accurate inference of relationships in sib-pair linkage studies. Am J Hum Genet. 1997;61:423–429. doi: 10.1086/514862. [DOI] [PMC free article] [PubMed] [Google Scholar]
- 22.Abecasis GR, Cherny SS, Cookson WO, Cardon LR. Merlin–rapid analysis of dense genetic maps using sparse gene flow trees. Nat Genet. 2002;30:97–101. doi: 10.1038/ng786. [DOI] [PubMed] [Google Scholar]
- 23.Huang Q, Shete S, Amos CI. Ignoring linkage disequilibrium among tightly linked markers induces false-positive evidence of linkage for affected sib pair analysis. Am J Hum Genet. 2004;75:1106–1112. doi: 10.1086/426000. [DOI] [PMC free article] [PubMed] [Google Scholar]
- 24.Hauser ER, Watanabe RM, Duren WL, Bass MP, Langefeld CD, Boehnke M. Ordered subset analysis in genetic linkage mapping of complex traits. Genet Epidemiol. 2004;27:53–63. doi: 10.1002/gepi.20000. [DOI] [PubMed] [Google Scholar]
- 25.Kong A, Cox NJ. Allele-sharing models: LOD scores and accurate linkage tests. Am J Hum Genet. 1997;61:1179–1188. doi: 10.1086/301592. [DOI] [PMC free article] [PubMed] [Google Scholar]
- 26.Kruglyak L, Daly MJ, Reeve-Daly MP, Lander ES. Parametric and nonparametric linkage analysis: a unified multipoint approach. Am J Hum Genet. 1996;58:1347–1363. [PMC free article] [PubMed] [Google Scholar]
- 27.van der Voet M, Olson JM, Kuivaniemi H, Dudek DM, Skunca M, Ronkainen A, Niemela M, Jaaskelainen J, Hernesniemi J, Helin K, Leinonen E, Biswas M, Tromp G. Intracranial aneurysms in Finnish families: confirmation of linkage and refinement of the interval to chromosome 19q13.3. Am J Hum Genet. 2004;74:564–571. doi: 10.1086/382285. [DOI] [PMC free article] [PubMed] [Google Scholar]
- 28.Ruigrok YM. From intracranial aneurysm to subarachnoid hemorrhage: unraveling the genetics. Utrecht, The Netherlands: Utrecht University; 2006. [Google Scholar]
- 29.Farnham JM, Camp NJ, Neuhausen SL, Tsuruda J, Parker D, Macdonald J, Cannon-Albright LA. Confirmation of chromosome 7q11 locus for predisposition to intracranial aneurysm. Hum Genet. 2004;114:250–255. doi: 10.1007/s00439-003-1044-z. [DOI] [PubMed] [Google Scholar]
- 30.Berthelemy-Okazaki N, Zhao Y, Yang Z, Camp NJ, Farnham J, Parker D, Tsuruda J, Macdonald J, Zhang K, Cannon-Albright LA. Examination of ELN as a candidate gene in the Utah intracranial aneurysm pedigrees. Stroke. 2005;36:1283–1284. doi: 10.1161/01.STR.0000166198.05439.f8. [DOI] [PubMed] [Google Scholar]
- 31.Mineharu Y, Inoue K, Inoue S, Yamada S, Nozaki K, Takenaka K, Hashimoto N, Koizumi A. Association analysis of common variants of ELN, NOS2A, APOE and ACE2 to intracranial aneurysm. Stroke. 2006;37:1189–1194. doi: 10.1161/01.STR.0000217408.91389.4d. [DOI] [PubMed] [Google Scholar]
- 32.Yamada S, Utsunomiya M, Inoue K, Nozaki K, Miyamoto S, Hashimoto N, Takenaka K, Yoshinaga T, Koizumi A. Absence of linkage of familial intracranial aneurysms to 7q11 in highly aggregated Japanese families. Stroke. 2003;34:892–900. doi: 10.1161/01.STR.0000062887.71400.B4. [DOI] [PubMed] [Google Scholar]
- 33.Hofer A, Hermans M, Kubassek N, Sitzer M, Funke H, Stogbauer F, Ivaskevicius V, Oldenburg J, Burtscher J, Knopp U, Schoch B, Wanke I, Hubner F, Deinsberger W, Meyer B, Boecher-Schwarz H, Poewe W, Raabe A, Steinmetz H, Auburger G. Elastin polymorphism haplotype and intracranial aneurysms are not associated in Central Europe. Stroke. 2003;34:1207–1211. doi: 10.1161/01.STR.0000069013.83336.1C. [DOI] [PubMed] [Google Scholar]
- 34.Krex D, Konig IR, Ziegler A, Schackert HK, Schackert G. Extended single nucleotide polymorphism and haplotype analysis of the elastin gene in Caucasians with intracranial aneurysms provides evidence for racially/ethnically based differences. Cerebrovasc Dis. 2004;18:104–110. doi: 10.1159/000079257. [DOI] [PubMed] [Google Scholar]
- 35.Ruigrok YM, Seitz U, Wolterink S, Rinkel GJ, Wijmenga C, Urban Z. Association of polymorphisms and haplotypes in the elastin gene in Dutch patients with sporadic aneurysmal subarachnoid hemorrhage. Stroke. 2004;35:2064–2068. doi: 10.1161/01.STR.0000139380.50649.5c. [DOI] [PubMed] [Google Scholar]
- 36.Akagawa H, Tajima A, Sakamoto Y, Krischek B, Yoneyama T, Kasuya H, Onda H, Hori T, Kubota M, Machida T, Saeki N, Hata A, Hashiguchi K, Kimura E, Kim CJ, Yang TK, Lee JY, Kimm K, Inoue I. A haplotype spanning two genes, ELN and LIMK1, decreases their transcripts and confers susceptibility to intracranial aneurysms. Hum Mol Genet. 2006;15:1722–1734. doi: 10.1093/hmg/ddl096. [DOI] [PubMed] [Google Scholar]
- 37.Shibamura H, Olson JM, van Vlijmen-Van KC, Buxbaum SG, Dudek DM, Tromp G, Ogata T, Skunca M, Sakalihasan N, Pals G, Limet R, MacKean GL, Defawe O, Verloes A, Arthur C, Lossing AG, Burnett M, Sueda T, Kuivaniemi H. Genome scan for familial abdominal aortic aneurysm using sex and family history as covariates suggests genetic heterogeneity and identifies linkage to chromosome 19q13. Circulation. 2004;109:2103–2108. doi: 10.1161/01.CIR.0000127857.77161.A1. [DOI] [PubMed] [Google Scholar]