

Abstract
The kinetics of Ras activation by Son of Sevenless (SOS) changes profoundly when Ras is tethered to membranes, instead of being in solution. SOS has two binding sites for Ras, one of which is an allosteric site that is distal to the active site. The activity of the SOS catalytic unit (SOScat) is up to 500-fold higher when Ras is on membranes, compared to rates in solution, because the allosteric Ras site anchors SOScat to the membrane. This effect is blocked by the N-terminal segment of SOS, which occludes the allosteric site. We show that SOS responds to the membrane density of Ras molecules, to their state of GTP loading and to the membrane concentration of phosphatidylinositol-4,5-bisphosphate (PIP2), and that the integration of these signals potentiates the release of auto-inhibition.
Signal transduction by growth factor receptors proceeds through the recruitment to the plasma membrane of signaling proteins that are normally in the cytoplasm1. This membrane localization can, by itself, bring about profound changes in signaling activity because co-localization at the membrane increases the effective concentrations of proteins by as much as 1,000-fold, thereby driving protein-protein interactions that would otherwise not occur2,3. A now classic example of such a signaling switch is the activation of Ras by growth factor receptors, which relies on the phosphotyrosine-dependent recruitment of adaptor proteins, such as Grb2, that bring the nucleotide exchange factor SOS to the membrane4,5. Membrane localization of SOS results in interaction with Ras and its consequent conversion to the active GTP-bound state6. Artificial targeting of SOS to the plasma membrane, by fusing it to myristoylation or farnesylation sequences, results in sustained receptor-independent Ras activity in cells7.
SOS has two binding sites for Ras, that can both, in principle, be occupied simultaneously by membrane-bound Ras8. One of these is the active site, at which empty Ras is bound transiently, leading to nucleotide exchange6. The other site binds to nucleotide-loaded Ras. Occupation of the second site by Ras stimulates the nucleotide exchange activity of SOS allosterically, by causing conformational changes at the active site that allow substrate Ras to bind8-10.
By carrying out studies of human Ras and SOS proteins in solution, we have shown previously that access to the allosteric site is controlled by regulatory domains that are present in SOS, and that Ras-GTP binding to the allosteric site sets up a positive feedback loop for Ras activation in cells10,11. The importance of the allosteric site was also demonstrated by studies on the activation of Ras by SOS in T-cells, which depends on the priming of Ras-GTP by another Ras-specific nucleotide exchange factor, Ras-GRP112.
SOS has three main functional segments (Fig. 1). The catalytic segment, which we refer to as SOScat, contains the Cdc25 domain (named for the Ras activator protein in yeast) and the REM (Ras Exchanger Motif) domain. An N-terminal regulatory segment contains a domain with two histone folds (the histone domain), followed by Dbl-homology (DH) and pleckstrin-homology (PH) domains. The DH domain of SOS physically occludes the allosteric Ras binding site in crystal structures of SOS10. The PH domain is closely associated with the DH domain13 and interacts with PIP214-17 and phosphatidic acid18. It has recently been shown that the PH domain couples SOS activation to the mitogen-dependent generation of phosphatidic acid18. We do not, in this paper, consider the C-terminal segment, which contains binding sites for adapter proteins such as Grb219-22.
Figure 1.
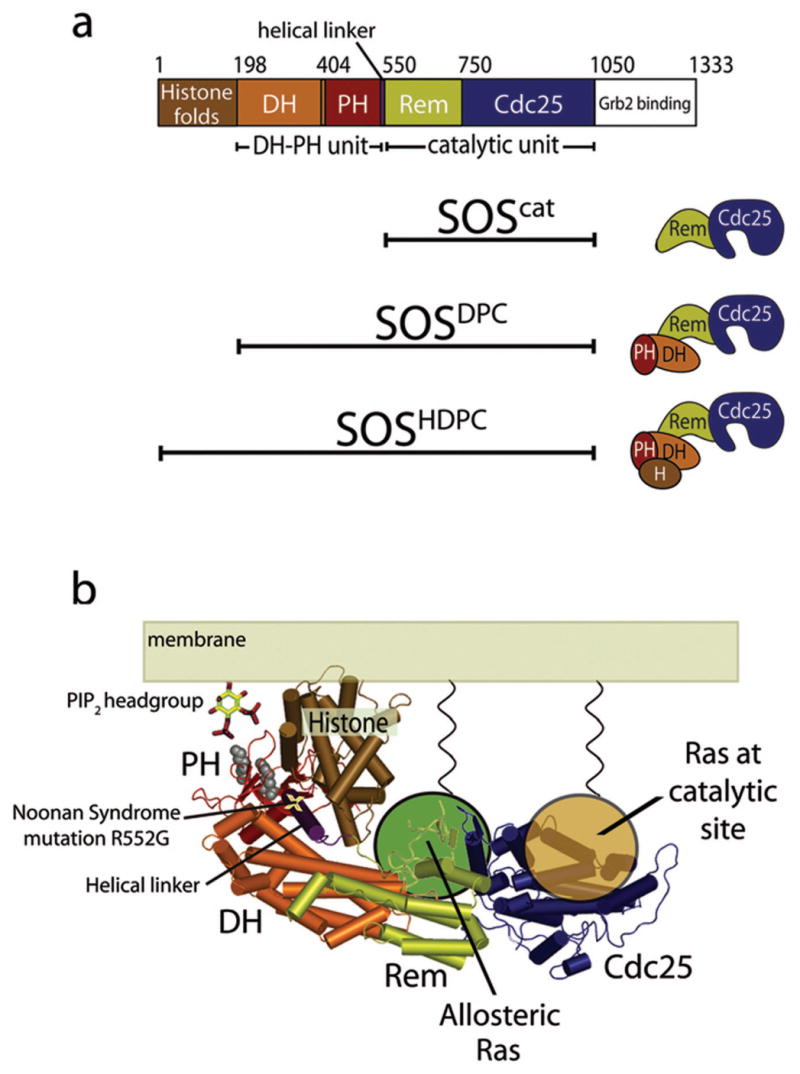
SOS structure. (a) Domain organization of SOS. (b) Model for SOS localization at the membrane24. The two basic residues in the PH domain that are critical for PIP2 binding17 and mutated in this work (K456 and R459) are indicated by gray spheres.
The histone domain, located upstream of the DH-PH unit, binds tightly to the rest of SOS by docking onto a helical linker that connects the PH domain to the REM domain23,24. Mutation of an arginine residue (Arg552) in this helical linker disrupts the internal docking of the histone domain24. The importance of this interaction in suppressing SOS activity has been highlighted by a genetic study of Noonan syndrome, a developmental disorder characterized by learning problems, skeletal anomalies and congenital heart defects25. One of the Noonan syndrome-associated mutations that map to human SOS1 involves a replacement of Arg552 by glycine, and results in enhanced activation of Ras and ERK after EGF stimulation26,27. Other mutations associated with Noonan syndrome map to the regions of SOS that interact with the allosteric Ras molecule or are predicted to help destabilize the auto-inhibited conformation.
Membrane-bound Ras could, in principle, maintain SOS at the membrane by engaging the allosteric site. Such co-localization could increase the ability of SOS to catalyze nucleotide exchange on Ras dramatically, by increasing the probability of encounters between SOS and Ras, and potentially short-circuit the controls that make SOS sensitive to input signals. To address this issue we studied the kinetics of Ras activation by SOS when Ras is tethered to membranes. Simply constraining the physical dimensionality of the reaction to a surface by coupling Ras (but not SOS) to phospholipid membranes leads to a dramatic increase (up to ∼500-fold) in the activity of SOScat. This effect requires Ras binding to the allosteric site of SOS, and is further enhanced by the conversion of Ras-GDP to Ras-GTP. The unchecked activation of Ras is prevented by the N-terminal domains of SOS, which block the localization of SOS to the membrane by allosteric Ras. A key insight is provided by investigation of the Noonan syndrome-associated mutation R552G, which is found to activate SOS only in a membrane context, and only in the presence of PIP2. The activity of auto-inhibited SOS is stimulated by increasing Ras density at the membrane, by the replacement of Ras-bound GDP by GTP and by increasing PIP2 concentrations in the membrane. Our results suggest that full activation of SOS requires the integration of multiple membrane-dependent signals, as well as further anchorage of SOS to the membrane, such as by the coupling to activated receptors.
Results
Covalent attachment of Ras to membrane surfaces
We attach the conserved core of Ras to lipid membranes covalently, using thiol-maleimide crosslinking28. This strategy avoids difficulties inherent in purifying lipid-modified Ras. A previous report has suggested that the lipid modification of Ras can alter its behavior as a substrate for SOS29, but these studies were done with both Ras and SOS in solution and its relevance to the interaction of SOS with membrane-bound Ras is unclear.
We quantify SOS activity by monitoring the displacement of fluorescently labeled GDP analogs bound to Ras by excess unlabeled GDP or GTP8,30-32. To ensure that our results are robust we tether Ras to both small unilamellar lipid vesicles (average diameter ∼100 nm) and planar supported lipid bilayers33. Direct observation of fluorescently labeled nucleotides bound to Ras molecules coupled to the surface of supported lipid bilayers verifies that the membrane components are fluid, homogenously mixed and that aggregation is not a factor. The vesicle system, on the other hand, allows a more rapid bulk experimental readout. By using both methods, we explore a greater range of Ras-SOS concentrations than would be possible with either one alone, and we unify our results with a single quantitative kinetic model. Different fluorescent nucleotides are used in the two experimental configurations (see Methods). Ras surface densities for lipid vesicles are in the range of ∼800 to ∼17,000 molecules μm−2 (see Supplementary Table 1 online and Methods). For the supported bilayers, the Ras surface densities range from ∼500 to ∼4,500 Ras molecules μm−2 (see Methods).
The number of Ras molecules on the surface of an NIH3T3 cell is estimated to be in the range of 10,000–50,00034. Assuming a diameter of 10 μm and a spherical shape, this corresponds to a surface density of uniformly distributed Ras in the range of 30–150 Ras molecules per μm2. H-Ras and K-Ras are not uniformly distributed, but instead form dynamically exchanging nanoclusters, with about 30% of the Ras molecules in these nanoclusters35,36. The radius of a nanocluster is estimated to be 6–12 nm, with a surface density of about ∼4,000 to ∼16,000 Ras μm−2. Thus, our experimental Ras surface densities are in the range of densities within these nanoclusters, the formation of which is essential for Ras activation35,36. For comparison, the maximal close packed density of Ras molecules on a surface is estimated to be ∼100,000 molecules μm−2.
Enhanced activity of SOScat when Ras is on membranes
We compared the SOScat-catalyzed nucleotide exchange rate in solution to the rate obtained for a reaction at the same overall Ras and SOS concentrations by volume, except that all the Ras molecules are tethered to lipid vesicles. For consistency with previous solution studies10,37, the bulk concentration of both Ras and SOS is 1 μM and mant-dGDP31 is exchanged for unlabeled GDP. In both cases, overall nucleotide exchange rates exhibit pseudo first-order kinetics, because the fluorescently labeled nucleotide that is detected is replaced by unlabeled nucleotide. The exchange rate is 0.0019 ± 0.0001 s−1 with both SOScat and Ras in solution, while a nearly 500-fold increase to 0.84 ± 0.06 s−1 is measured for membrane-tethered Ras (surface density ∼5,300 molecules μm−2) (Fig. 2).
Figure 2.
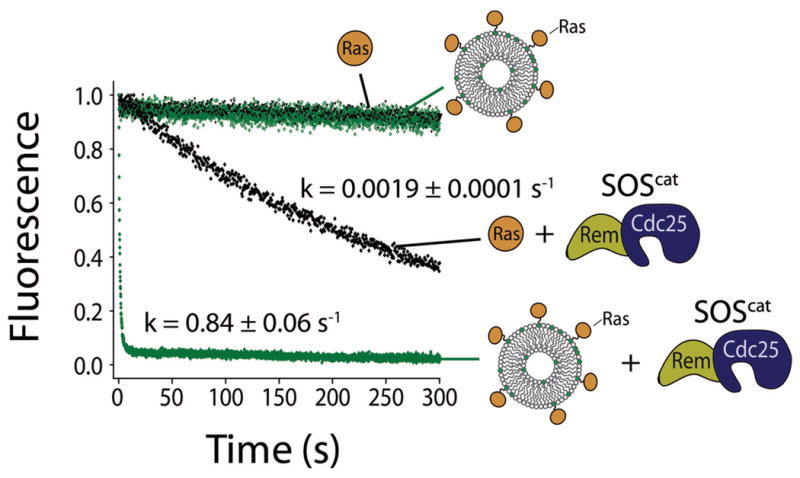
The rate of SOScat-catalyzed nucleotide exchange is increased dramatically when Ras is tethered to membranes. The rate of fluorescently labeled mant-dGDP release from Ras in solution (black) and Ras tethered to lipid vesicles (green) in the absence and presence of SOScat is compared (mant-dGDP exchanged for GDP). The bulk volume concentration of Ras and SOS (when present) is 1 μM in all reactions. The Ras surface density is ∼5,300 molecules μm−2.
To ensure that membrane anchorage of Ras does not alter the intrinsic rate of nucleotide release, we took advantage of an isolated Cdc25 domain construct of the SOS homolog Ras Guanine Nucleotide Releasing Factor 1 (RasGRF1). In contrast to SOS, which is active only when Ras binds to the allosteric site that bridges the REM and Cdc25 domains, the isolated Cdc25 domain of RasGRF1 is active on its own9,37. The rate of RasGRF1-catalyzed nucleotide release is 0.0071 ± 0.0001 s−1 with both RasGRF1 and Ras in solution, and no considerable difference is observed when Ras is membrane-bound (the release rate is 0.0086 ± 0.0002 s−1 for a Ras surface density of ∼2,600 molecules μm− 2 on vesicles) (Supplementary Fig. 1 online).
Dependence of Ras activation on membrane surface density
The pronounced acceleration in the rate of SOScat-catalyzed nucleotide exchange upon restricting Ras to membranes suggests that the allosteric Ras binding site might be localizing SOS to the membrane, where the probability of encounters with substrate Ras molecules is increased greatly. In support of this hypothesis, the observed SOScat-catalyzed nucleotide release rate increases as a function of Ras surface density on the membrane for both lipid vesicles and planar lipid bilayers (Fig. 3 shows data for GDP replacing Ras-bound nucleotide). This dependency on Ras surface density is robust, and is quantitatively predicted by the following reaction model over a wide range of experimental parameters:
Figure 3.
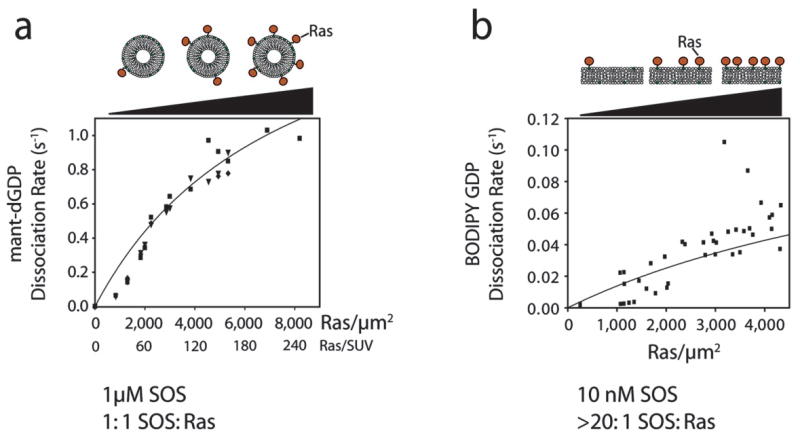
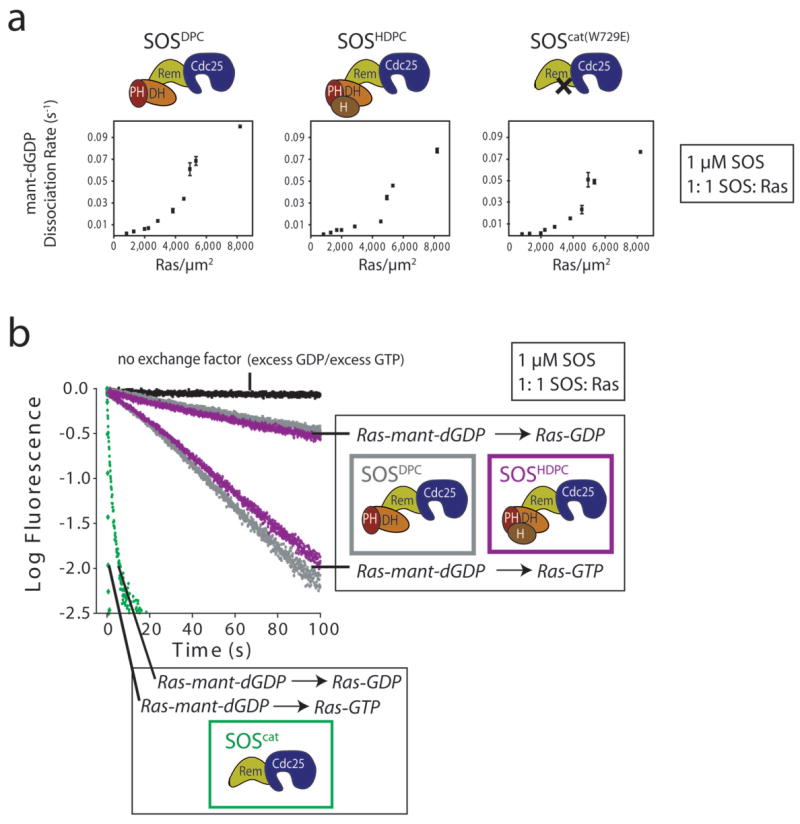
The membrane-dependent increase in the rate of SOScat-catalyzed Ras exchange is a function of the surface density of Ras. (a) The rate for SOScat-catalyzed nucleotide exchange for Ras coupled to lipid vesicles is shown as a function of Ras surface density (molecules μm−2). Although the surface density of Ras is varied, the bulk volume concentrations of SOS and Ras are the same for each measurement (1 μM). Mant-dGDP is displaced by unlabeled GDP. Experimental rates are shown as points. The solid line represents the rates predicted from the kinetic scheme (see Supplementary Discussion online). (b) The rate for SOScat-catalyzed nucleotide exchange for Ras coupled to supported lipid bilayers is shown as a function of Ras surface density (molecules μm−2). In these experiments there is a large excess of SOS molecules versus membrane-bound Ras ([SOS] = 10 nM). BODIPY-GDP is used as the fluorescent nucleotide. Experimental data are indicated by points, and the solid line represents the rates predicted by the kinetic model, using the same set of parameters as in (a). Two data points, between densities of 3,000–4,000 Ras μm−2, have apparently aberrant values, but are included for completeness.
Ras* + SOS ⇄ Ras* · SOS + Ras* ⇄ Ras* · SOS · Ras* → Ras* · SOS · Ras0 (preferred pathway)
Ras* + SOS ⇄ SOS · Ras* + Ras* ⇄ Ras* · SOS · Ras* → Ras* · SOS · Ras0
Here, Ras* and Ras0 refer to Ras bound to labeled and unlabeled nucleotide, respectively (see Supplementary Discussion online for a complete description of the reaction scheme). Ras·SOS, SOS·Ras and Ras·SOS·Ras represent Ras bound at the allosteric site, the catalytic site and at both sites, respectively. All Ras molecules are on the membrane, and all SOS molecules are either in solution or bound to one or two Ras molecules. The model does not include any direct interaction between SOS and the membrane, and considers only GDP replacing Ras-bound nucleotide.
The predicted values of the overall exchange rates for this simplified reaction scheme are superimposed onto the experimental data presented in Figure 3. As expected, much of the rate acceleration is predicted to arise from the ability of the allosteric Ras binding site to recruit and localize SOScat to the membrane. Binding of Ras at the allosteric site converts SOScat from an inactive conformation to an active one, but these observations of kinetic rate enhancements as a function of Ras surface density indicate that membrane recruitment plays a major role in addition to any such direct allostery.
For the supported bilayers, only a small amount of Ras is present because the membrane is restricted to a single surface of the reaction chamber. A low concentration of SOS (10 nM) is therefore used in these experiments. Even so, SOS in the reaction chamber is in excess and its concentration in solution remains essentially constant throughout the reaction. The vesicle experiments are done with both high (1 μM) and low (10 nM) SOS concentrations, but in both cases SOS is limiting and the concentration of free SOS in solution decreases as the reaction proceeds. Nonetheless, the reaction scheme depicted above accurately predicts all of the data from both systems based on a single set of kinetic parameters.
Localization of SOScat to the plasma membrane in cells
Next, we investigated the ability of Ras to localize SOScat to the membrane in a cellular context by transfecting cells with SOScat and observing the effects of mutations in the allosteric Ras binding site. COS1 cells were transfected with SOScat constructs and a Ras variant (Ras(A59G D38E)) that binds to the allosteric site of SOS but does not stimulate downstream signaling because it has reduced affinity for effector proteins, such as Raf11. In the presence of Ras(A59G D38E), wild-type SOScat displays pronounced membrane localization (Fig. 4a). In contrast, a SOScat variant containing two mutations that weaken the binding of Ras to the allosteric site (SOScat(L687E R688A))10,11 fails to localize to the membrane (Fig. 4a). These results demonstrate that the interaction of Ras with the allosteric site is necessary to promote the stable interaction of SOScat with the plasma membrane.
Figure 4.
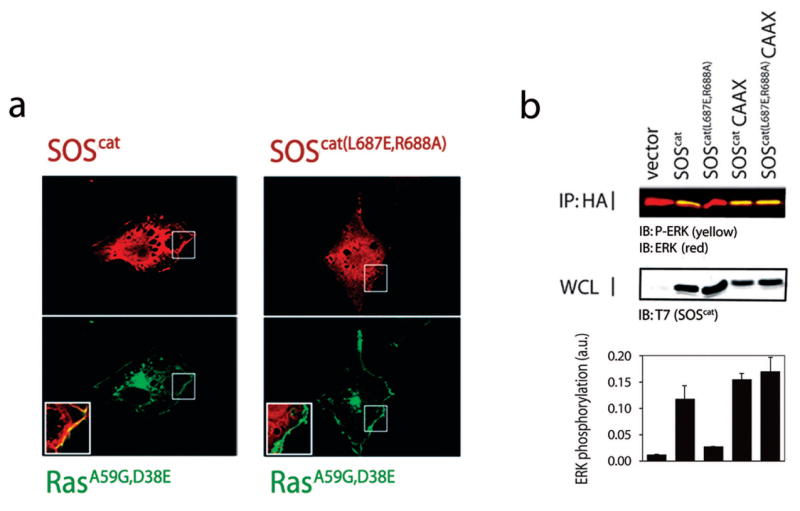
Membrane localization of SOScat by allosteric Ras binding in cells. (a) Left, co-localization of SOScat and Ras(A59G D38E), a Ras variant that binds only to the allosteric site of SOS, at the plasma membrane. Immunofluorescence studies reveal that when SOScat (red, above left) and Ras(A59G D38E) (green, below left) are co-transfected into COS1 cells both proteins co-localize at the plasma membrane (yellow, inset). Right, the redistribution of SOS to the membrane is not seen when a mutant form of SOScat, SOScat(L687E R688A), is co-expressed with Ras(A59G D38E) (green, below right). SOScat(L687E R688A) is impaired in binding to Ras at the allosteric site. (b) SOScat(L687E R688A) is defective in ERK-MAP kinase activation, but targeting SOScat(L687E R688A) to the membrane using the Ras-derived membrane anchoring sequence, CAAX, fully restores SOS signaling activity. Error bars in the bar graph represent the standard deviation from three independent experiments. The levels of ERK activation, as represented by ERK phosphorylation (P-ERK; green (appears yellow due to overlap)), were quantified by densitometry and normalized to levels of total ERK (ERK; red). p-ERK and ERK co-migrate, so the appearance of p-ERK gives an apparent yellow color. [WCL: whole cell lysate]
To assess the functional significance of this recruitment mechanism we measured the signaling output of SOScat using ERK-MAP kinase activation as a readout. As seen previously, expression of SOScat in cells leads to robust activation of ERK2 (ref. 10). A mutant of SOScat in which interaction with Ras at the allosteric site is weakened, SOScat(L687E R688A), is defective in ERK2 kinase activation10 (Fig. 4b). This defect is fully rescued by constitutive membrane targeting of SOScat(L687E R688A) using a Ras-derived membrane anchoring sequence (Fig. 4b). Since Ras binding at the allosteric site is required for SOS activity9, we infer that the strong interaction between the membrane and lipid-modified SOS, which increases the local concentration of SOS at the membrane, drives the binding of Ras to the allosteric site despite the impedance arising from mutations at the allosteric site.
Role of the allosteric site in SOS activation at the membrane
The cell-based studies described above show that mutations at the allosteric site prevent the membrane localization of SOScat. Such mutations should also prevent the membrane-dependent enhancement of SOScat activity in vitro. Indeed, membrane-dependent stimulation of the nucleotide exchange rate is substantially reduced in a SOScat variant that has reduced affinity for allosteric Ras (SOScat(W729E)). This mutant form of SOS has essentially the same properties as SOScat(L687E R688A), used in the cell-based experiments10, and the in vitro data for SOScat(W729E) are discussed later. Interpretation of the reduced activity of SOScat(W729E) in terms of membrane localization is, however, complicated by the fact that Ras binding to the allosteric site is required for SOS activation even when Ras is in solution10. We therefore carried out additional experiments which test the importance of the allosteric site in membrane anchorage, but which use SOScat with an intact allosteric site. These experiments rely on a Ras mutant (RasY64A) that binds only to the allosteric site8,10.
Ras-GTP binds about 10-fold more tightly to the allosteric site than does Ras-GDP10. When all reaction components are in solution, the addition of RasY64A bound to the non-hydrolysable GTP analog GppNp (RasY64A-GppNp) stimulates the activity of SOScat8,10. The nucleotide exchange rate increases from 0.0019 ± 0.0001 s−1 (without RasY64A-GppNp) to 0.085 ± 0.002 s−1 (10-fold excess of RasY64A-GppNp; 1 μM Ras-GDP and SOScat, GDP exchanged for GDP) (Fig. 5a). The results are quite different when the substrate Ras-GDP molecules are tethered to lipid vesicles and the allosteric activator RasY64A-GppNp is added in solution. Instead of increasing, the exchange rate decreases slightly, from 0.15 ± 0.01 s−1 (for a moderate Ras surface density of 1,300 Ras μm−2 and a bulk concentration of Ras and SOScat of 1 μM) to 0.062 ± 0.007 s−1 for the same reaction carried out in the presence of a 10-fold excess of RasY64A-GppNp in solution (Fig. 5b). We interpret this to mean that addition of RasY64A-GppNp in solution competes with membrane-bound Ras for the allosteric site of SOScat, thereby trapping some of the SOScat in solution. These exchange reactions are carried out with excess unlabeled GDP. When excess unlabeled GTP is used instead, the Ras-GTP produced by the exchange reaction is attached to the membrane, and this results in an ∼10-fold increase in the rate of SOScat-catalyzed nucleotide release for an equal surface density of membrane-bound Ras (Supplementary Fig. 2 online).
Figure 5.
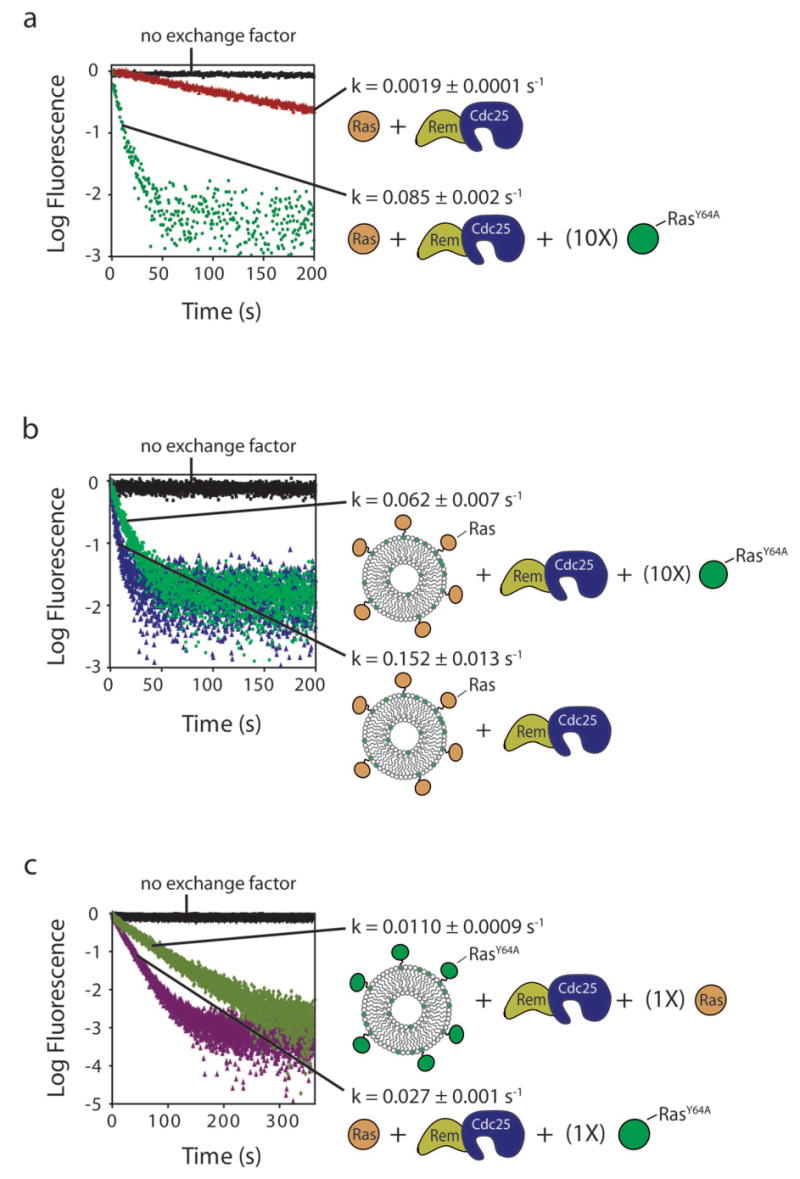
The substrate Ras molecule and the activating Ras molecule both need to be tethered to the membrane for maximal SOS activity. A mutant form of Ras, RasY64A, which binds to the allosteric site of SOS, but not to the catalytic site8, is used in these experiments. (a) All components are in solution. (b) Ras-mant-dGDP molecules are tethered to lipid membranes, and RasY64A-GppNp (allosteric activator) and SOScat are both in solution. (c) RasY64A-GppNp is tethered to lipid membranes, and Ras-mant-dGDP (substrate Ras) and SOScat are both in solution.
In another experiment we coupled the allosteric activator RasY64A-GppNp to lipid vesicles, but kept substrate Ras-GDP in solution. For comparison, when RasY64A-GppNp, Ras-GDP (substrate Ras) and SOScat are all in solution, the rate of SOScat-catalyzed nucleotide release from Ras is 0.027 ± 0.001 s−1 (1:1:1 stoichiometric ratio of Ras-GDP: SOScat: RasY64A-GppNp, all at 1 μM concentration). In contrast, when RasY64A-GppNp is membrane-tethered, and Ras-GDP and SOScat are both in solution, the rate decreases to 0.0110 ± 0.0009 s−1 (all components at 1 μM bulk concentration) (Fig. 5c). We interpret this result to mean that SOScat is trapped by membrane-bound RasY64A, and is less accessible to Ras-GDP in solution.
The N-terminal regulatory segment inhibits SOS
The ability of membrane-tethered Ras to stimulate the activity of SOScat raises the question of how the activity of SOS is suppressed until an activating signal is received. Insight is provided by analysis of SOS constructs that contain the N-terminal domains in addition to SOScat (SOSDPC and SOSHDPC; Fig. 1a). The allosteric Ras binding site is inaccessible in crystal structures of SOSDPC and SOSHDPC (ref. 10 and Olga Kuchment & J.K., unpublished data).
For an equal surface density of membrane-bound Ras, the rate of nucleotide release for SOSDPC and SOSHDPC is between 10 to 60 times slower than for SOScat (reactions carried out with a 1:1 stoichiometric ratio of SOS and membrane-coupled Ras-GDP, at a bulk concentration of 1 μM) (Figs. 3a and 6a). We conclude that an important role of the histone domain and the DH-PH unit of SOS is to inhibit the localization of SOS to the membrane by allosteric Ras.
Figure 6.
Activity of SOS constructs containing N-terminal regulatory domains. (a) The rates for SOScat(W729E)-, SOSDPC- and SOSHDPC-catalyzed nucleotide release from Ras-coupled vesicles are shown as a function of Ras surface density. Although the Ras density is varied, the bulk volume concentrations of Ras and SOS are the same for each measurement (1 μM). Error bars indicate the means with standard error from at least two independent experiments. (b) The activities of SOSDPC (gray), SOSHDPC (purple) and SOScat (green) towards Ras coupled to vesicles when mant-dGDP is exchanged for either unlabeled GDP or unlabeled GTP are compared for an equal surface density of Ras (∼1,300 Ras μm−2; bulk concentration of Ras and SOS is 1 μM). Note that the replacement of GDP for GTP on membrane-bound Ras results in a strong enhancement in the activity of all SOS constructs.
The inhibitory effect of the DH-PH unit is also manifested when fluorescently labeled GDP bound to Ras is replaced with GTP, despite the enhanced affinity of Ras-GTP for the allosteric site8,10 (Supplementary Fig. 2 online). For example, Figure 6b compares the activities of SOSDPC, SOSHDPC and SOScat towards membrane-bound Ras when labeled GDP is exchanged for either unlabeled GDP or unlabeled GTP (bulk concentration of Ras and SOS is 1 μM). The reactions are compared for the same levels of Ras surface density (∼1,300 Ras μm−2), and the replacement of GDP by GTP results in a marked increase in the reaction rate of all SOS constructs (Fig. 6b). Nevertheless, in comparison to SOScat, the presence of the DH-PH unit in SOSDPC and SOSHDPC suppresses the exchange activity substantially (Fig. 6b).
PIP2-dependent activation of SOS
The crystal structure of a construct of SOS containing intact regulatory and catalytic segments (SOSHDPC) has been determined recently, and indicates that the histone domain interacts with the DH domain, the PH domain and the helical PH-Rem linker (Olga Kuchment & J.K., unpublished data). A modeled location of the histone domain, which is based on small angle X-ray scattering data and is correct in general terms although not in detail, is shown in Figure 1b24. Mutation of Arg552 in the helical linker connecting the PH domain of SOS to the REM domain (R552G) releases the histone domain from the rest of SOS24 and leads to increased Ras activation26,27, suggesting that the docking of the histone domain is critical for inhibition. We therefore wondered whether the ability of the R552G mutation to activate SOS is due to release of the blockage of the allosteric site by the N-terminal segment.
We first compared the properties of three SOS constructs, two with the histone domain (SOSHDPC and SOSHDPC(R552G)) and one without (SOSDPC), in experiments where both Ras and SOS are in solution, at 1 μM concentration. All three SOS constructs show low levels of activity compared to SOScat, even when the reaction is carried out in an excess of unlabeled GTP (Fig. 7a). These results demonstrate that the Noonan syndrome-associated mutation has no noticeable effect on SOS activity when Ras and SOS are both off the membrane.
Figure 7.
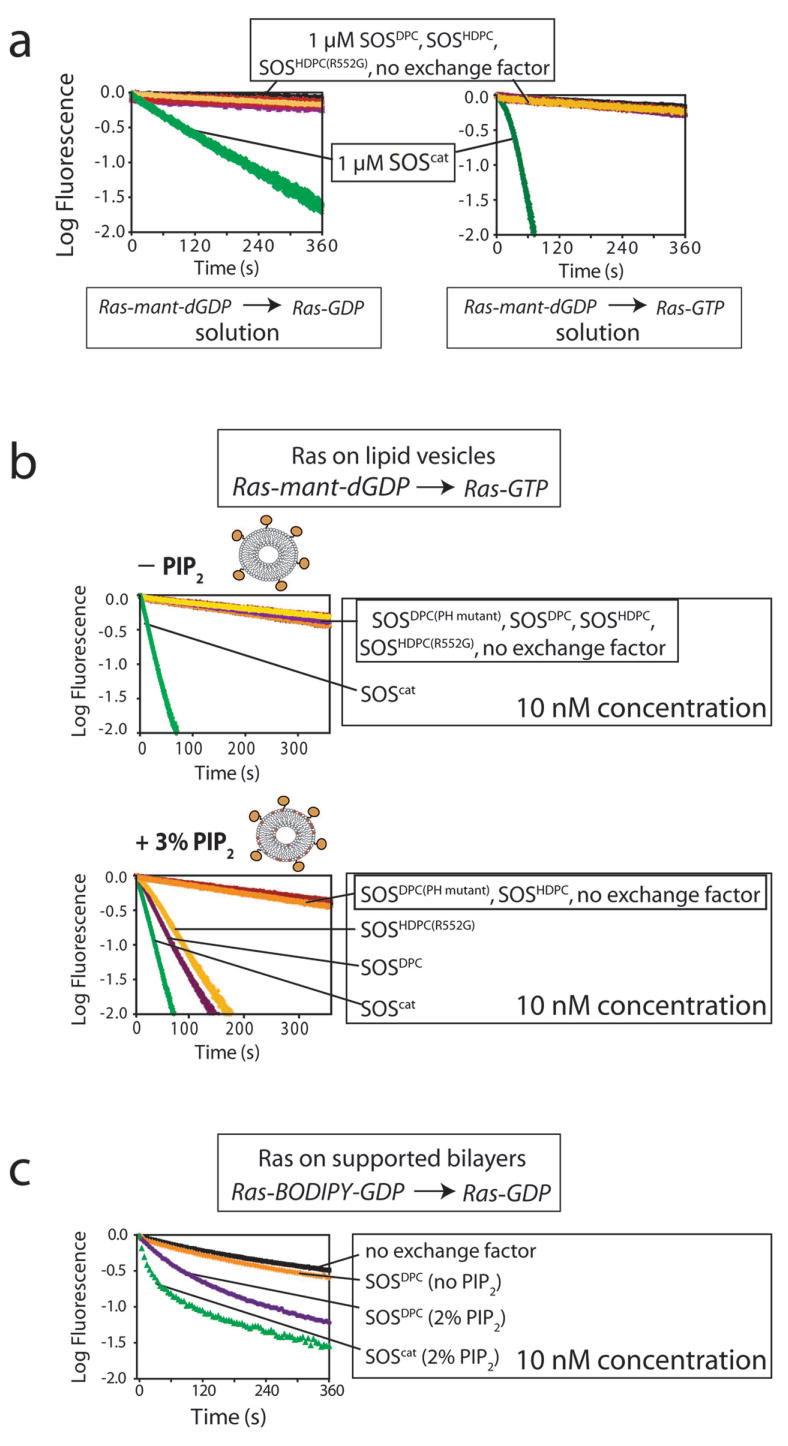
PIP2-dependent activation of SOS. (a) The activities of SOSDPC, SOSDPC(PH mutant), SOSHDPC, SOSHDPC(R552G) and SOScat towards Ras in solution when mant-dGDP is exchanged for unlabeled GDP and GTP are compared (bulk concentration of Ras and SOS is 1 μM). SOSDPC(PH mutant) is a mutant form of SOSDPC that contains mutations (K456E and R459E) that abolish binding to PIP2. SOSHDPC(R552G) contains the mutation associated with Noonan Syndrome26,27. (b) Nucleotide exchange by the indicated SOS constructs is shown in the absence and presence of PIP2 in Ras-coupled lipid vesicles. (Ras surface densities of ∼4,550 molecules μm−2 and ∼5,000 molecules μm−2, respectively) ([SOS] = 10 nM, i.e., 100-fold lower than in (a); [Ras] (by volume) = 1 μM). In these reactions, mant-dGDP is displaced by unlabeled GTP in solution. Note that inclusion of 3% PIP2 into Ras-coupled vesicles results in a substantial increase in the activity of the Noonan syndrome mutant (SOSHDPC(R552G)) and SOSDPC towards membrane-bound Ras. (c) Inclusion of 2% PIP2 into Ras-coupled supported bilayers results in a marked increase in the activity of SOSDPC ([SOS] = 10 nM; Ras-BODIPY-GDP exchanged for GDP). Data for SOScat in the presence of 2% PIP2 is shown for comparison.
Next, we compared the same three SOS constructs, but now with Ras localized to lipid vesicles. We use a bulk SOS concentration of 10 nM, which is 100-fold lower than in the first set of experiments, and results in SOScat activity that is roughly the same as the solution rate (compare Fig. 7a,b). Again, SOSHDPC, SOSHDPC(R552G) and SOSDPC show very low levels of activity, essentially indistinguishable from background (Fig. 7b). Thus, the Noonan syndrome-associated mutation in SOS does not allow Ras to access the allosteric site on these membranes, which contain phosphatidylcholine (PC) and phosphatidylserine (PS) (PC:PS; see Methods for a detailed description of the membrane composition).
The PH domain of SOS binds to PIP2 in vesicles with relatively high affinity (KD ≈ 1 μM)14-17 (also see Supplementary Fig. 3 online). In addition, a role for phosphatidic acid (PA) in activating SOS has been reported recently18,38. We therefore wondered if lipid binding to the PH domain of SOS could potentiate the effect of the R552G mutation. Figure 7b shows the results of experiments where Ras is coupled to lipid vesicles and mant-dGDP is displaced by unlabeled GTP in the presence of 10 nM SOSDPC, SOSHDPC and SOSHDPC(R552G). Inclusion of PIP2 in membranes results in a marked increase in the activity of SOS constructs containing the Noonan syndrome-associated mutation (SOSHDPC(R552G)) or in which the histone domain is entirely deleted (SOSDPC) (Fig. 7b). For example, the rate of nucleotide release by SOSHDPC(R552G) is 0.0126 ± 0.0007 s−1, compared to 0.019 ± 0.003 s−1 for SOSDPC, both in the presence of 3% PIP2. The rate for SOSHDPC is 0.0010 ± 0.0001 s−1, i.e., the same as that for the unstimulated reaction (Fig. 7b). Similar results are obtained using supported bilayers instead of vesicles, as shown in Figure 7c for the effect of PIP2 on SOSDPC.
The PIP2-dependent activity of SOSDPC is abolished if the PH domain of SOS is mutated so that it cannot bind to PIP2 (SOSDPC(K456E R459E)) (Fig. 7b and Supplementary Fig. 3 online). Thus, the effect of PIP2 is mediated through the PH domain. The simplest explanation for the ability of PIP2 to stimulate SOS activity is that it engages the PH domain and thereby provides an additional tether for SOS at the membrane. The resulting enhancement in the local concentration of SOS would facilitate entry of Ras to the allosteric site, overcoming the resistance afforded by the N-terminal segment. Interestingly, the inclusion of phosphatidic acid in membranes, either alone or with PIP2, has no effect on the rates of nucleotide exchange in our assays for the constructs tested (data not shown). Another interesting point is the mechanism by which the histone domain impedes the activity of SOSHDPC. SOSHDPC binds to PIP2-containing vesicles (Supplementary Fig. 3 online), suggesting that the histone domain does not directly occlude the PH domain, but instead might block the simultaneous engagement of the membrane by the PH domain and the two Ras binding sites of SOS.
Integration of membrane-dependent signals by SOS
In the preceding sections the activities of different SOS constructs are compared under similar conditions, which emphasizes the inhibitory action of the N-terminal segment. A different perspective emerges, however, when the activity of any one particular construct of SOS is monitored as the reaction conditions are changed.
Our results show that increasing the surface density of Ras on membranes results in very substantial increases in SOS activity. Although the highest levels of activity are seen with SOScat, all the constructs of SOS that we have studied respond in a similar way to Ras surface density (Figs. 3a and 6a). Even for SOSHDPC, which has the lowest activity in our assays, the rate of nucleotide release increases by about 65-fold as the Ras surface density increases from 830 Ras μm−2 to 8200 Ras μm−2 for reactions in which labeled GDP is replaced by unlabeled GDP (bulk concentration of Ras and SOS is 1 μM) (Fig. 6a). Superimposed on this Ras density dependence is the effect of Ras-GTP production, which increases the activity of SOScat, SOSDPC and SOSHDPC by roughly another factor of ten, for the same surface density of Ras (Fig. 6b and Supplementary Fig. 2 online). It has been shown recently that the activation of Ras is coupled to the formation of nanoclusters that are critical for a switch-like response to the input signal35. The local concentration of Ras within these nanoclusters is likely to be about two orders of magnitude greater than if Ras were distributed uniformly throughout the plasma membrane, as noted earlier. Thus, the dependence of SOS activity on both Ras surface density and the state of GTP loading on Ras could provide one mechanism for making Ras activation contingent on the formation of Ras nanoclusters.
PIP2 is present in biological membranes at levels of 1%–5% total lipid39. The level of PIP2 is elevated in HeLa cells following EGF stimulation, and is responsive to the activation of phospholipase D and the production of phosphatidic acid40. SOS is responsive to the membrane density of PIP2. For example, Figure 8 compares the activity of the Noonan syndrome mutant (SOSHDPC(R552G), 10 nM bulk concentration) when Ras is tethered to membranes containing 1% and 3% PIP2. Reactions using vesicles with a higher PIP2 density display higher levels of SOS activity (0.0117 s−1 versus 0.0028 s−1), even though the Ras surface density is lower for the vesicles with higher PIP2 (∼4,800 Ras μm−2 versus 6,000 Ras μm−2). Our procedure for crosslinking Ras to vesicles does not allow us to precisely control the Ras surface densities, which are determined only after the vesicles are prepared. A more thorough mapping of the responsiveness of SOS to the surface densities of Ras and PIP2 awaits further study.
Figure 8.
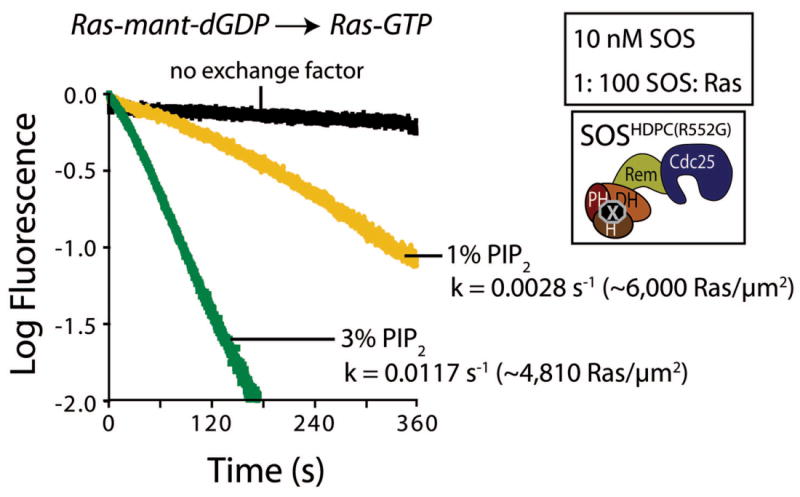
The Noonan Syndrome mutant, SOSHDPC(R552G), is responsive to the membrane density of PIP2. The nucleotide exchange rates of 10 nM SOSHDPC(R552G) towards Ras tethered to lipid vesicles containing 1% and 3% PIP2 are compared when mant-dGDP is displaced by unlabeled GTP (∼6,000 Ras μm−2 and ∼4,810 Ras μm−2, respectively; [Ras] (by volume) = 1 μM).
Discussion
The classical model for the activation of Ras by SOS involves the partitioning of SOS from the cytoplasm to the plasma membrane in response to growth factor-induced receptor activation. Such a mechanism leaves open the possibility that chance encounters between SOS and Ras would lead to the erroneous activation of Ras, with disastrous consequences for the cell. We had shown previously that SOS is inactive unless Ras is bound to the allosteric site, and that the enhanced affinity of Ras-GTP for this site makes SOS sensitive to the activation state of Ras. We now demonstrate that Ras is able to localize the SOS catalytic unit to the membrane and strongly potentiate its activity. The N-terminal segment of SOS blocks the engagement of the allosteric site by Ras, providing a thermodynamic resistance to direct activation of SOS by Ras. But, because Ras is at the membrane, this mechanism also enables the activation of SOS in response to multiple cues that can act synergistically to overcome this resistance (Fig. 9). A key finding in this regard is that a Noonan syndrome-associated mutation in SOS (R552G), which weakens the auto-inhibition of SOS, results in activation only in a membrane-dependent context.
Figure 9.
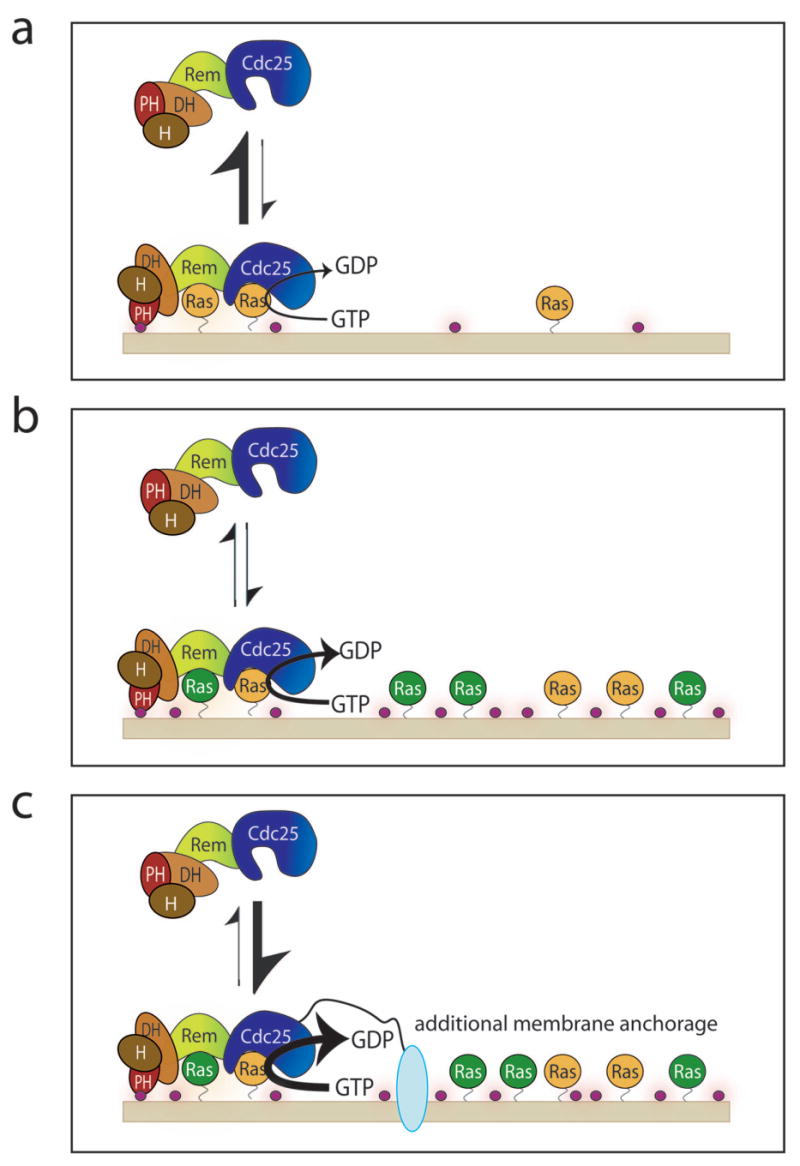
The integration of multiple membrane-localization signals in the activation of Ras and SOS. (a) At low Ras-GDP (orange) surface densities and low surface concentrations of PIP2 (purple circles), the N-terminal regulatory segment maintains SOS in an inactive state by inhibiting the localization of SOS to the membrane by allosteric Ras. Ras binding to the allosteric site causes a conformational change at the active site, promoting substrate engagement9. (b) The activity of auto-inhibited SOS is stimulated by increasing Ras density at the membrane, the replacement of Ras-bound GDP by GTP (green) and by increasing PIP2 concentrations in the membrane. (c) Further anchorage of SOS to the membrane, such as by the coupling to activated receptors, in combination with high levels of Ras density, the generation of Ras-GTP and high levels of PIP2, results in effective release of auto-inhibition.
The presence of the allosteric Ras binding site makes all the SOS constructs that we have studied, even those that are auto-inhibited, responsive to the surface density of Ras. The increased density of Ras in nanoclusters35 is therefore expected to strongly enhance SOS activity. The generation of an initial burst of Ras-GTP, either through the coupling of SOS to activated receptors, or through the action of agents such as phosphatidic acid18 or a priming exchange factor such as Ras-GRP112, will also result in substantial stimulation of SOS activity. SOS is responsive to the surface concentration of PIP2, and we have shown that the combination of high Ras surface density, the presence of Ras-GTP and high levels of PIP2 results in increased SOS activity despite the presence of the auto-inhibitory segments.
SOS appears to have evolved the capability of integrating multiple signals as a condition for the activation of Ras signaling. This property of SOS is reminiscent of the membrane-dependent activation of the Wiscott-Aldrich syndrome protein (WASP), which is controlled by Rho GTPases and other signals, such as the membrane density of PIP2, that are integrated to result in activation41,42. This complexity in the input/output response functions of proteins that are at key nodes in cellular signal transduction is likely to emerge as a general theme that ensures fidelity in cellular responses to input signals.
Methods
Protein Preparation
SOSHDPC (residues 1–1049), SOSDPC (residues 198–1049), and SOScat (residues 566–1049) of human SOS1 were expressed and purified as described10,24. We generated point mutants using the Quikchange site-directed mutagenesis kit (Stratagene) and confirmed by DNA sequencing. Mutant proteins were expressed and purified as for the wild-type proteins.
The typical 166-residue H-Ras construct used in previous studies8,10 was extended to include a C-terminal cysteine at position 181. The cysteine residue at position 118 of human Ha-Ras was mutated to serine, leaving one cysteine at position 181. Ras(C181,C118S) (residues 1–181, C118S) was cloned into a pProEx HTb vector (Invitrogen) using a BamHI and a EcoRI site. Ras(C181,C118S) was produced in Escherichia coli and purified using an N-terminal 6-His tag. Following elution, buffers were exchanged using a Fast Desalting Column (GE Healthcare) equilibrated in 25 mM Tris-Cl [pH 8.2], 50 mM NaCl and 4 mM DTT, followed by either size-exclusion chromatography on a Superdex 75 column (GE Healthcare) that was equilibrated in gel filtration buffer (25 mM HEPES-NaOH, pH 7.4, 100 mM NaCl, 10% (w/v) glycerol, and 2 mM TCEP) or treated with the TEV protease overnight at 4°C prior to gel filtration chromatography. Fractions of Ras(C181,C118S) were pooled and frozen at a final concentration of about 10 mg ml−1. Mass spectrometric analysis confirmed the identity of the proteins.
Preparation of maleimide-functionalized membranes
Phospholipids and analogs including 1,2-dioleoyl-sn-glycero-3-phosphocholine (DOPC), 1,2-dioleoyl-sn-glycero-3-[phospho-L-serine] (DOPS), 1,2-dioleoyl-sn-glycero-3-phosphate (DOPA), phosphatidylinositol-4,5-bisphosphate (PIP2) (swine brain), 1,2-dioleoyl-sn-glycero-3-phosphoinositol-3,4,5-trisphosphate (PIP3) and 1,2-dipalmitoyl-sn-glycero-3-phosphoethanolamine-N-[4-(p-maleimidomethyl)cyclohexane-carboxamide] (MCC-PE) were purchased from Avanti Polar Lipids. The fluorescent lipid analogs Texas Red 1,2-dihexadecanoyl-sn-glycero-3-phosphoethanolamine (TR-DHPE) and Marina Blue 1,2-dihexadecanoyl-sn-glycero-3-phosphoethanolamine (MB-DHPE) were purchased from Invitrogen.
Maleimide-functionalized vesicles were prepared by drying a mixture of DOPC, DOPS, MCC-PE and TR-DHPE (vesicle experiments) or MB-DHPE (supported bilayer experiments) in chloroform. Mixtures contained 10 mol% DOPS, 0–10 mol% MCC-PE, 0.3 mol% TR-DHPE or 2 mol% MB-DHPE, while the balance consisted of DOPC. Some experiments also included DOPA, PIP2 or PIP3 where noted. Dried lipid films were placed under vacuum or a gentle nitrogen stream for at least 1 h and resuspended in degassed buffer (25mM HEPES-NaOH [pH 7.4], 100 mM NaCl and 10% (w/v) glycerol). The hydrated films were subjected to repeated freeze/thaw cycles, and vesicles formed by extrusion through 100 nm polycarbonate filters or by probe sonication for PIP2-containing supported bilayer experiments. Vesicles were then immediately conjugated to Ras(C181,C118S) (overnight, 4°C), or used to form supported bilayers by vesicle rupture followed by Ras(C181,C118S) linkage (overnight, 4°C).
Preparation of Ras-coupled lipid vesicles
Ras(C181,C118S) was coupled to vesicles containing between 1–10 mol% maleimide-derivatized lipid in a reaction carried out under argon for 2 hrs at room temperature. Maleimide-lipid was present in 10-fold molar excess over Ras(C181,C118S). Coupling reactions were terminated and excess maleimide-lipid quenched by addition of 5 mM ß-mercaptoethanol. Unmodified Ras(C181,C118S) protein was separated from Ras(C181,C118S)-conjugated vesicles by size-exclusion chromatography using an XK-16 column (GE Healthcare) containing about 30 ml of Sepharose CL-4B resin (Sigma) equilibrated in gel filtration buffer (25 mM HEPES-NaOH [pH 7.4], 100 mM NaCl, 10% (w/v) glycerol and 1 mM DTT). Vesicle diameter (100–140 nm) and monodispersity both before and after Ras conjugation was confirmed by dynamic light scattering (Wyatt DynaPro Titan). Mass spectrometry confirmed the formation of a stable thioether linkage between Ras(C181,C118S) and maleimide-derivatized lipids.
The lipid concentration after Ras(C181,C118S)-conjugation was determined by TR-DHPE absorbance. Protein concentration and conjugation efficiency was measured by Bradford assay of Ras(C181,C118S)-containing vesicles, where the Bradford reagent signal due to lipids was removed by assaying equivalent vesicle solutions with no protein. We used SDS-PAGE to confirm protein conjugation measurements by creating solutions of equal Ras concentration by volume, but with different Ras conjugation efficiencies.
Nucleotide exchange experiments using Ras-coupled lipid vesicles
Nucleotide exchange activity was measured as described8,10. We used mant-dGDP (Jena Biosciences), instead of mant-GDP to avoid artifacts caused by isomerization of the fluorescent label31. Ras-coupled vesicles were incubated with a 10-fold molar excess of mant-dGDP in the presence of 0.2 mM EDTA in gel filtration buffer. Reactions were stopped with 4 mM MgCl2 and free nucleotide was removed by gel filtration using Nap-10 columns (GE Healthcare) equilibrated with reaction buffer (40 mM HEPES-NaOH [pH 7.4], 4 mM MgCl2 and 1 mM DTT). The final concentration of Ras-mant-dGDP-coupled vesicles was obtained using the Texas Red dilution factor, as described above.
Reactions were initiated by rapid mixing of 100 μl of 2 μM (or 20 nM) SOS with 100 μl of Ras-mant-dGDP-conjugated vesicles using a stopped flow apparatus (RX2000; Applied Photophysics) linked to a Fluoromax-3 fluorimeter (HORIBA Jobin Yvon). The surface density of Ras was varied, but the total concentration of Ras stock before mixing was kept constant at 2 μM. Reaction progress was monitored by fluorescence intensity at 430 nm with 370 nm excitation. Reactions were performed at 25°C in reaction buffer supplemented with 2 mM unlabeled GDP or GTP nucleotide.
Data were obtained by repeating reactions on different days with different protein samples and different Ras-coupled vesicle preparations. The data were fit to either a single- or double-exponential decay function using the program Prism 4 (Graphpad Prism, Inc.). For display purposes, data were normalized between 1 and the minimum fluorescence value observed for a given preparation of vesicles.
Preparation of Ras-conjugated supported planar bilayers
Supported bilayer experiments were performed in a glass-bottomed 96-well plate (Nalge Nunc International). Maleimide-functionalized vesicles (50 μl, 1 mg ml−1 total lipid concentration) in 50 mM Tris-HCl [pH 7.4], 750 mM NaCl were added to 50 μl H2O in a NaOH-cleaned well, equilibrated for 10 min, and rinsed with 5 mL 0.1% (w/v) bovine serum albumin (BSA) in 10 mM Tris-HCl [pH 7.4], 150 mM NaCl. Ras(C181,C118S) protein was added to a final concentration of 8 mg ml−1 and the conjugation was carried out overnight at 4°C. Bilayers were washed with 5 mL loading buffer (40 mM HEPES-NaOH [pH 7.4]) supplemented with 50 mM EDTA followed by incubation for 1.5 hrs at 4°C.
Wells were re-equilibrated into loading buffer and incubated with 100 mM BODIPY-GDP or BODIPY-GTP (Invitrogen) with 5 mM MgCl2 for 1 h at 4°C. Unbound nucleotide was washed away with loading buffer supplemented with 5 mM MgCl2. Fluorescence recovery showed that both MB-DHPE lipids and BODIPY-labeled nucleotides on Ras were laterally mobile (Supplementary Fig. 4 online).
The surface density of Ras in each well was measured after exchange reactions were complete by mouse anti-pan-Ras IgG (EMD Biosciences) binding followed by BODIPY-goat anti-mouse IgG (Invitrogen) binding. The fluorescence intensity of anti-mouse IgG (adjusted for labeling efficiency and absorption/fluorescence characteristics) was compared to bilayer standards with known BODIPY-DHPE lipid density.
Nucleotide exchange experiments using Ras-coupled supported lipid bilayers
Reactions on supported bilayers were conducted using a Nikon TE-300 microscope equipped with a Photometrics Coolsnap HQ CCD camera. Exchange reactions were initiated by rapid addition and mixing to give a final concentration of 10 nM SOS, 200 μM GDP (or GTP) in reaction buffer (40 mM HEPES-NaOH [pH 7.4], 5 mM MgCl2). Reaction progress was monitored by the emission intensity of the bilayer minus the intensity of a scratched region of bare glass in the same frame to correct for solution signal (Supplementary Fig. 5 online). The resulting intensity was fit to a sum of two exponential decays using Prism 4 (Graphpad Prism, Inc.). Fluorescence values are normalized to 1 for display purposes.
Cell culture, transfections and immunofluorescence labeling
COS1 cells were cultured in Dulbecco's Modified Eagle's Medium (GIBCO-BRL) supplemented with 5% (v/v) fetal bovine serum (FBS) (GIBCO-BRL) in a humidified incubator with 5% CO2 at 37°C. Cell transfections were performed using the Fugene 6 transfection reagent (Roche) as per manufacturer's directions.
COS1 cells were grown on cover slips and transfected with GFP-tagged H-Ras(A59G D38E) and either the SOScat or SOScat(L687E R688A) construct cloned into the pCGT expression vector. After 24 hrs of expression, cells were fixed in 3.7% (v/v) formaldehyde in phosphate-buffered saline (PBS) for 1 h at room temperature. Cells were then permeabilized with 0.1% (v/v) Triton X-100 for 3 min at room temperature, then washed 5 times with PBS, and subsequently incubated in 2% (w/v) BSA/PBS for 10 min. Anti-T7 antibody (Novagen; 1:500) was diluted in 2% (w/v) BSA/PBS and incubated with the cells for 1hr at 37°C. The cells were washed five times with PBS and incubated with rhodamine-conjugated goat anti-mouse antibody (Cappel; 1:100) for 1 h at 37°C. Coverslips were mounted in Immunomount (Shandon) and examined using a Zeiss Axiovert 200M microscope (Zeiss).
Generation of SOScat/H-Ras lipid tail fusion constructs
A PCR fragment containing the last 25 amino acids of pCGN-H-Ras with 5′ KPNI and 3′ BamHI engineered restriction sites was digested with the respective enzymes. This fragment was cloned in frame into pCGT-SOScat or pCGT-SOScat(L687E R688A) digested with KPNI and BamHI, creating a SOScat-H-Ras fusion containing amino acids 564–1049 of SOS fused to the last 25 amino acids of H-Ras.
ERK-MAP kinase activation assay
ERK activation was determined by co-transfecting HeLa cells with HA-tagged ERK-MAP kinase and the indicated T7-tagged SOS constructs. After 24 hrs of expression, the cells were serum starved for 16 hrs. Cells were washed twice with ice cold PBS and lysed in 400 μl ice cold buffer containing 10 mM Tris pH 7.6, 150 mM NaCl, 1 mM EDTA, 10% (w/v) glycerol, 1% (v/v) Triton X-100, 1 mM Na3VO4, 1 mM NaF, 1 mM phenyl-methanesulfonyl fluoride, 10 μg ml−1 pepstatin, 10 μg ml−1 aprotinin, 10 μg ml−1 leupeptin, and 10 mM benzamidine. The lysates were clarified at 14,000 × g for 15 min and then incubated with anti-HA antibody (12CA5) for 1 h at 4°C. The immune complexes were incubated with protein A-Sepharose beads (Sigma) for 45 min at 4°C. Immune complexes were washed four times with ice-cold lysis buffer and eluted with SDS sample buffer. Samples were run on SDS-PAGE gels and transferred to nitrocellulose membranes (Schleicher & Schuell). The membranes were incubated with either anti-T7 (Novagen, 1:10,000) or anti-ERK2 (Upstate Biotechnology, 1:1,000) and phospho-ERK1/2 (Cell Signaling, 1:1,000) antibodies. Subsequently, membranes were incubated with IRDye 800 conjugated goat anti-rabbit (Rockland, 1:10,000) and Alexa-Fluor 680 goat anti-mouse (Molecular Probes, 1:10,000) and visualized using the Odyssey Infrared Imaging System (LiCor). Relative ERK phosphorylation was quantified using Odyssey software and normalized to total ERK expression.
Supplementary Material
Acknowledgments
We thank Tanya Freedman, Olga Kuchment, Nick Endres, Xuewu Zhang and Meindert Lamers for helpful discussions; and David King for mass spectrometry. J.G. is supported by the Molecular Biophysics NIH grant T32 GM008295. J.T.G. and W.J.G. are supported by Chemical Sciences, Geosciences and Biosciences Division, Office of Basic Energy Sciences of the U.S. Department of Energy under Contract No. DE_AC03-76SF00098 and D.B.-S. by NIH GM078266.
References
- 1.Pawson T, Scott JD. Signaling through scaffold, anchoring, and adaptor proteins. Science. 1997;278:2075–80. doi: 10.1126/science.278.5346.2075. [DOI] [PubMed] [Google Scholar]
- 2.Kholodenko BN, Hoek JB, Westerhoff HV. Why cytoplasmic signalling proteins should be recruited to cell membranes. Trends Cell Biol. 2000;10:173–8. doi: 10.1016/s0962-8924(00)01741-4. [DOI] [PubMed] [Google Scholar]
- 3.Kuriyan J, Eisenberg D. The origin of protein interactions and allostery in colocalization. Nature. 2007;450:983–90. doi: 10.1038/nature06524. [DOI] [PubMed] [Google Scholar]
- 4.Schlessinger J. Cell signaling by receptor tyrosine kinases. Cell. 2000;103:211–25. doi: 10.1016/s0092-8674(00)00114-8. [DOI] [PubMed] [Google Scholar]
- 5.Quilliam LA. New insights into the mechanisms of SOS activation. Sci STKE. 2007;2007:67. doi: 10.1126/stke.4142007pe67. [DOI] [PubMed] [Google Scholar]
- 6.Boriack-Sjodin PA, Margarit SM, Bar-Sagi D, Kuriyan J. The structural basis of the activation of Ras by Sos. Nature. 1998;394:337–43. doi: 10.1038/28548. [DOI] [PubMed] [Google Scholar]
- 7.Aronheim A, et al. Membrane targeting of the nucleotide exchange factor Sos is sufficient for activating the Ras signaling pathway. Cell. 1994;78:949–61. doi: 10.1016/0092-8674(94)90271-2. [DOI] [PubMed] [Google Scholar]
- 8.Margarit SM, et al. Structural evidence for feedback activation by Ras.GTP of the Ras-specific nucleotide exchange factor SOS. Cell. 2003;112:685–95. doi: 10.1016/s0092-8674(03)00149-1. [DOI] [PubMed] [Google Scholar]
- 9.Freedman TS, et al. A Ras-induced conformational switch in the Ras activator Son of sevenless. Proc Natl Acad Sci U S A. 2006;103:16692–7. doi: 10.1073/pnas.0608127103. [DOI] [PMC free article] [PubMed] [Google Scholar]
- 10.Sondermann H, et al. Structural analysis of autoinhibition in the Ras activator Son of sevenless. Cell. 2004;119:393–405. doi: 10.1016/j.cell.2004.10.005. [DOI] [PubMed] [Google Scholar]
- 11.Boykevisch S, et al. Regulation of ras signaling dynamics by sos-mediated positive feedback. Curr Biol. 2006;16:2173–9. doi: 10.1016/j.cub.2006.09.033. [DOI] [PubMed] [Google Scholar]
- 12.Roose JP, Mollenauer M, Ho M, Kurosaki T, Weiss A. Unusual interplay of two types of Ras activators, RasGRP and SOS, establishes sensitive and robust Ras activation in lymphocytes. Mol Cell Biol. 2007;27:2732–45. doi: 10.1128/MCB.01882-06. [DOI] [PMC free article] [PubMed] [Google Scholar]
- 13.Soisson SM, Nimnual AS, Uy M, Bar-Sagi D, Kuriyan J. Crystal structure of the Dbl and pleckstrin homology domains from the human Son of sevenless protein. Cell. 1998;95:259–68. doi: 10.1016/s0092-8674(00)81756-0. [DOI] [PubMed] [Google Scholar]
- 14.Zheng J, et al. The solution structure of the pleckstrin homology domain of human SOS1. A possible structural role for the sequential association of diffuse B cell lymphoma and pleckstrin homology domains. J Biol Chem. 1997;272:30340–4. doi: 10.1074/jbc.272.48.30340. [DOI] [PubMed] [Google Scholar]
- 15.Kubiseski TJ, Chook YM, Parris WE, Rozakis-Adcock M, Pawson T. High affinity binding of the pleckstrin homology domain of mSos1 to phosphatidylinositol (4,5)-bisphosphate. J Biol Chem. 1997;272:1799–804. doi: 10.1074/jbc.272.3.1799. [DOI] [PubMed] [Google Scholar]
- 16.Koshiba S, et al. The solution structure of the pleckstrin homology domain of mouse Son-of-sevenless 1 (mSos1) J Mol Biol. 1997;269:579–91. doi: 10.1006/jmbi.1997.1041. [DOI] [PubMed] [Google Scholar]
- 17.Chen RH, Corbalan-Garcia S, Bar-Sagi D. The role of the PH domain in the signal-dependent membrane targeting of Sos. Embo J. 1997;16:1351–9. doi: 10.1093/emboj/16.6.1351. [DOI] [PMC free article] [PubMed] [Google Scholar]
- 18.Zhao C, Du G, Skowronek K, Frohman MA, Bar-Sagi D. Phospholipase D2-generated phosphatidic acid couples EGFR stimulation to Ras activation by Sos. Nat Cell Biol. 2007;9:707–12. doi: 10.1038/ncb1594. [DOI] [PubMed] [Google Scholar]
- 19.Buday L, Downward J. Epidermal growth factor regulates p21ras through the formation of a complex of receptor, Grb2 adapter protein, and Sos nucleotide exchange factor. Cell. 1993;73:611–20. doi: 10.1016/0092-8674(93)90146-h. [DOI] [PubMed] [Google Scholar]
- 20.Egan SE, et al. Association of Sos Ras exchange protein with Grb2 is implicated in tyrosine kinase signal transduction and transformation. Nature. 1993;363:45–51. doi: 10.1038/363045a0. [DOI] [PubMed] [Google Scholar]
- 21.Gale NW, Kaplan S, Lowenstein EJ, Schlessinger J, Bar-Sagi D. Grb2 mediates the EGF-dependent activation of guanine nucleotide exchange on Ras. Nature. 1993;363:88–92. doi: 10.1038/363088a0. [DOI] [PubMed] [Google Scholar]
- 22.Li N, et al. Guanine-nucleotide-releasing factor hSos1 binds to Grb2 and links receptor tyrosine kinases to Ras signalling. Nature. 1993;363:85–8. doi: 10.1038/363085a0. [DOI] [PubMed] [Google Scholar]
- 23.Sondermann H, Soisson SM, Bar-Sagi D, Kuriyan J. Tandem histone folds in the structure of the N-terminal segment of the ras activator Son of Sevenless. Structure. 2003;11:1583–93. doi: 10.1016/j.str.2003.10.015. [DOI] [PubMed] [Google Scholar]
- 24.Sondermann H, Nagar B, Bar-Sagi D, Kuriyan J. Computational docking and solution x-ray scattering predict a membrane-interacting role for the histone domain of the Ras activator son of sevenless. Proc Natl Acad Sci U S A. 2005;102:16632–7. doi: 10.1073/pnas.0508315102. [DOI] [PMC free article] [PubMed] [Google Scholar]
- 25.Tartaglia M, Gelb BD. Noonan syndrome and related disorders: genetics and pathogenesis. Annu Rev Genomics Hum Genet. 2005;6:45–68. doi: 10.1146/annurev.genom.6.080604.162305. [DOI] [PubMed] [Google Scholar]
- 26.Roberts AE, et al. Germline gain-of-function mutations in SOS1 cause Noonan syndrome. Nat Genet. 2007;39:70–74. doi: 10.1038/ng1926. [DOI] [PubMed] [Google Scholar]
- 27.Tartaglia M, et al. Gain-of-function SOS1 mutations cause a distinctive form of Noonan syndrome. Nat Genet. 2007;39:75–9. doi: 10.1038/ng1939. [DOI] [PubMed] [Google Scholar]
- 28.McNew JA, et al. Close is not enough: SNARE-dependent membrane fusion requires an active mechanism that transduces force to membrane anchors. J Cell Biol. 2000;150:105–17. doi: 10.1083/jcb.150.1.105. [DOI] [PMC free article] [PubMed] [Google Scholar]
- 29.Pechlivanis M, Ringel R, Popkirova B, Kuhlmann J. Prenylation of Ras facilitates hSOS1-promoted nucleotide exchange, upon Ras binding to the regulatory site. Biochemistry. 2007;46:5341–8. doi: 10.1021/bi602353k. [DOI] [PubMed] [Google Scholar]
- 30.Lenzen C, Cool RH, Wittinghofer A. Analysis of intrinsic and CDC25-stimulated guanine nucleotide exchange of p21ras-nucleotide complexes by fluorescence measurements. Methods Enzymol. 1995;255:95–109. doi: 10.1016/s0076-6879(95)55012-7. [DOI] [PubMed] [Google Scholar]
- 31.Guo Z, Ahmadian MR, Goody RS. Guanine nucleotide exchange factors operate by a simple allosteric competitive mechanism. Biochemistry. 2005;44:15423–9. doi: 10.1021/bi0518601. [DOI] [PubMed] [Google Scholar]
- 32.Ahmadian MR, Wittinghofer A, Herrmann C. Fluorescence methods in the study of small GTP-binding proteins. Methods Mol Biol. 2002;189:45–63. doi: 10.1385/1-59259-281-3:045. [DOI] [PubMed] [Google Scholar]
- 33.Groves JT, Dustin ML. Supported planar bilayers in studies on immune cell adhesion and communication. J Immunol Methods. 2003;278:19–32. doi: 10.1016/s0022-1759(03)00193-5. [DOI] [PubMed] [Google Scholar]
- 34.Scheele JS, Rhee JM, Boss GR. Determination of absolute amounts of GDP and GTP bound to Ras in mammalian cells: comparison of parental and Ras-overproducing NIH 3T3 fibroblasts. Proc Natl Acad Sci U S A. 1995;92:1097–100. doi: 10.1073/pnas.92.4.1097. [DOI] [PMC free article] [PubMed] [Google Scholar]
- 35.Tian T, et al. Plasma membrane nanoswitches generate high-fidelity Ras signal transduction. Nat Cell Biol. 2007;9:905–14. doi: 10.1038/ncb1615. [DOI] [PubMed] [Google Scholar]
- 36.Plowman SJ, Muncke C, Parton RG, Hancock JF. H-ras, K-ras, and inner plasma membrane raft proteins operate in nanoclusters with differential dependence on the actin cytoskeleton. Proc Natl Acad Sci U S A. 2005;102:15500–5. doi: 10.1073/pnas.0504114102. [DOI] [PMC free article] [PubMed] [Google Scholar]
- 37.Lenzen C, Cool RH, Prinz H, Kuhlmann J, Wittinghofer A. Kinetic analysis by fluorescence of the interaction between Ras and the catalytic domain of the guanine nucleotide exchange factor Cdc25Mm. Biochemistry. 1998;37:7420–30. doi: 10.1021/bi972621j. [DOI] [PubMed] [Google Scholar]
- 38.Mor A, et al. The lymphocyte function-associated antigen-1 receptor costimulates plasma membrane Ras via phospholipase D2. Nat Cell Biol. 2007;9:713–9. doi: 10.1038/ncb1592. [DOI] [PubMed] [Google Scholar]
- 39.McLaughlin S, Wang J, Gambhir A, Murray D. PIP(2) and proteins: interactions, organization, and information flow. Annu Rev Biophys Biomol Struct. 2002;31:151–75. doi: 10.1146/annurev.biophys.31.082901.134259. [DOI] [PubMed] [Google Scholar]
- 40.Honda A, et al. Phosphatidylinositol 4-phosphate 5-kinase alpha is a downstream effector of the small G protein ARF6 in membrane ruffle formation. Cell. 1999;99:521–32. doi: 10.1016/s0092-8674(00)81540-8. [DOI] [PubMed] [Google Scholar]
- 41.Papayannopoulos V, et al. A polybasic motif allows N-WASP to act as a sensor of PIP(2) density. Mol Cell. 2005;17:181–91. doi: 10.1016/j.molcel.2004.11.054. [DOI] [PubMed] [Google Scholar]
- 42.Buck M, Xu W, Rosen MK. A two-state allosteric model for autoinhibition rationalizes WASP signal integration and targeting. J Mol Biol. 2004;338:271–85. doi: 10.1016/j.jmb.2004.02.036. [DOI] [PubMed] [Google Scholar]
Associated Data
This section collects any data citations, data availability statements, or supplementary materials included in this article.