Abstract
Background
Reliable and consistent methods are required for the identification and classification of freshwater snails belonging to the genus Bulinus (Gastropoda, Planorbidae) which act as intermediate hosts for schistosomes of both medical and veterinary importance. The current project worked towards two main objectives, the development of a cost effective, simple screening method for the routine identification of Bulinus isolates and the use of resultant sequencing data to produce a model of relationships within the group.
Results
Phylogenetic analysis of the DNA sequence for a large section (1009 bp) of the mitochondrial gene cytochrome oxidase subunit 1 (cox1) for isolates of Bulinus demonstrated superior resolution over that employing the second internal transcribed spacer (its2) of the ribosomal gene complex. Removal of transitional substitutions within cox1 because of saturation effects still allowed identification of snails at species group level. Within groups, some species could be identified with ease but there were regions where the high degree of molecular diversity meant that clear identification of species was problematic, this was particularly so within the B. africanus group.
Conclusion
The sequence diversity within cox1 is such that a barcoding approach may offer the best method for characterization of populations and species within the genus from different geographical locations. The study has confirmed the definition of some accepted species within the species groups but additionally has revealed some unrecognized isolates which underlines the need to use molecular markers in addition to more traditional methods of identification. A barcoding approach based on part of the cox1 gene as defined by the Folmer primers is proposed.
Background
Freshwater snails belonging to the genus Bulinus act as intermediate hosts in the life cycle of the widespread and debilitating parasitic disease schistosomiasis in Africa, Madagascar and adjacent regions (see Fig. 1). Schistosome species within the S. haematobium group which depend on snails from Bulinus for transmission include three human pathogens (S. haematobium, S. intercalatum and S. guiniensis) and five others which may infect wild and domestic ruminants (S. bovis, S. curassoni, S. mattheei, S. leiperi and S. margrebowiei). The relationship and interaction between schistosomes and snails is very specific and compatibility may differ over quite small geographical ranges [1]. A reliable taxonomy of the genus Bulinus is a fundamental prerequisite for understanding the epidemiology of this disease.
Figure 1.
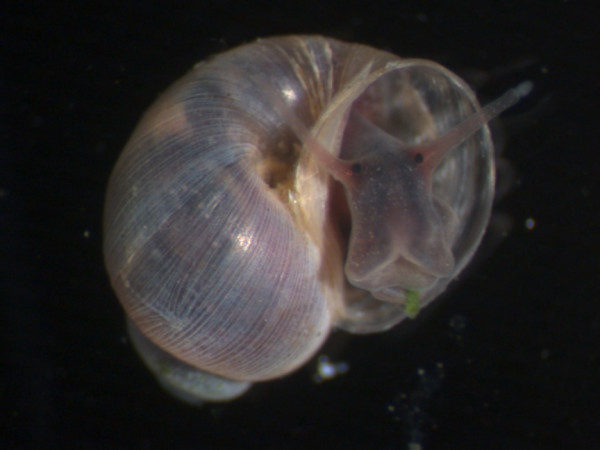
Bulinus wrighti. Bulinus wrighti an intermediate host of Schistosoma haematobium in South Yemen.
The thirty six species within the genus have been placed into four species 'groups' [2]; the B. africanus group, B. forskalii group, B. reticulatus group and the B. truncatus/tropicus complex. For the most part, species have been classified on the basis of their morphology although, in recent decades, the study of ploidy [3], allozymes [4-6] and DNA methods [7-13] have all played an increasing role in species discrimination. Morphological characters, whilst adequate to allocate a specimen to a species group are sometimes unreliable when used to classify at higher resolution [8,10] especially within the B. africanus group. Consequently, there is a requirement for a robust system of identification and classification to supplement more traditional approaches. The data presented here represent initial steps towards achieving consistency and uniformity in the identification process. Nuclear (its2) and mitochondrial (cox1) sequences are compared with respect to their ability to resolve species and species group relationships within Bulinus and cox1 is used to screen 81 isolates and place them in a phylogenetic context.
Methods
Samples
The available samples selected for study represented as diverse a group as possible within the genus Bulinus and comprised of both collected and donated material that took the form of specimens from the field and maintained cultures which were stored in liquid nitrogen, ethanol or used fresh (Table 1). Those specimens preserved in ethanol were left in TE buffer pH 7.4 overnight in order to perfuse out any remaining alcohol from within the tissue that might interfere with subsequent extraction techniques.
Table 1.
Isolates included in the study with key to alphanumeric identifiers used in the Figures.
| Label on tree | Field collected (F) or Lab culture (L) | Putative identification | Sample origin | GPS Co-ordinate where available | Accession numbers |
| A1 | F | B. globosus | Pemba Island, Tanzania | S05 24 626/E39 43 756 | AM921823 |
| A2 | F | B. globosus | Ngwachani school, Pemba Island, Tanzania | S05 19 364/E39 44 517 | AM921826 |
| A3 | F | B. globosus | Chan-jamjawiri, Pemba Island, Tanzania | S05 18 094/E39 45 192 | AM921828 |
| A4 | F | B. globosus | Machengwe, Pemba Island, Tanzania | S05 04 957/E39 45 814 | AM921829 |
| A5 | F | B. globosus | Kimbuni, Pemba Island, Tanzania | S05 21 231/E39 42 841 | AM921830 |
| A6 | F | B. globosus | Road to Mtangani, Pemba Island, Tanzania | S05 21 525/E39 46 122 | AM921820 |
| A7 | F | B. globosus | Road to Mtangani, Pemba Island, Tanzania | S05 21 600/E39 46 125 | AM921825 |
| A8 | F | B. globosus | Ngwachani school, Pemba Island, Tanzania | S05 19 364/E39 44 517 | AM921827 |
| A9 | F | B. globosus | Pietermaritzburg, South Africa (Prof. K. N. De Kock) | AM286289 | |
| A10 | F | B. globosus | Pietermaritzburg, South Africa (Prof. K. N. De Kock) | AM286290 | |
| A11 | F | B. globosus | Tiengre stream, Kisumu, West Kenya (via DBL) | AM286285 | |
| A12 | F | B. globosus | Tiengre stream, Kisumu, West Kenya (via DBL) | AM286284 | |
| A13 | F | B. globosus | Kandaria dam, Kisumu, West Kenya (via DBL) | AM286286 | |
| A14 | F | B. globosus | Ipogoro, Iringa, Tanzania | AM286288 | |
| A15 | F | B. globosus | Lugufu, Tanzania (Dr E. Michel) | S05 05 371/E30 11 689 | AM286287 |
| A16 | F | B. globosus | IRDC farm, Iringa, Tanzania (Dr S. Walker) | S07 46 290/E35 45 590 | AM921821 |
| A17 | F | B. globosus | IRDC farm, Iringa, Tanzania (Dr S. Walker) | S07 46 285/E35 45 355 | AM921824 |
| A18 | F | B. globosus | Moyo, Uganda | N03 28 219/E31 55 360 | AM286291 |
| A19 | F | B. globosus | Moyo, Uganda | N03 28 219/E31 55 360 | AM921843 |
| A20 | F | B. globosus | Moyo, Uganda | N03 28 219/E31 55 360 | AM921851 |
| A21 | F | B. globosus | Kachetu, East Kenya | S03 54 350/E39 32 250 | AM921847 |
| A22 | F | B. globosus | Mwamduli, East Kenya | S03 54 350/E39 31 470 | AM921850 |
| A23 | F | B. globosus | Kinyasini, Unguja Island, Tanzania | S05 58 180/E39 18 573 | AM286292 |
| A24 | F | B. globosus | Kinango, East Kenya | S04 05 263/E39 18 721 | AM921845 |
| A25 | F | B. globosus | Kinango, East Kenya | S04 05 263/E39 18 721 | AM921844 |
| A26 | F | B. globosus | Kinyasini, Unguja, Island, Tanzania | S05 58 180/E39 18 573 | AM921839 |
| A27 | F | B. globosus | Kinyasini, Unguja, Island, Tanzania | S05 58 180/E39 18 573 | AM921840 |
| A28 | F | B. africanus | Isipingo, Durban, South Africa, (Prof. C. Appleton) | S29 58 584/E30 55 503 | AM286295 |
| A29 | F | B. africanus | Isipingo, Durban, South Africa, (Prof. C. Appleton) | S29 58 584/E30 55 503 | AM286296 |
| A30 | F | B. globosus | Mogtedo barrage, Burkina Faso | N12 18 388/W00 49 670 | AM286293 |
| A31 | F | B. globosus | Tondia, Niger | N14 28 348/W01 05 635 | AM286294 |
| A32 | F | B. globosus | Thiekeene Hulle, Senegal | AM921808 | |
| A33 | F | Bulinus sp | ADC farm, Kisumu, West Kenya (via DBL) | AM286297 | |
| A34 | F | Bulinus sp | Lake Sagara, Tanzania (Dr E. Michel) | S05 15 084/E31 05 111 | AM286298 |
| A35 | F | B. nasutus productus | Road to Cawente, Uganda | N01 49 341/E33 32 235 | AM921815 |
| A36 | F | B. nasutus productus | Road to Cawente, Uganda | N01 49 341/E33 32 235 | AM921816 |
| A37 | F | B. nasutus productus | Ihayabuyaga, Tanzania | AM286300 | |
| A38 | F | B. nasutus productus | Njombe Rujewa, Tanzania, (Dr S. Walker) | AM921833 | |
| A39 | F | B. nasutus productus | Ihayabuyaga, Tanzania | AM286301 | |
| A40 | F | B. nasutus productus | Kahangara, Tanzania | AM286302 | |
| A41 | F | B. nasutus nasutus | Vitonguji, Pemba Island, Tanzania | S05 14 027/E39 49 706 | AM921810 |
| A42 | F | B. nasutus nasutus | Pujini Kikweche, Pemba Island, Tanzania | S05 18 843/E39 47 863 | AM921822 |
| A43 | F | B. nasutus nasutus | Pujini, Pemba Island, Tanzania | S05 18 988/E39 48 667 | AM921813 |
| A44 | F | B. nasutus nasutus | Vitonguji, Pemba Island, Tanzania | S05 14 027/E39 49 706 | AM921809 |
| A45 | F | B. nasutus nasutus | Muyuni, Unguja, Tanzania | S06 22 707/E39 27 849 | AM286299 |
| A46 | F | B. nasutus nasutus | Pemba Island, Tanzania | S05 10 272/E39 49 319 | AM921812 |
| A47 | F | B. nasutus nasutus | Pemba Island, Tanzania | S05 10 272/E39 49 319 | AM921811 |
| A48 | F | B. nasutus nasutus | Mafia Island, Tanzania | S07 50 838/E39 47 354 | AM921831 |
| A49 | F | B. nasutus nasutus | Bovo, East Kenya | S04 28 054/E39 28 108 | AM921849 |
| A50 | F | B. nasutus nasutus | Nimbodze, East Kenya | S04 28 317/E39 27 092 | AM921841 |
| A51 | F | B. nasutus nasutus | Nimbodze, East Kenya | S04 28 323/E39 27 098 | AM921846 |
| F52 | F | Bulinus sp | Road to Cawente, Uganda | N01 49 341/E33 32 235 | AM921819 |
| F53 | F | B. camerunensis | Lake Barombi, Kotto, Cameroon | AM286309 | |
| F54 | F | B. forskalii | Mogtedo barrage, Burkina Faso | N12 18 388 W00 49 670 | AM286310 |
| F55 | F | B. forskalii | Satoni, Niger | AM286308 | |
| F56 | L | B. forskalii | Dakar, Senegal | AM286307 | |
| F57 | L | B. forskalii | City of São Tomé, São Tomé Island | AM286305 | |
| F58 | L | B. forskalii | Quifangondo, Province of Bengo, Angola | AM286306 | |
| F59 | F | Bulinus sp | Pemba Island, Tanzania | S04 55 682/E39 44 271 | AM921832 |
| F60 | F | Bulinus sp | Kamwiju Kaloleni, East Kenya | AM921848 | |
| F61 | L | B. cernicus | Mont Oreb, Mauritius | AM286303 | |
| F62 | L | B. cernicus | Perebere, Mauritius | AM286304 | |
| F63 | F | B. barthi | Kangagani, Pemba Island, Tanzania | S05 09 911/E39 49 527 | AM921818 |
| F64 | F | B. barthi | Kanga swamp, Mafia Island, Tanzania | S07 43 358/E39 51 505 | AM921814 |
| F65 | F | B. barthi | Kanga swamp, Mafia Island, Tanzania | S07 43 362/E39 51 505 | AM921817 |
| R66 | L | B. wrighti | Oman (via Perpignan) | AM286318 | |
| T67 | L | B. natalensis | Lake Sibaya, South Africa | AM286311 | |
| T68 | L | B. natalensis | Lake Sibaya, South Africa | AM921835 | |
| T69 | L | B. natalensis | Lake Sibaya, South Africa | AM921836 | |
| T70 | F | B. tropicus | Njombe Kibena, Tanzania, (Dr S. Walker) | S09 12 229/E34 47 041 | AM921842 |
| T71 | F | B. tropicus | Njombe Kibena, Tanzania, (Dr S. Walker) | S09 12 229/E34 47 041 | AM921834 |
| T72 | F | B. tropicus | Njombe Kibena, Tanzania, (Dr S. Walker) | S09 12 229/E34 47 041 | AM921837 |
| T73 | F | B. nyassanus | Kasankha, Monkey Bay, Lake Malawi | Transect line north: E07 00 595/N84 38 260 Transect line south: E07 00 617/N84 38 277 | AM921838 |
| T74 | F | B. truncatus | Nyanguge, Tanzania | AM286313 | |
| T75 | F | B. truncatus | Posada, Sardinia (Prof. Marco Curini Galletti & Dr D.T.J. Littlewood) | N40 38 092/E09 40 522 | AM286312 |
| T76 | L | B. truncatus | Mondego River, Coimbra, Portugal (Prof. M.A. Gracio) | AM286314 | |
| T77 | F | B. truncatus | Mbane, Senegal | AM921806 | |
| T78 | F | B. truncatus | Bouton Batt, Senegal | AM921807 | |
| T79 | F | B. truncatus | Mogtedo barrage, Burkina Faso | N12 18 388/W00 49 670 | AM286315 |
| T80 | F | B. truncatus | Satoni, Niger | N14 26 671/E01 07 257 | AM286316 |
| T81 | F | B. truncatus | Satoni, Niger | N14 26 685/E01 07 316 | AM286317 |
| B. glabrata | B. glabrata | Brazil | AY380531 |
Extraction of genomic/mitochondrial DNA
Total genomic DNA was extracted from whole snail tissue in a manner similar to that outlined by Stothard et al [7] with minor modification. Snail tissue was homogenized in lysis buffer (100 mM Tris, 1.4 M NaCl, 16 mM EDTA, 2% hexadecyltrimethylammonium bromide [CTAB]). To this was added 20 μl of proteinase K (20 mg/ml) and the whole mixed in a rotisserie incubator at 55°C for 1.5 to 2.0 hours. Subsequently, an equal volume of chloroform/isoamyl alcohol (24:1) was added to the digest and gently mixed. Tubes containing the digest were then spun at 13,000 rpm for 10 minutes. The upper aqueous layer was removed using 'wide bore' pipette tips and nucleic acids were precipitated in 'Analar' grade absolute ethanol. Following precipitation for 15 minutes at -20°C, the DNA was centrifuged again at 13,000 rpm to form a pellet. The absolute ethanol was removed and the pellet washed in 70% ethanol before a final centrifugation at 13,000 rpm. The ethanol was then discarded and the pellet dried in a dry heating block at 90°C for 5 minutes before dissolution in an appropriate amount of purified water.
Amplification of cox1 and its2 fragments
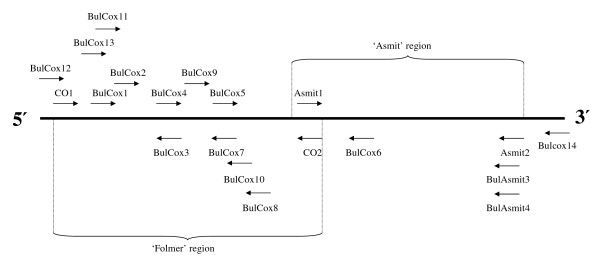
The partial cox1 fragment was amplified in one, two or more sections from the mitochondrial component of extracted total genomic DNA using the polymerase chain reaction (PCR) and various combinations of the primers that are shown in Table 2 (see additional file 1, for PCR and sequencing primers that proved successful with particular isolates and Fig. 2 for approximate primer locations). Amplicons of its2 were generated in a single section using two primers ETTS1 and ETTS10 (see Table 2). Either an Applied Biosystems GeneAmp PCR System 2400 or 2700 thermal cycler were used throughout the project in combination with GE Healthcare 'Ready-To-Go' PCR beads. Upon reconstitution with an appropriate volume of template, primer and pure water to a total of 25 μl, each dissolved bead forms a solution containing 200 μM of each dNTP, 10 mM Tris-HCl, 50 mM KCl and 1.5 mM of MgCl2. Cycling conditions for both cox1 and its2 PCR reactions were as follows: one cycle of 94°C for 5 min, 45 cycles of 94°C for 15 sec, 40°C for 30 sec and 72°C for 45 sec (in the case of cox1 this was increased to 1 min for amplicons over 1000 bp) and a final single cycle of 72°C for 7 min. PCR fragments were separated on a 1% agarose gel and bands were excised using a scalpel blade. The recovered DNA was purified for sequencing using a QIAquick Gel Extraction Kit (Qiagen). Following quantification and a check for purity with a Nanodrop ND-1000 Spectrophotometer (Nanodrop Technologies Inc), sequencing reactions were performed directly on each PCR product using an Applied Biosystems Big Dye Kit version 1.1 and run on an Applied Biosystems 3730 DNA Analyzer. Resultant electropherograms were checked and cox1/its2 sequences edited using Sequencher 4.6 software (Gene Codes Corporation).
Table 2.
Primers used for PCR amplification and sequencing
| Primer name | Cytochrome oxidase subunit 1 – primer sequence | Forward or Reverse | Source |
| Asmit1 (AT1) | 5' TTT TTT GGG CAT CCT GAG GTT TAT 3' | Forward | [26] |
| Asmit2 (AT2) | 5' TAA AGA AAG AAC ATA ATG AAA ATG 3' | Reverse | [26] |
| CO1 (LC1490) | 5' GGT CAA CAA ATC ATA AAG ATA TTG G 3' | Forward | [18] |
| CO2 (HCO2198) | 5' TAA ACT TCA GGG TGA CCA AAA AAT CA 3' | Reverse | [18] |
| BulCox1 (BC1) | 5' TTT TTG GWG TTT GAT GTG G 3' | Forward | NHM – current project |
| BulCox2 (BC2) | 5' TGT GGT CTG GTA GGW ACC GG 3' | Forward | NHM – current project |
| BulCox3 (BC3) | 5' CGT GGA AAW CTT ATA TCW GGW GC 3' | Reverse | NHM – current project |
| BulCox4 (BC4) | 5' GCW CCW GAT ATA AGW TTT CCA CG 3' | Forward | NHM – current project |
| BulCox5 (BC5) | 5' CCT TTA AGA GGN CCT ATT GC 3' | Forward | NHM – current project |
| BulCox6 (BC6) | 5' CAA TAA ACC CTA AAA TYC C 3' | Reverse | NHM – current project |
| BulCox7 (BC7) | 5' GCA ATA GGT CCT CTT AAA GG 3' | Reverse | NHM – current project |
| BulCox8 (BC8) | 5' GTA ATA AAA TTA ATW GCA CCT AAA A 3' | Reverse | NHM – current project |
| BulCox9 (BC9) | 5' CCW CCT TCA TTT ATT TT 3' | Forward | NHM – current project |
| BulCox10 (BC10) | 5' GCT AAA TGT AAA G 3' | Reverse | NHM – current project |
| BulCox11 (BC11) | 5' TTT TGG DRT YTG RTG YGG 3' | Forward | NHM – current project |
| BulCox12 (BC12) | 5' GCG TTG ACT CTT TTC AAC 3' | Forward | NHM – current project |
| BulCox13 (BC13) | 5' CWT TRT AYW TAA TTT TTG G 3' | Forward | NHM – current project |
| BulCox14 (BC14) | 5' GGA AAT CAG TAM AYA AAA CCA GC 3' | Reverse | NHM – current project |
| BulAsmit3 (BAT3) | 5' CAT AAT GAA AAT GAG CAA CTA C 3' | Reverse | NHM – current project |
| BulAsmit4 (BAT4) | 5' CAT AAT GAA AAT GAG C 3' | Reverse | NHM – current project |
| Primer name | Second internal transcribed spacer of the ribosomal gene complex – primer sequence | Forward or Reverse | Source |
| ETTS1 | 5' TGC TTA AGT TCA GCG GGT 3' | Reverse | [27] |
| ETTS10 | 5' GCA TAC TGC TTT GAA CAT CG 3' | Forward | [27] |
Figure 2.
Locations of primers used for the cox1 fragment. Locations of primers used for cox1 PCR amplification and sequencing. Folmer and Asmit regions are indicated. Not to scale.
Phylogenetic analysis of sequence data
Following basic editing and analysis of compiled cox1 and its2 sequences on Sequencher 4.6, the sequences were used to perform BLAST searches [14] via the National Center for Biotechnology Information against GenBank and EMBL sequence databases in order to ensure that parasitic and other potential contaminant sequences had not been obtained in error. Sequences were then aligned and analysed using MEGA 3.1 [15] where alignment was undertaken using Clustal W [16]. The cox1 data for all taxa were analysed solely as nucleotides and subject to analysis by both Neighbour-Joining and Minimum Evolution methods using Kimura's 2 parameter model (K2P) for pair-wise distance calculations as this accommodates the difference in the rate of accumulation between transitions and transversions. The Minimum Evolution algorithm employed Close-Neighbour-Interchange (CNI – level 1) to explore the most optimal topology with the initial, temporary tree obtained by Neighbour-Joining. All gaps were deleted from the dataset using the 'complete deletion' option in MEGA 3.1 and the invertebrate mitochondrial code was used throughout. Nucleotide sequence data for its2 was analysed in a similar manner except that p-distance was employed instead of K2P.
The different forms of analysis were subject to bootstrapping (1000 repeats) as a means of testing the reliability of individual branches within the generated tree. Biomphalaria glabrata was used as an outgroup taxon upon which to root the structures. Sequence saturation for cox1 was visualized graphically, using the program DAMBE [17] that allows the number of differences between isolates or species in terms of transitional and transversional substitutions to be plotted against pair-wise distance values.
Sequences have been submitted to the EMBL database and have accession numbers [EMBL:AM286284 to AM286318, EMBL:AM921806 to AM921851 (cox1) and EMBL:AM921961 to AM921990 (its2)].
Results
Analysis of its2 sequence data
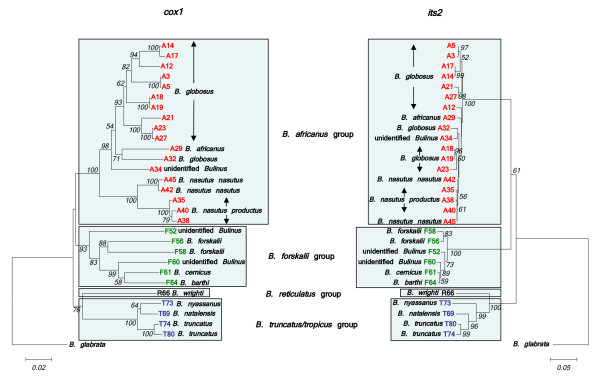
Twenty nine samples were selected for sequencing of an amplicon containing the 3' end of the 5.8S gene and the entire its2 region. This was undertaken in order to compare the phylogenetic signal of a nuclear marker with that of cox1 (see Fig. 3). Both loci were able to discriminate the 4 species groups in a Neighbour-Joining tree. The B. forskalii, B. reticulatus and B. truncatus/tropicus species groups resolved well, the main point of difference being F52 which in the its2 tree had closer affinity with the East African B. forskalii group snails. The B. africanus group within the its2 tree had short branch lengths with poor resolution and bootstrap values. Clear discrimination between B. nasutus nasutus and B. nasutus productus was not possible using the its2 data and sequence differences in this region are unlikely to be of value for the detection of hybridization events among isolates with overlapping geographic ranges. The its2 sequence data for B. wrighti were unusual in having two unique insertions relative to other Bulinus isolates, a short 16 bp insertion between fragment positions 219 and 234 and a larger 63 bp insertion between positions 248 and 310.
Figure 3.
Comparison of cox1 and its2 Neighbour-Joining trees for Bulinus. Comparison of Neighbour-Joining trees for cox1 and its2 data (cox1 – 1010 sites and its2 – 394 sites). Kimura 2-parameter distance has been used for cox1 and p-distance for its2. Substitutions include both transitions and transversions and 1000 bootstrap replicates have been performed. Bootstrap values below 50 are not shown. B. africanus group isolates are shown in red, B. forskalii in green, B. reticulatus in black and B. truncatus/tropicus in blue. See Table 1 for origins of isolates.
Analysis of cox1 sequence data
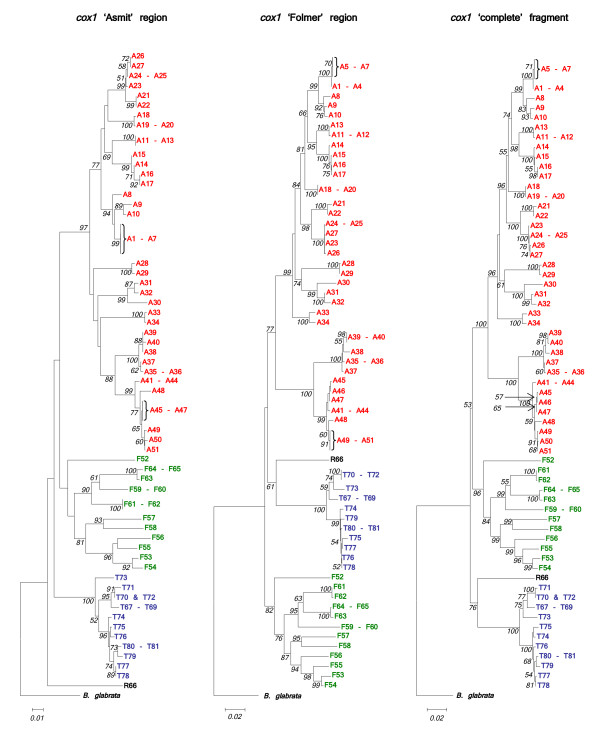
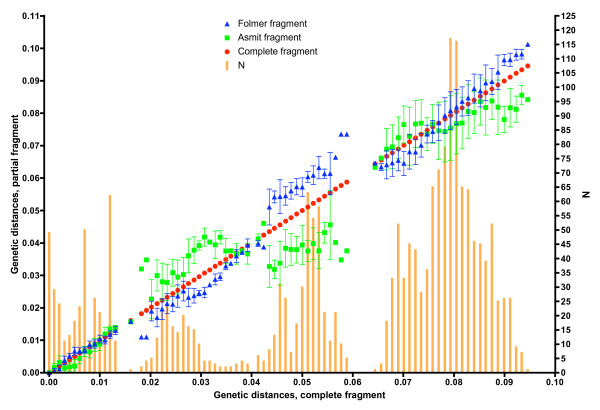
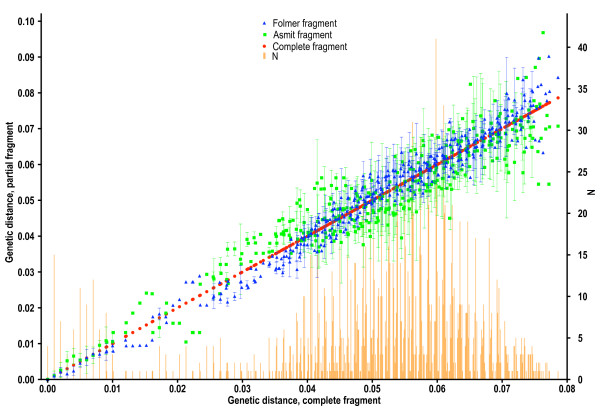
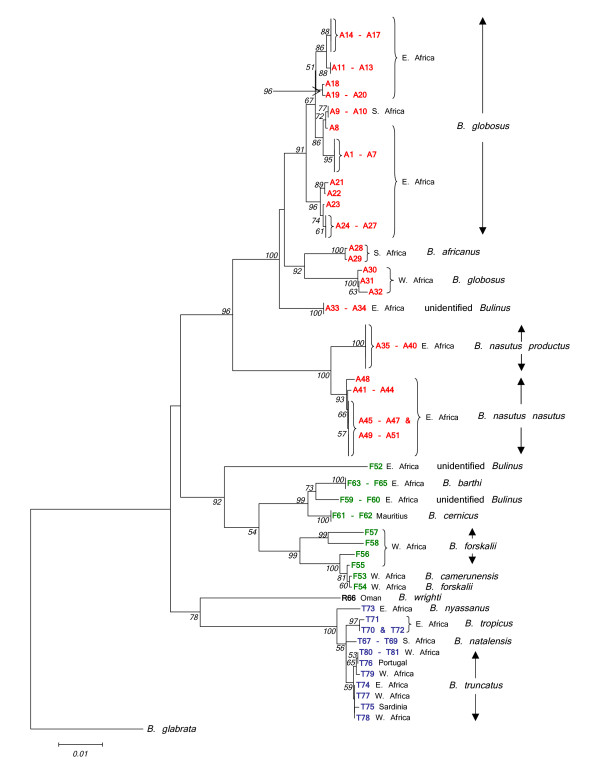
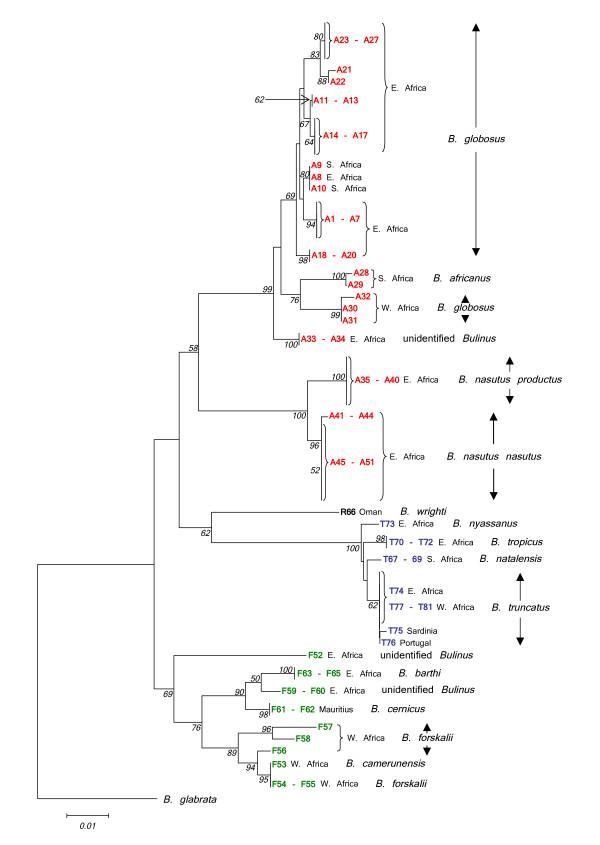
The sequence of the mitochondrial cox1 gene within Bulinus was found to be highly variable. The nucleotide composition regarding this genus was AT rich (69.4%) which is in close agreement with previous work [12]. In order to test which areas of the cox1 amplicon gave the best phylogenetic signal, the fragment was analysed in its entirety, using the first 644 bp and also the final 387 bp. Stothard and Rollinson [9] and Jones et al [12] used the latter section of the cox1 sequence and this corresponds to the region encompassed by primers Asmit1 (AT1) and Asmit2 (AT2) shown in Fig. 2. The first 644 bp covers an area comparable to the sequence bounded by the Folmer primers LCO1490 (CO1) and HCO2198 (CO2) [18] and which has been used previously for barcoding studies [19]. Figure 4 shows three Neighbour-Joining trees generated for each region using both transitional and transversional substitutions. Resolution of the tree improves as progressively longer stretches of sequence are included in the analysis. However, saturation analysis of the 'Asmit' and 'Folmer' regions show that both are subject to saturation of transitional events suggesting that inclusion of transversional substitutions only in the calculation would present a more accurate estimate of isolate relationships within the genus. Figure 5 shows a graph where mean, pair-wise genetic distances of the two areas calculated from transversional substitutions only are compared with the corresponding distance matrix co-ordinates for the complete fragment. In this manner, the variability of genetic distance figures for the 'Asmit' and 'Folmer' regions relative to the complete fragment may be shown. For small genetic distance values correspondence is good between the three regions, however, as distances increase in size those associated with the 'Asmit' fragment tend to drift away from the corresponding complete sequence derived genetic distance values within the mid-range of the 'x' axis. Distances of the 'Folmer' region also exhibit a degree of variation when compared with those of the complete fragment but to a smaller extent. Additionally, a short span of genetic distance values between approximately 0.058 and 0.064 is entirely missing within the dataset. To a lesser degree this is reflected in a smaller region between 0.013 and 0.018. Figure 6 shows the same procedure undertaken for transitional substitutions where correspondence of distance values for the 'Asmit' and 'Folmer' areas again 'drifts' with increasing genetic distance relative to the complete fragment. However, whilst the overall number of pairs contributing to each distance figure is considerably less than in Fig. 5, the numerical variation of distance values present in the matrices is far greater, particularly between the ranges 0.035 to 0.077. Neighbour-Joining and Minimum Evolution trees were therefore generated for the dataset using transversions from the complete fragment sequence in order to obtain the maximum resolution possible. The resultant trees contained divisions corresponding to the four species groups (see Figs 7 &8).
Figure 4.
Three regions of the cox1 fragment compared using Neighbour-Joining trees. Comparison of Neighbour-Joining trees using Kimura 2-parameter distance for 'Asmit' (final 387 sites), 'Folmer' (first 644 sites) and 'complete' (1009 sites) sections of the cox1 gene. Substitutions include both transitions and transversions and 1000 bootstrap replicates have been performed. Bootstrap values below 50 are not shown. B. africanus group isolates are shown in red, B. forskalii in green, B. reticulatus in black and B. truncatus/tropicus in blue. See Table 1 for origins of isolates.
Figure 5.
Comparison of regional cox1 genetic distances using transversions only. Plot showing mean, pair-wise genetic distance values of the 'Asmit' and 'Folmer' regions using transversions only as compared with the corresponding values for the complete fragment. Number of pairs contributing to each value is shown graphically.
Figure 6.
Comparison of regional cox1 genetic distances using transitions only. Plot showing mean, pair-wise genetic distance values of the 'Asmit' and 'Folmer' regions using transitions only as compared with the corresponding values for the complete fragment. Number of pairs contributing to each value is shown graphically.
Figure 7.
Neighbour-Joining tree for Bulinus isolates using the complete cox1 fragment, transversions only. Neighbour-Joining tree for the complete cox1 fragment (1009 sites) using Kimura 2-parameter distance and utilizing transversional substitutions only. 1000 bootstrap replicates have been performed. Bootstrap values below 50 are not shown. B. africanus group isolates are shown in red, B. forskalii in green, B. reticulatus in black and B. truncatus/tropicus in blue. See Table 1 for origins of isolates.
Figure 8.
Minimum Evolution tree for Bulinus isolates using the complete cox1 fragment, transversions only. Minimum Evolution tree for the complete cox1 fragment (1009 sites) using Kimura 2-parameter distance and utilizing transversional substitutions only. 1000 bootstrap replicates have been performed. Bootstrap values below 50 are not shown. B. africanus group isolates are shown in red, B. forskalii in green, B. reticulatus in black and B. truncatus/tropicus in blue. See Table 1 for origins of isolates.
Discussion
B. africanus species group
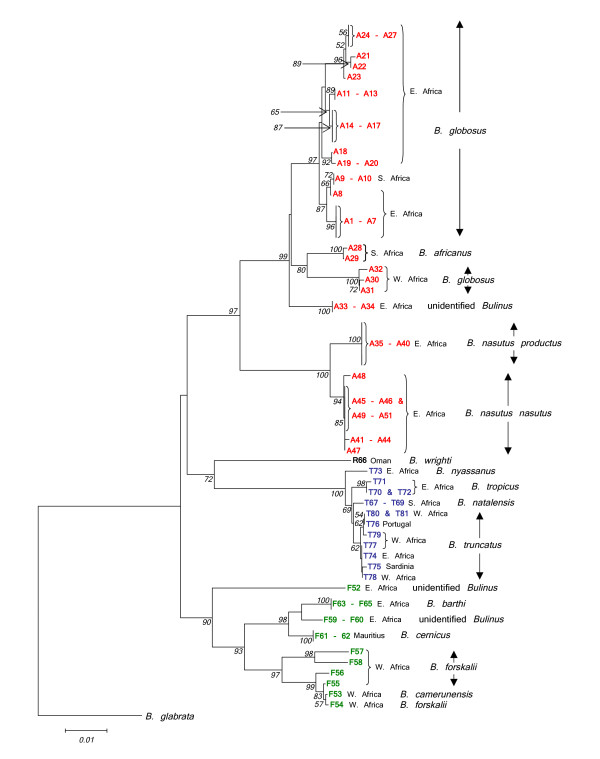
Classification within this complex is probably the most difficult of the four Bulinus snail species groups. The cox1 sequence data for samples within this group revealed an extensive degree of genetic variation throughout the continent (see the designation 'A' in Figs 7 &8). There are three areas within the data set that may be used as reference points for interpretation of Figs 7 &8. The first is identified by sample code A23, a snail from Kinyasini, Unguja, which on the basis of previous work [8,9,20], represents the species known as B. globosus. The second are samples of B. africanus, from South Africa, namely, A28 and A29 and the third are those specimens labelled A35 to A40 and A41 to A51 representing B. nasutus productus and B. nasutus nasutus, respectively. The split of B. nasutus into two subspecies as recognised previously [2] may be clearly seen in Figs 7 &8 with B. nasutus productus being represented by samples from inland sites in Uganda and Tanzania and B. nasutus nasutus present in coastal Kenya and the Islands of Unguja, Pemba and Mafia. The molecular data support the view that these forms are closely related species and it would seem acceptable to consider them as B. productus and B. nasutus.
One of the most interesting facts to emerge is the division between samples of B. globosus from West and East Africa and the rather surprising finding that B. africanus has closer affinities to the West African B. globosus samples. B. globosus has the greatest geographical range of any member of this species group and it does seem that greater attention must be given to specific status and distribution. The cox1 barcode for B. africanus may be helpful in discriminating snails where species overlap especially when morphological differences are often difficult to determine, hence samples A9 and A10 identified as B. globosus can be distinguished from A28 and A29, B. africanus. The two species differ in the penis sheath, which is bigger in B. africanus being longer and/or thicker than the preputium [2] but such characters have been found unreliable for species discrimination [10].
Kenyan specimens from the Kisumu region used by Raahauge and Kristensen [10] have been included in the present study (A11 to A13 & A33). Utilizing RAPD profiles and PCR-RFLP results, these authors concluded that those samples labelled in Figs 7 &8 as A11 to A13 all appeared to be local variants of the same species and this conclusion is confirmed in the present analysis with all of the snails identified as B. globosus. In addition, they also showed that another sample screened in their study (ADC farm, Kisumu), labelled in Figs 7 &8 as A33, was different from the other Kisumu specimens and this has also been supported.
B. forskalii species group
The group as a whole splits into two main sections, namely, snails from West Africa i.e. Cameroon, Bukina Faso, Niger, Senegal, São Tomé and Angola (F53 to F58) and those from the eastern side, East Kenya, Pemba, Mafia and Mauritius (F59 to 65). Additionally, isolate F52 from Uganda although sharing a common ancestor with East and West African B. forskalii group isolates, is quite distinct from the other species. However, only one specimen has been examined and more samples from this locality in Uganda are required for further study. The its2 tree showed F52 to have a closer relationship with East African members of the B. forskalii group. Within this group certain isolates are of known species and can be used as reference points, namely F58, which is B. forskalii, F61 and F62 both being B. cernicus from Mauritius and F63 to F65 from Pemba and Mafia considered by the authors as B. barthi.
Fewer isolates of the B. forskalii group have been tested and analysed as compared with the B. africanus group and so it might be imprudent to draw too many specific conclusions from the data. However, using fifteen allozyme loci from B. camerunensis, B. forskalii and B. senegalensis, Mimpfoundi & Greer [6] could find no differences between the two former species and suggested that the validity of B. camerunensis as a separate species might be open to question. Jones et al [12] used ITS1, RAPDs and cox1 to show that B. camerunensis clustered unequivocally with B. forskalii confirming that the taxonomic position of B. camerunensis is debatable. Only a single example of this species was available for our analysis (F53) although it came from the same area as that examined in Mimpfoundi's paper, namely, Lake Barombi, Kotto. The isolate shared genetic characteristics with B. forskalii from other West African countries such as Burkina Faso (F54) and Niger (F55), re-emphasising its questionable taxonomic status.
Bulinus forskalii from the island of São Tomé (F57) is responsible for the transmission of S. guiniensis and in this analysis grouped most closely to B. forskalii (F58) from Angola with both being well differentiated from other West African B. forskalii. Brown [21] was of the opinion that it was appropriate to identify the snails from São Tomé as extreme conchological variants of B. forskalii. Interestingly, in the analysis of Jones et al [12]B. forskalii from São Tomé clustered with B. crystallinus also from Angola. There is a need to sample and characterize more thoroughly B. forskalii group snails from Angola to assess their relationship with snails from São Tomé and West Africa as it appears that there may be more than one species involved.
B. cernicus from the island of Mauritius was once regarded as a form of B. forskalii, however, significant morphological differences with the latter were noted [2]. The current data reinforces the view that B. cernicus should be considered a separate species from both B. forskalii and B. barthi. Isolates F59 and F60 are also distinct from B. forskalii, B. barthi and B. cernicus. Stothard et al [22] sequenced the short 'Asmit' region for a snail collected from Mafia Island (SF369612). Although covering only a third of the current sequence for F59 and F60 the corresponding data match exactly and imply that this particular un-named Bulinus species is present in Pemba, Mafia and also East Kenya.
B. truncatus/tropicus species group
Both Figs 7 and 8 confirm the position of B. nyassanus in the B. truncatus/tropicus complex and this species together with the cluster comprising B. tropicus, B. natalensis and B. truncatus appear to derive from a common ancestor. However, the conjecture by Nascetti & Bullini [5] that possible hybridization between B. tropicus and B. natalensis might have given rise to B. truncatus cannot be confirmed by the Minimum Evolution tree (Fig. 8). The observation by Brown [2] that there were indications of a "significant biological difference" between B. tropicus and B. natalensis is supported. The cluster representing B. truncatus in Figs 7 &8 has very short branch lengths implying that the hybridization event which Goldman et al. [3] suggested gave rise to this tetraploid is a relatively recent phenomenon.
B. reticulatus group
There are only two recognised species within this group and it has only been possible to examine one of them, B. wrighti. This species has a characteristic cox1 sequence which positions the group close to the B. truncatus/tropicus complex.
Barcoding
The sequence information presented here is not a typical 'barcode' in so far as the sequence is longer than most barcodes which are usually around 650 bp in length [19,23,24]. Moreover, the generated PCR fragments have been amplified and sequenced using a wide variety of different primers due to the highly variable nature of the sequence. A pan-species group/isolate barcode in the usual 'sense' might be possible to locate but requires a common set of primers to be designed which will amplify all species within the genus for a particular cox1 region and that the area so determined mirrors the results generated by the current longer sequence. For this reason, a Neighbour-Joining tree (Fig. 9) has been generated for the area of Bulinus cox1 which corresponds approximately with the 'Folmer' barcode region. Agreement of Fig. 9 with Figs 7 &8 whilst not identical is very close and provides hope that this region could be used for barcoding Bulinus species in future.
Figure 9.
Neighbour-Joining tree for Bulinus isolates using the 'Folmer' cox1 fragment, transversions only. Neighbour-Joining tree using transversional substitutions only for the cox1 'Folmer' region. Calculation parameters are the same as for Figure 7. This region is proposed for potential use as a barcode. Bootstrap values below 50 are not shown. B. africanus group isolates are shown in red, B. forskalii in green, B. reticulatus in black and B. truncatus/tropicus in blue. See Table 1 for origins of isolates.
The advantages [19] and disadvantages [25] over the use of barcoding, and the utilization of a single mitochondrial gene such as cox1 for identification and phylogenetic purposes have been the subject of considerable debate. It is accepted that a range of both nuclear and mitochondrial markers are required to provide a more accurate estimate of evolutionary history. However, a technique for routine screening which is relatively quick, cost effective and reproducible is essential given that resources are limited. The selected area of sequence from the cox1 gene appears to achieve this by forming a framework upon which a classification can begin to be constructed. Previous studies have used cox1 in the phylogenetic evaluation of Bulinus, namely, Stothard & Rollinson [9], Stothard et al. [11] and Jones et al. [12] and, in this respect, the current project is not unique, however, the sequences used in the present paper are three times the length of those previously employed and the range of Bulinus isolates/species much more extensive. The study is ongoing and undoubtedly as more taxa are acquired and sequences added to the database, the shape of the Neighbour-Joining and Minimum Evolution trees as shown in Figs 7 &8 will progressively alter and become more informative.
Competing interests
The authors declare that they have no competing interests.
Authors' contributions
RAK carried out the molecular work including nucleic acid extractions, PCRs, sequencing, sequence alignments, phylogenetic analysis and writing of the paper.
JRS collected material, analysed transitional saturation affects and compared transitional and transversional genetic distances with respect to different regions of the cox1 gene. He also aided in drafting the manuscript.
AME undertook some of the sequencing and produced Figures 5 and 6 following on from the work of JRS. He also helped draft the manuscript.
DR collected material, conceived the study, participated in its design and helped draft the manuscript.
All authors read and approved the final manuscript.
Supplementary Material
cox1 PCR fragments generated for sequencing and successful primers employed in both processes.
Acknowledgments
Acknowledgements
The work was funded in part by the EU contract no: 032203 (A multidisciplinary alliance to optimize schistosomiasis control and transmission surveillance in sub-Saharan Africa).
The authors wish to thank the following for samples used in this work; Professor C. Appleton, University of Kwa-Zulu, Natal, Professor M.A. Gracio, Instituto de Higiene e Medicina Tropical, Lisbon, Dr E. Michel, Natural History Museum, London, Dr T.K. Kristensen, Institute for Health Research and Development, Copenhagen, Dr S. Walker, Queen's University of Belfast, Professor K de Kock, North-West University, South Africa, Professor Marco Curini Galletti, Università di Sassari, Sardinia and Dr D.T.J Littlewood, Natural History Museum, London. We are grateful to our colleagues Michael Anderson for the provision of snail cultures and to Julia Llewellyn-Hughes for operation of the Applied Biosystems 3730 DNA Analyser.
Contributor Information
Richard A Kane, Email: rak@nhm.ac.uk.
J Russell Stothard, Email: russ@nhm.ac.uk.
Aidan M Emery, Email: aide@nhm.ac.uk.
David Rollinson, Email: dr@nhm.ac.uk.
References
- Rollinson D, Stothard JR, Southgate VR. Interactions between intermediate snail hosts of the genus Bulinus and schistosomes of the Schistosoma haematobium group. Parasitol. 2001;123:S245–S260. doi: 10.1017/S0031182001008046. [DOI] [PubMed] [Google Scholar]
- Brown DS. Freshwater Snails of Africa and their Medical Importance. Taylor & Francis. 1994.
- Goldman MA, LoVerde PT, Chrisman CL. Hybrid origin of polyploidy in freshwater snails of the genus Bulinus (Mollusca: Planorbidae) Evolution. 1983;37:592–600. doi: 10.2307/2408272. [DOI] [PubMed] [Google Scholar]
- Rollinson D, Southgate VR. Enzyme analysis of Bulinus africanus group snails (Mollusca: Planorbidae) from Tanzania. Trans R Soc Trop Med Hyg. 1979;73:667–672. doi: 10.1016/0035-9203(79)90017-8. [DOI] [PubMed] [Google Scholar]
- Nascetti G, Bullini L. Genetic differentiation in the Mandahlbarthia truncata complex (Gastropoda: Planorbidae) Parassitologia. 1980;22:269–274. [PubMed] [Google Scholar]
- Mimpfoundi R, Greer J. Allozyme comparisons among species of the Bulinus forskalii group (Gastropoda: Planorbidae) in Cameroon. J Moll Stud. 1989;55:405–410. doi: 10.1093/mollus/55.3.405. [DOI] [Google Scholar]
- Stothard JR, Hughes S, Rollinson D. Variation within the internal transcribed spacer (ITS) of ribosomal DNA genes of intermediate snail hosts within the genus Bulinus (Gastropoda: Planorbidae) Acta Trop. 1996;61:19–29. doi: 10.1016/0001-706X(95)00137-4. [DOI] [PubMed] [Google Scholar]
- Stothard JR, Mgeni AF, Alawi KS, Savioli L, Rollinson D. Observations on shell morphology, enzymes and random amplified polymorphic DNA (RAPD) in Bulinus africanus group snails (Gastropoda: Planorbidae) in Zanzibar. J Moll Stud. 1997;63:489–503. doi: 10.1093/mollus/63.4.489. [DOI] [Google Scholar]
- Stothard JR, Rollinson D. Partial DNA sequences from the mitochondrial cytochrome oxidase subunit I (COI) gene can differentiate the intermediate snail hosts Bulinus globosus and B. nasutus (Gastropoda: Planorbidae) J Nat Hist. 1997;31:727–737. doi: 10.1080/00222939700770361. [DOI] [Google Scholar]
- Raahauge P, Kristensen TK. A comparison of Bulinus africanus group species (Planorbidae; Gastropoda) by use of the internal transcribed spacer 1 region combined by morphological and anatomical characters. Acta Trop. 2000;75:85–94. doi: 10.1016/S0001-706X(99)00086-8. [DOI] [PubMed] [Google Scholar]
- Stothard JR, Brémond P, Andriamaro L, Sellin B, Sellin E, Rollinson D. Bulinus species on Madagascar: molecular evolution, genetic markers and compatibility with Schistosoma haematobium. Parasitol. 2001;123:S261–S275. doi: 10.1017/S003118200100806X. [DOI] [PubMed] [Google Scholar]
- Jones CS, Rollinson D, Mimpfoundi J, Ouma J, Kariuki HC, Noble LR. Molecular evolution of freshwater snail intermediate hosts within the Bulinus forskalii group. Parasitol. 2001;123:S277–S292. doi: 10.1017/S0031182001008381. [DOI] [PubMed] [Google Scholar]
- Jorgensen A, Jorgensen LVG, Kristensen TK, Madsen H, Stothard JR. Molecular phylogenetic investigations of Bulinus (Gastropoda: Planorbidae) in Lake Malawi with comments on the topological incongruence between DNA loci. Zoologica Scripta. 2007;36:577–585. doi: 10.1111/j.1463-6409.2007.00298.x. [DOI] [Google Scholar]
- Altschul SF, Gish W, Miller W, Myers EW, Lipman DJ. Basic local alignment search tool. J Mol Biol. 1990;215:403–410. doi: 10.1016/S0022-2836(05)80360-2. [DOI] [PubMed] [Google Scholar]
- Kumar S, Tamura K, Nei M. MEGA3: Integrated Software for Molecular Evolutionary Genetics Analysis and Sequence Alignment. Brief Bioinform. 2004;5:150–163. doi: 10.1093/bib/5.2.150. [DOI] [PubMed] [Google Scholar]
- Thompson JD, Higgins DG, Gibson T. CLUSTAL W: improving the sensitivity of progressive multiple sequence alignment through sequence weighting, position-specific gap penalties and weight matrix choice. Nucleic Acids Res. 1994;22:4673–80. doi: 10.1093/nar/22.22.4673. [DOI] [PMC free article] [PubMed] [Google Scholar]
- Xia X, Xie Z. DAMBE: Software package for data analysis in molecular biology and evolution. J Hered. 2001;92:371–373. doi: 10.1093/jhered/92.4.371. [DOI] [PubMed] [Google Scholar]
- Folmer O, Black M, Hoeh W, Lutz R, Vrijenhoek R. DNA primers for amplification of mitochondrial cytochrome c oxidase subunit I from diverse metazoan invertebrates. Mol Mar Biol Biotechnol. 1994;3:294–299. [PubMed] [Google Scholar]
- Hebert PDN, Cywinska A, Ball SL, deWaard JR. Biological identifications through DNA barcodes. Proc Biol Sci. 2003;270:313–321. doi: 10.1098/rspb.2002.2218. [DOI] [PMC free article] [PubMed] [Google Scholar]
- Stothard JR, Mgeni AF, Khamis S, Seto E, Ramsan M, Rollinson D. Urinary schistosomiasis in schoolchildren on Zanzibar Island (Unguja), Tanzania: a parasitological survey supplemented with questionnaires. Trans R Soc Trop Med Hyg. 2002;96:507–514. doi: 10.1016/S0035-9203(02)90421-9. [DOI] [PubMed] [Google Scholar]
- Brown DS. Freshwater snails of São Tomé, with special reference to Bulinus forskalii (Ehrenberg), host of Schistosoma intercalatum. Hydrobiologia. 1991;209:141–153. [Google Scholar]
- Stothard JR, Loxton JL, Rollinson D. Freshwater snails on Mafia Island, Tanzania with special emphasis upon the genus Bulinus (Gastropoda: Planorbidae) J Zool Lond. 2002;257:353–364. doi: 10.1017/S095283690200095X. [DOI] [Google Scholar]
- Hebert PDN, Penton EH, Burns JM, Janzen DH, Hallwachs W. Ten species in one: DNA barcoding reveals cryptic species in the neotropical skipper butterfly Astraptes fulgerator. Proc Natl Acad Sci U S A. 2004;101:14812–14817. doi: 10.1073/pnas.0406166101. [DOI] [PMC free article] [PubMed] [Google Scholar]
- Hebert PDN, Stoeckle MY, Zemlak TS, Francis CM. Identification of birds through DNA barcodes. PLoS Biol. 2004;2:e312. doi: 10.1371/journal.pbio.0020312. [DOI] [PMC free article] [PubMed] [Google Scholar]
- Ballard JWO, Whitlock MC. The incomplete natural history of mitochondria. Mol Ecol. 2004;13:729–744. doi: 10.1046/j.1365-294X.2003.02063.x. [DOI] [PubMed] [Google Scholar]
- Bowles J, Blair D, McManus DP. Genetic variants within the genus Echinococcus identified by mitochondrial DNA sequencing. Mol Biochem Parasitol. 1992;54:165–174. doi: 10.1016/0166-6851(92)90109-W. [DOI] [PubMed] [Google Scholar]
- Kane RA, Rollinson D. Repetitive sequences in the ribosomal DNA internal transcribed spacer of Schistosoma haematobium, Schistosoma intercalatum and Schistosoma mattheei. Mol Biochem Parasitol. 1994;63:153–156. doi: 10.1016/0166-6851(94)90018-3. [DOI] [PubMed] [Google Scholar]
Associated Data
This section collects any data citations, data availability statements, or supplementary materials included in this article.
Supplementary Materials
cox1 PCR fragments generated for sequencing and successful primers employed in both processes.


