

Abstract
The hepatitis E virus causes acute viral hepatitis endemic in much of the developing world and is a serious public health problem. However, due to the lack of an in vitro culture system or a small animal model, its biology and pathogenesis are poorly understood. We have shown earlier that the ORF3 protein (pORF3) of hepatitis E virus activates ERK, a member of the MAPK superfamily. Here we have explored the mechanism of pORF3-mediated ERK activation and demonstrated it to be independent of the Raf/MEK pathway. Using biochemical assays, yeast two-hybrid analysis, and intracellular fluorescence resonance energy transfer we showed that pORF3 binds Pyst1, a prototypic member of the ERK-specific MAPK phosphatase. The binding regions in the two proteins were mapped to the N terminus of pORF3 and a central portion of Pyst1. Expression of pORF3 protected ERK from the inhibitory effects of ectopically expressed Pyst1. This is the first example of a viral protein regulating ERK activation by inhibition of its cognate dual specificity phosphatase.
Hepatitis E virus (HEV),1 the causative agent of hepatitis E, is a waterborne pathogen that is endemic to resource-poor regions of the world (1-4). It is estimated that about 3 billion people live in areas of HEV endemicity. In parts of Asia, Africa, and Latin America, HEV infections comprise about one-third of all sporadic hepatitis and almost all of epidemic hepatitis (4, 5). Although the infection is largely self-limited, severe clinical outcomes have been reported in pregnant women with mortality rates as high as 20–30% (6, 7). In endemic areas, the infection has also been shown to be a significant cause of fulminant liver failure, an acute and rapidly progressing form of liver disease with high rates of mortality (8, 9). Fundamental studies on the biology of HEV have suffered due to the lack of a reliable in vitro culture system or small animal models of infection. We have used subgenomic expression strategies to study the properties and functions of individual HEV gene products toward understanding their role in viral replication and pathogenesis (10-12).
The genome of HEV is a ∼7.2-kb polyadenylated, positive sense RNA that contains three open reading frames (ORFs), designated ORF1, ORF2, and ORF3 (13). Open reading frame 1 encodes the viral nonstructural protein of 1693 amino acids (∼185 kDa) that contains domains shown to be associated with methyltransferases, papain-like cysteine proteases, RNA helicases, and RNA-dependent RNA polymerases (14). While it is not clear whether the HEV polyprotein is processed into functional units, biochemical activities associated with the methyltransferase and RNA-dependent RNA polymerase domains have been demonstrated (15, 16). The ORF2 codes for the HEV capsid protein and has been expressed using various in vitro systems. In animal cells, it expresses an ∼74–88-kDa protein that carries N-linked glycosylation and localizes intracellularly as well as on the cell surface (10, 12). In Tn5 insect cells, the ORF2 expresses a protein of ∼52 kDa that assembles into virus-like particles (17). The ORF2 protein is also being explored as a potential vaccine against hepatitis E (18, 19).
Open reading frame 3 encodes a protein of ∼13.5 kDa (called pORF3) with unassigned function. We have shown earlier that pORF3 is phosphorylated by MAPK at a single serine residue (Ser-80) and that it associates with the cytoskeletal and membrane fractions in expressing cells (11). Recently we demonstrated the interaction between a C-terminal proline-rich domain in pORF3 and Src homology 3 (SH3) domains in some cellular proteins involved in signal transduction (20). These include members of the Src family of protein-tyrosine kinases (Src, Hck, and Fyn), the p85α regulatory subunit of phosphatidylinositol 3-kinase (PI3K), phospholipase C γ, and the adaptor protein Grb2 (20). Furthermore transient or stable expression of ORF3 in cell lines led to increased activity and nuclear translocation of extracellular signal-regulated kinase (ERK) (20). However, the mechanism(s) of ERK activation by pORF3 has not been elucidated.
The MAPK cascade is a major signaling pathway involved in the regulation of cell proliferation, differentiation, stress responses, and apoptosis (21-23). In mammalian cells, this pathway has three distinct components: the ERK pathway, the stress-activated protein kinase or c-Jun N-terminal kinase (SAPK/JNK) pathway, and the p38 kinase pathway (23). While the ERK pathway is involved in cell proliferation and differentiation (21), the SAPK/JNK and p38 pathways are involved in the cellular response to cytokines or environmental stress (22). These conserved cascades consist of a three-kinase module that includes a MAPK, which is activated by a MAPK/ERK kinase (MEK), which in turn is activated by a MEK kinase (23). Following phosphorylation and activation in response to mitogenic or stress signals, the MAPK is translocated to the nucleus (23) where it phosphorylates transcription factors leading to modulation of gene expression.
A family of dual specificity MAPK phosphatases (MKPs) negatively regulates the MAPKs through dephosphorylation of threonine and tyrosine residues within the TXY activation motif (24). At least 10 different MKPs have been identified in mammalian systems, implying a complex regulatory role of these enzymes in the MAPK signaling pathway (24, 25). Based on their substrate specificity, MAPK-docking sites, subcellular localization, tissue-specific expression, and regulation by various stimuli, the MKPs are classified into three families (24-26). These include the MKP-1/CL100-like phosphatases that are found in the nucleus and show increased specificity toward JNK/SAPK and p38 MAPKs (27), the MKP-3/Pyst1-like cytoplasmic phosphatases that are highly specific for ERK (28, 29), and a new group containing MKP-5 and MKP-7 that are cytoplasmic and highly specific for JNK/SAPK and p38 MAPKs (30). These phosphatases must be precisely regulated to avoid unexpected inactivation of MAPKs. Cross-talk between upstream regulators of the MAPK pathways and the MKPs is highly regulated both spatially and temporally in different cells in response to various stimuli.
The molecular mechanisms involved in pORF3-mediated ERK activation have not been characterized. In an attempt to show interactions between pORF3 and Pyst-1, a prototypic member of the MKP-3 class of cytoplasmic MAPK phosphatases, we used in vitro as well as in vivo assays. Immunoprecipitation and pull-down assays showing the interaction of these two proteins were further confirmed by yeast two-hybrid analysis and by fluorescence resonance energy transfer (FRET) imaging microscopy using variant enhanced green fluorescent protein (EGFP) fusions. Our results demonstrate that pORF3 interacts with MKP-3 and that this interaction is responsible for pORF3-mediated ERK activation. This is a novel mechanism through which a viral protein regulates the cellular ERK pathway.
EXPERIMENTAL PROCEDURES
Plasmids, Cell Lines, and Antibodies
The expression vectors for full-length and mutant forms of the ORF3 proteins have been described earlier (11). The expression vectors pSG-HA-CL100 and pSG-HA-Pyst1 were provided by Dr. Steve Keyse (University of Dundee, Dundee, Scotland, UK) and express the hemagglutinin (HA) peptide epitope-tagged versions of the full-length CL100 (MKP-1) and Pyst1 (MKP-3) proteins. The eukaryotic expression vector pSR-HA-ERK was provided by Dr. Eisuke Nishida (Kyoto University, Kyoto, Japan) and expresses HA-tagged ERK. The expression vectors for glutathione S-transferase (GST)-fused full-length and mutant Pyst1 proteins were generated as follows. The full-length pyst1 gene was PCR-amplified from pSG-HA-Pyst1 using primers 5′-GCCGGATCCATGATAGATACGCTCAGACCCGT-3′ (forward) and 5′-GCCCTCGAGCGTAGATTGCAGAGAGTCCACCT-3′ (reverse). The 1146-bp PCR fragment was digested with BamHI and XhoI and cloned into the same sites in plasmid pGEX4T-1 (Amersham Biosciences). To clone the Pyst1 mutant N670 (amino acids 56–283), plasmid pGEX-Pyst1 was digested with XmaI, and the 670-bp fragment was cloned into the same sites of pGEX4T-1. The C696 mutant (amino acids 150–383) was constructed by digesting pSG-HA-Pyst1 with XbaI, end-filling with the Klenow fragment of DNA polymerase, and further digestion with XhoI to release a 696-bp fragment; this was subsequently cloned into the SmaI and XhoI sites of plasmid pGEX4T-2 (Amersham Biosciences). The C450 mutant (amino acids 229–383) was constructed by digesting pSG-HA-Pyst1 with EcoRI and XhoI and cloning the 450-bp fragment into the same sites in plasmid pGEX5X-1 (Amersham Biosciences). For the C400 mutant (amino acids 150–283), the C696 mutant plasmid was digested with XmaI and XhoI, the smaller (∼300-bp) fragment was removed, and the vector backbone together with partial pyst1 sequence was end-filled and religated. To clone the C300 mutant (amino acids 283–383) containing the catalytic site of Pyst1, plasmid C450 was digested with XmaI and XhoI, and the 300-bp fragment so released was cloned into the same sites in plasmid pGEX4T-3 (Amersham Biosciences). The recombinant GST fusion proteins were expressed in Escherichia coli DH5α according to standard procedures (31). The expression vectors for ORF3 and Pyst1 fused to enhanced cyan fluorescent protein (ECFP) or enhanced yellow fluorescent protein (EYFP) were constructed as follows. The pyst1 gene was isolated from plasmid pSG-HA-Pyst1 as a 1280-bp NheI and XhoI fragment and cloned into the same sites within the polylinker region of either the pECFP-C1 or pEYFP-N1 expression vectors (Clontech). The ORF3 fusions were made by first cloning an EcoRI-AccI fragment from plasmid pSG-ORF3 (10) into the EcoRI and BamHI sites of plasmid pEGFP-N3 (Clontech) by using an AccI-BamHI adaptor at the 3′-end of ORF3. Subsequently a HindIII-BamHI fragment from plasmid pEGFP-N3-ORF3 was end-filled and cloned into the EcoRI site of plasmid pECFP-N1 or pEYFP-N1. The ORF3 and vector control stable cell lines (20) as well as polyclonal antibodies to pORF3 (10) have been described earlier. The ERK1, phospho-ERK, JNK, phospho-JNK, p38, phospho-p38, and anti-HA tag antibodies were from Santa Cruz Biotechnology (Santa Cruz, CA). The Alexa dye-conjugated secondary antibodies were from Molecular Probes (Eugene, OR).
Transfection, Inhibitors, and Lysates
Transient transfections were carried out in COS-1 cells using the Lipofectin reagent (Invitrogen) and the indicated expression vectors. Vector control (pcNeo) and ORF3-expressing (ORF3/4) stable cell lines were seeded at about 50% confluency in 60-mm plates. Prior to inhibitor treatment, the cells were serum-starved for 6 h. One set of cells was then induced with 10% serum for 1 h, while another set was left without serum. For each inhibitor, one plate of pcNeo cells was incubated with the IC50 inhibitory concentration; the ORF3/4 cells were incubated with IC50, 2 × IC50, and 5 × IC50 of the same inhibitor. The IC50 concentrations were as follows: UO126, 100 nm; calphostin C, 50 nm; LY294002, 1.4 μm; TMB-8, 500 nm; Genistein, 150 μm. After a 30-min incubation under serum-free conditions, the medium was adjusted to have a final serum concentration of 10%, and the cells were incubated for an additional 30 min prior to preparation of lysates. All inhibitors were obtained from Sigma.
Immunoprecipitation and Western Blotting
Unless specified otherwise, metabolic labeling of cells and immunoprecipitation were as described earlier (10, 11). For Western blotting, proteins separated by SDS-PAGE were transferred to a nitrocellulose membrane (Hybond ECL, Amersham Biosciences). After blocking with Tris-buffered saline (TBS) containing 5% nonfat milk (Nestlé India Ltd.) for 1–2 h at room temperature, the membrane was washed with TBST (TBS containing 0.1% Tween 20) and incubated overnight at 4 °C with the primary antibody appropriately diluted in TBST containing 5% BSA. The blot was then washed three times for 10 min each with TBST and then incubated with horseradish peroxidase-linked anti-rabbit or anti-mouse IgGs diluted in TBST containing 5% nonfat milk. Chemiluminescent detection of proteins was carried out using the Phototope horseradish peroxidase Western blot detection system (Cell Signaling Technology, Beverly, MA) according to the supplier’s protocol.
In Vitro Translation and GST Pull-down
Coupled in vitro transcription and translation was carried out with the TnT system (Promega Corp., Madison, WI) according to the manufacturer’s guidelines in the presence of [35S]methionine-cysteine (PerkinElmer Life Sciences) to label the synthesized protein(s). For the GST pull-down assay, glutathione-Sepharose beads (Amersham Biosciences) containing about 2 μg of the bait protein were washed once with GST binding buffer (20 mm Tris-HCl, pH 7.9, 500 mm NaCl, 5 mm MgCl2, 0.2 mm EDTA, 1 mm dithiothreitol, 0.1% Nonidet P-40, and a protease inhibitor mixture containing 16 μg/ml benzamidine hydrochloride, 10 μg/ml aprotinin, 10 μg/ml leupeptin, 10 μg/ml pepstatin A, 10 μg/ml o-phenanthroline, and 1 mm phenylmethylsulfonyl fluoride). The washed beads were resuspended in 500 μl of GST binding buffer containing 1 mg/ml BSA and 25 μl of the 35S-labeled in vitro translation mixture and incubated at 4 °C for 60 min with shaking. Subsequently the beads were washed six times using 1 ml of the GST wash buffer (20 mm Tris-HCl, pH 7.9, 1 m NaCl, 5 mm MgCl2, 0.2 mm EDTA, 1 mm dithiothreitol, 0.5% Nonidet P-40, and the protease inhibitor mixture) each time and then boiled in 20 μl of 2× SDS-PAGE sample buffer. Following SDS-PAGE, the gel was subjected to fluorography.
ERK Assays
For the ERK assay using myelin basic protein (MBP) as a substrate, cells were lysed in 500 μl of radioimmunoprecipitation buffer containing 20 mm NaF and 1 mm Na3VO4 and the protease inhibitor mixture on ice for 10–15 min. The lysates were clarified in a microcentrifuge at 13,000 rpm at 4 °C for 15 min followed by sequential incubation with 5 μl of polyclonal anti-ERK1 antibodies for 2 h and 10 μl of protein A-Sepharose (Amersham Biosciences) overnight at 4 °C with rocking. The beads were washed three times with radioimmunoprecipitation buffer and once with kinase buffer (20 mm Tris, pH 7.5, 10 mm MgCl2). Finally each sample was resuspended in 30 μl of kinase buffer containing 20 μm ATP, 0.5 μg of MBP, and 10 μCi of [γ-32P]ATP and incubated at 30 °C for 30 min. The reaction was terminated by the addition of 10 μl of 6× SDS loading buffer and boiling for 5 min, and the samples were resolved by SDS-15% PAGE. The ERK activity was also assayed using Elk-1 as a substrate with a p44/42 kinase assay kit (Cell Signaling Technology) according to the manufacturer’s instructions. The cells were lysed in 500 μl of ice-cold cell lysis buffer containing 1 mm phenylmethylsulfonyl fluoride. After sonication four times for 5 s each, the cell lysate was clarified in a microcentrifuge at 10,000 rpm at 4 °C for 10 min. The lysates were immunoprecipitated overnight at 4 °C with beads carrying immobilized monoclonal anti-phospho-p44/42 kinase antibodies. The pellet was resuspended in 50 μl of kinase buffer supplemented with 200 μm ATP and 2 μg of Elk-1 fusion protein per reaction. Following 30 min of incubation at 30 °C, the reaction was terminated with 25 μl of 3× SDS loading buffer and boiled for 5 min. The samples were subjected to SDS-12% PAGE and Western blotted with polyclonal anti-phospho-Elk-1 antibodies. For Western blotting with anti-ERK antibodies, the cells were lysed directly in 100 μl of radioimmunoprecipitation buffer. After clarification, 50 μl of the lysate were mixed with 10 μl of 6× SDS loading buffer and boiled for 5 min. The samples were subjected to SDS-12% PAGE and Western blotted with either monoclonal anti-phospho-ERK1 or polyclonal anti-ERK1 antibodies at a 1:2000 dilution.
JNK and p38 Assays
The levels of total and phosphorylated JNK and p38 in cell lysates were estimated by Western blotting with specific antibodies as described above. For these assays, control and ORF3 stable lines were also stimulated with 10 μg/ml anisomycin.
Yeast Two-hybrid Analysis
The cloning of ORF3 in the Gal4 DNA-binding domain vector pAS2 has been described earlier (32). The N-terminal deletion mutant ORF3-(33–123) was isolated as an EcoRI-HindIII fragment from plasmid pSGI-ORF3(Δ1–32) (20), end-filled with T4 DNA polymerase, and subcloned into BamHI-digested and end-filled pAS2. The full-length Pyst1 and its deletion mutants were cloned into the Gal4 activation domain vector pACT2 as follows. The full-length pyst1 gene was isolated as an ∼1.5-kb BamHI-XhoI fragment from pGEX4T-1/Pyst1 plasmid and subcloned into the same sites in plasmid pGEX5X; a BamHI-XhoI fragment from this clone was subsequently moved into similarly digested pACT2 to give plasmid pAD-Pyst1. The Pyst1-N670 mutant fragment was isolated as an ∼700-bp BamHI-XhoI fragment from pGEX4T-1/Pyst1(N670) and subcloned into pACT2 using the steps outlined above. The Pyst1-C696 mutant fragment was isolated as an ∼700-bp BamHI-XhoI fragment from pGEX4T-2/Pyst1(C696) and subcloned into pACT2 using the steps outlined above. The Pyst1-C450 mutant fragment was isolated as an ∼500-bp BamHI-XhoI fragment from pGEX5X-1/Pyst1(C450) and subcloned into similarly digested pACT2. The Pyst1-C400 mutant fragment was isolated as an ∼400-bp BamHI-NotI fragment from pGEX4T-2/Pyst-1(C400), end-filled with T4 DNA polymerase, and subcloned into XmaI-digested and end-filled pACT2. The Pyst1-C300 mutant fragment was isolated as an ∼300-bp XmaI-XhoI fragment from pGEX4T-3/Pyst1(C300), end-filled, and subcloned into SmaI-digested pACT2. The yeast two-hybrid analyses were carried out as described earlier (32) except that the Saccharomyces cerevisiae host strain AH109 (MATa, trp1–901, leu2–3, 112, ura3–52, his3–200, gal4Δ, gal80Δ, LYS2::GAL1UAS-GAL1TATA-HIS3, GAL2UAS-GAL2TATA-ADE2, URA3::MEL1UAS-MEL1TATA-lacZ) was utilized instead of the Y190 strain. The positive control included cotransformation with pAS2-SNF1 and pACT2-SNF4 vectors. The negative controls included mock-transformed AH109 cells or cells transformed separately with either pAS2-ORF3 or pACT2-Pyst1.
Microscopy and FRET Analysis
For immunofluorescence staining and colocalization experiments, COS-1 cells were seeded at about 50% confluency on coverslips in 6-well plates, grown for 18 h, and then cotransfected with expression vectors for ORF3 and either Pyst1 or CL100. At 48 h post-transfection, the PBS-washed cells were fixed with 2% paraformaldehyde in PBS at room temperature for 10 min, permeabilized with methanol at −20 °C for 3 min, and then rehydrated with PBS for 20 min at room temperature. The cells were blocked with 5% normal goat serum for 2 h at room temperature and then incubated with polyclonal anti-HA tag antibodies and monoclonal anti-pORF3 antibodies at 1:50 or 1:100 dilutions in PBS, 0.5% Tween 20 (PBST) containing 1% normal goat serum for 2 h at room temperature. Cells were washed thrice with PBST for 5 min each and then incubated for 1 h at room temperature with conjugated secondary antibodies at a 1:1000 dilution. The secondary antibodies used were Alexa594-conjugated goat anti-rabbit IgG and Alexa488-coupled goat anti-mouse IgG (Molecular Probes). The cells were washed as above and mounted in 90% glycerol in PBS. Confocal images were collected using a 60× planapo objective in a Bio-Rad 1024 laser scanning microscope attached to a Nikon inverted microscope. The filter sets used were B2A for Alexa488 and Y-2E/C (Texas Red) for Alexa594.
For FRET analysis, COS-1 cells were plated on coverslips and transfected as described above with expression vectors for the ECFP and EYFP fusion proteins. Forty-eight hours post-transfection, the coverslips were washed with PBS, fixed in 4% paraformaldehyde for 15 min at room temperature, and washed once again in PBS. These were then mounted using Antifade (Bio-Rad) and sealed with a synthetic rubber-based adhesive, Fevibond (Fevicol, Pidilite Industries Ltd.). A planapo 60× numerical aperture/1.4 oil immersion objective (Nikon) with a 2100-radiance unit confocal microscope (Bio-Rad) was used for all experiments. Confocal images were acquired sequentially using the 457 nm (ECFP) and the 514 nm (EYFP) laser lines of the argon laser. Images of the ECFP emission were collected using a 500 DCLPXR dichroic mirror with an HQ 485/30 emission filter. The EYFP emission images were collected using a 560 DCLPXR dichroic mirror with an HQ 545/40 emission filter. FRET was detected using the acceptor photobleaching approach as follows. Cells expressing the ECFP and EYFP fusion proteins were first imaged sequentially followed by specific photobleaching of the acceptor fluorophore (EYFP) by 10–15 min of continuous illumination with the 514 nm laser line at 500-lines/s speed with an 80% laser intensity. At the end of this time, cells were imaged sequentially once again to ensure complete photobleaching of EYFP. Laser Pix 2000 software (Bio-Rad) was used for quantitating the mean fluorescence intensity of ECFP in areas of colocalization before and after photobleaching. Changes in mean fluorescence intensity before and after photobleaching of areas where the two proteins did not colocalize served as a control. The increase in ECFP emission, which is a direct measure of FRET efficiency, was calculated as E% = (1 – (ECFP emission before EYFP photobleach/ECFP emission after EYFP photobleach)) × 100. For presentation, the original images were processed using Photoshop (Adobe Systems, Mountain View, CA).
Binding Competition
The competition between pORF3 and ERK for binding to Pyst1 was evaluated through an in vitro assay. Lysates were prepared from COS-1 cells either mock-transfected (control) or transfected with pSR-HA-Erk. Forty-eight hours post-transfection, the cells on each dish were lysed in 500 μl of lysis buffer containing 20 mm Tris acetate, pH 7.0, 1% Triton X-100, 0.27 m sucrose, 1 mm EDTA, 0.1% 2-mercaptoethanol, 1 mm sodium orthovanadate, 5 mm sodium fluoride, and the protease inhibitor mixture. Following clarification and protein estimation, lysates containing equal amounts of protein (up to 0.4 ml) were used in the competition assay. The pORF3 preparation was either made through coupled in vitro transcription-translation (35S-labeled, TnT system) or was purified from E. coli. Control TnT lysates or BSA was used as negative controls. The COS-1 cell lysates and pORF3 preparations were mixed, kept on ice for 2 h, and then mixed with glutathione-Sepharose beads containing about 5 μg of GST-Pyst1 (or GST alone as a control) bound to the beads. After end-on mixing for 60 min at 4 °C, the beads were processed as described above for GST pull-down. Proteins retained on beads were separated by SDS-12% PAGE and Western blotted with anti-HA tag antibodies to estimate retention of HA-tagged ERK. The pORF3 retained on beads was estimated by SDS-15% PAGE followed by fluorography to reveal 35S-labeled proteins.
In Vitro Phosphatase Assay
The phosphatase activity of GST-Pyst1 was measured in the presence of E. coli-expressed and purified His-tagged “kinase-dead” ERK or MEK1 (KD-ERK and KD-MEK, kind gifts of Dr. Gary Johnson, University of Colorado Medical School) and His-tagged pORF3. The GST-Pyst1 protein was expressed in E. coli DH5α cells according to standard procedures. The protein was purified by first binding to glutathione-Sepharose beads (Amersham Biosciences) followed by three washes with elution buffer containing 10 mm reduced glutathione in 50 mm Tris-HCl, pH 8.0. The KD-ERK and KD-MEK proteins were expressed in E. coli BL21(DE3) cells. The cell pellet from 500 ml of bacterial culture was resuspended in cold lysis buffer (50 mm sodium phosphate, pH 8.0, 100 mm KCl, 0.1% Tween 20, 10 mm (v/v) 2-mercaptoethanol, 5 μg/ml leupeptin, 2.1 μg/ml aprotinin) and lysed by freeze/thawing followed by sonication. The lysate was clarified by centrifugation at 10,000 rpm in a Sorvall SS34 rotor for 30 min at 4 °C. The clear supernatant was mixed with 0.5 ml of nickel-nitrilotriacetic acid-agarose (Qiagen, Valencia, CA) in a rocker for 1 h at 4 °C. The beads were washed three times with 10 ml of lysis buffer, pH 8.0, followed by three times with 10 ml of lysis buffer, pH 6.3. The bound proteins were eluted with 3 × 1 ml of lysis buffer, pH 4.5. The eluate was dialyzed against 50% glycerol, 10 mm HEPES, pH 7.2, 1 mm EDTA, 0.1% mercaptoethanol, 0.025% Triton X-100, 2.1 μg/ml aprotinin and stored frozen. The His-tagged pORF3 was purified as described previously (20). The phosphatase assays were carried out using p-nitrophenyl phosphate as a substrate. To 200 μl of reaction mixture containing 50 mm Tris-HCl, pH 7.4, 5 mm dithiothreitol, 20 mm p-nitrophenyl phosphate, 5 μg each of GST-Pyst1, KD-ERK, or KD-MEK1 (as a control) and pORF3 or BSA (as a control) were added. The reaction was carried out in a 96-well plate at 25 °C in a microplate reader (TECAN Rainbow) and monitored at 405 nm over a 6-h period. Phosphatase assays on transfected cell lysates were carried out as described here but with lysates equivalent to 2 μg of protein in the presence of either 15 μg of BSA or purified recombinant ORF3 protein expressed in E. coli. Triplicate reactions were carried out as described above and monitored over a 4-h period. Two independent transfection-based in vitro phosphatase activity experiments were carried out.
RESULTS
pORF3-mediated Activation of MAPKs
We have shown earlier that the HEV ORF3 protein activates ERK (20). Here we tested whether pORF3 can also activate other members of the MAPK family. The phosphorylation (activation) of JNK and p38, as well as their total levels, was evaluated by Western blotting of lysates prepared from vector control and pORF3-expressing stable cell lines. One set of cells was also treated with anisomycin, an activator of JNK and p38. On densitometry, the total amounts of JNK1/2 and p38 were found to be elevated by about 50% in pORF3-expressing cells compared with the control cell line (Fig. 1A). No specific activation of either JNK1/2 or p38 was observed in the pORF3-expressing cells. Following anisomycin treatment of cells, JNK1/2 was activated, and the effect was enhanced in pORF3-expressing cells. When normalized for total JNK1/2, the levels of phospho-JNK1/2 in ORF3/1 and ORF3/4 cells were found to be ∼6.5 and ∼3.5 times, respectively, compared with the control cell line (Fig. 1A, lanes 5 and 6). In this cellular background, no activation of p38 was observed in either the control or ORF3 stable lines with or without anisomycin. That the phospho-p38 antibody was functional was established in separate experiments (not shown).
Fig. 1. Effect of pORF3 on JNK and p38 MAPKs.
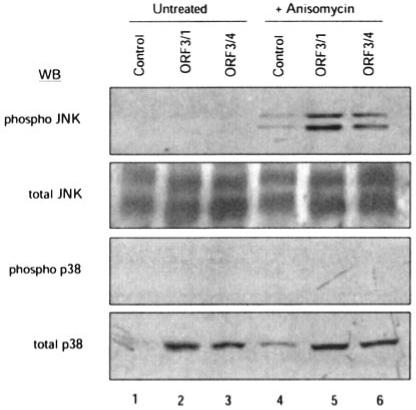
Two independent cell lines stably expressing pORF3 (ORF3/1 and ORF3/4) or a control cell line were either left untreated (lanes 1-3) or treated with 10 μg/ml anisomycin for 60 min (lanes 4-6). The cell lysates were subjected to Western blotting (WB) with the indicated antibodies.
Signaling Pathways in ORF3-mediated ERK Activation
To understand the signaling pathways involved in pORF3-mediated ERK activation, we used inhibitors of various pathways. These included U0126, an inhibitor of the Raf/MEK/ERK pathway (33); LY294002, an inhibitor of the PI3K/Akt pathway (34); calphostin C, an inhibitor of protein kinase C (35); TMB-8, an inhibitor of intracellular calcium mobilization (36); and Genistein, a general protein-tyrosine kinase inhibitor (37). To ensure that the various inhibitors functioned properly, their effects were evaluated as follows (data not shown). The effect of U0126 was tested on MEK activity in cells that were serum-starved and then treated with 10% serum in the absence or presence of the inhibitor. Cell lysates were immunoprecipitated with anti-MEK antibodies, and immunocomplex kinase assays were carried out using KD-ERK and [γ-32P]ATP. Similarly the effect of LY294002 was assayed by its ability to inhibit Akt phosphorylation following insulin stimulation of serum-starved cells. The phosphorylation of Akt was detected by Western blotting with anti-phospho-Akt antibodies. Lysates from cells treated with Genistein or control cells were subjected to Western blotting with anti-phosphotyrosine antibodies to evaluate the effects of this inhibitor.
Stable cell lines expressing pORF3 or an appropriate vector control were treated with increasing concentrations of the various inhibitors, and the cell lysates were quantitated for ERK activity using three independent assays. Immunocomplex kinase assays were carried out using MBP or the transcription factor Elk-1 as an ERK substrate, and Western blotting was carried out for the phosphorylated form of ERK. The total ERK protein present in cell lysates was estimated by Western blotting with an ERK-specific antibody. Using various assays, the activity of ERK was found to be 4–30 times greater in pORF3-expressing cells compared with control cells under conditions of serum starvation and 1.5–4 times greater in the presence of 10% serum (Fig. 2, lanes 1-4). Among the various inhibitors tested, only U0126 when used at 5 times its IC50 value showed a 30–40% reduction in ERK activity (Fig. 2, lanes 5-8). Controls showed no significant difference in the levels of total ERK protein following treatment with serum or inhibitors (Fig. 2, bottom panel). These results showed that pORF3-mediated ERK activation was only partially dependent on the Raf/MEK pathway and was independent of the PI3K/Akt pathway, protein kinase C activation, and intracellular calcium signaling. The lack of inhibition by Genistein (Fig. 2, lanes 22-24) further showed no significant effect of tyrosine kinases. Taken together, these observations suggested a novel mechanism for pORF3-mediated ERK activation.
Fig. 2. Effect of various pathway inhibitors on pORF3-mediated ERK activation.
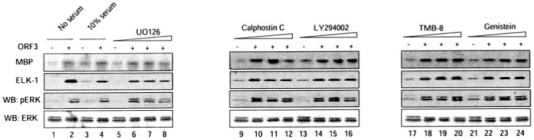
Cells stably expressing pORF3 or a control cell line were serum-starved and then treated with either 10% serum (lanes 3 and 4) or with one of the inhibitors indicated (lanes 5-24). Cell growth and treatments were as described under “Experimental Procedures.” For each set, the control cells were treated with an IC50 concentration of the inhibitor; the pORF3-expressing cells were treated with IC50, 2× IC50, or 5× IC50 concentrations of the inhibitor. Cell lysates were tested for ERK activity using MBP and Elk-1 as substrates as described under “Experimental Procedures.” The lysates were also Western blotted (WB) with anti-phospho-ERK and total ERK antibodies. Each blot was individually scanned, and the bands were quantitated by densitometry using Kodak 1D image analysis software (Kodak Digital Science).
The ORF3 Protein Binds MAPK Phosphatase
Enzymes of the MAPK family are activated by phosphorylation of neighboring threonine and tyrosine residues by dual specificity kinases that lie upstream in the pathway (38-41). For ERK, this is accomplished by the MEK. However, the activation of MAPK is transient, and inactivation results from dephosphorylation at both threonine and tyrosine residues by dual specificity MKPs (24, 25).
We tested the ability of pORF3 to bind to CL100 and Pyst1, prototypic members of the MKP-1 and MKP-3 subclasses, respectively (27-29). COS-1 cells were transiently transfected with vectors expressing ORF3 and a HA-tagged CL100 or Pyst1. Cells were metabolically labeled with [35S]methionine-cysteine, and the cell lysates were immunoprecipitated with antibodies to either pORF3 or the HA tag. pORF3 as well as the HA-tagged CL100 (Fig. 3A, lanes 1-4) or Pyst1 (Fig. 3B, lanes 1-4) proteins were immunoprecipitated with anti-pORF3 antibodies. Similarly antibodies to the HA tag immunoprecipitated the HA-CL100 or HA-Pyst1 proteins as well as pORF3 (Fig. 3, A and B, lanes 6-9). These co-immunoprecipitation results suggest that pORF3 interacted physically with the CL100 and Pyst1 proteins. Interaction between pORF3 and the MKPs was further substantiated by immunofluorescence colocalization of these proteins. COS-1 cells were cotransfected as described earlier, and the cells were doubly stained for pORF3 and the HA-tagged CL100 or Pyst1 proteins. The localization of pORF3 was found to be cytosolic with punctate and often perinuclear distribution. It has been shown that while MKP-1 is localized to the nucleus (27), MKP-3 shows exclusive cytosolic localization (26, 28). We also observed a nuclear distribution for CL100, a cytosolic distribution for Pyst1, and colocalization of pORF3 and Pyst1 in the cotransfected cells (not shown). Thus, while pORF3 showed in vitro binding to both MKP-1 and MKP-3, only its interaction with the latter is expected to have any functional significance.
Fig. 3. Binding of pORF3 to MAPK phosphatases.
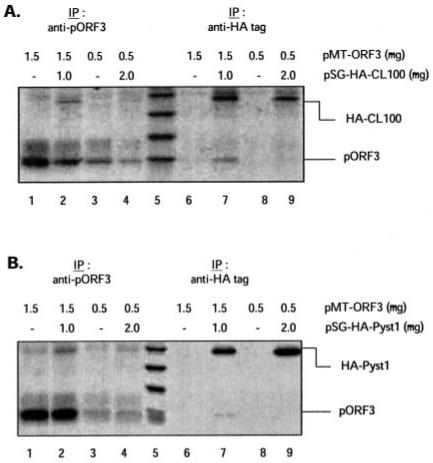
COS-1 cells were transiently transfected with the indicated amounts of plasmid pMT-ORF3 alone or together with either pSG-CL100 (A) or pSG-Pyst1 (B). The cells were metabolically labeled with [35S]methionine-cysteine, and the cell lysates were immunoprecipitated (IP) with antibodies to either pORF3 (lanes 1-4) or the HA tag (lanes 6-9) as described under “Experimental Procedures.” The immunoprecipitates were resolved by SDS-15% PAGE, and the proteins were detected by fluorography.
To delineate the regions in pORF3 that were responsible for this interaction, we used a panel of ORF3 mutants (Fig. 4A) in a similar co-immunoprecipitation analysis. The full-length ORF3 protein as well as its deletion mutants including up to 77 N-terminal residues immunoprecipitated with anti-HA tag antibodies (Fig. 4B, upper panels, lanes 2-5). However, a pORF3 mutant missing 32 N-terminal residues did not immunoprecipitate with anti-HA tag antibodies (Fig. 4B, upper panels, lane 6). Although there were quantitative differences between different experiments and between CL100 and Pyst1 binding to the wild type and mutant ORF3 proteins, both proteins reproducibly showed no co-immunoprecipitation with the mutant ORF3-(33–123) protein. The same immunoprecipitations with anti-HA tag antibodies showed comparable expression levels of the HA-CL100 and HA-Pyst1 proteins (Fig. 4B, middle panels). Immunoprecipitations with anti-pORF3 antibodies showed that reasonable levels of the wild type and the mutant ORF3 proteins, including the ORF3-(33–123) mutant, were expressed under the conditions used (Fig. 4B, bottom panels). The phosphorylation status of pORF3 appeared to have no effect on its interaction with these MKPs because a non-phosphorylable mutant (S80A) or a natural mutant (Mexican) of pORF3 lacking Ser-80 were both effectively immunoprecipitated with the anti-HA tag antibodies (Fig. 4B, lanes 7 and 8). Together these results showed that the N-terminal region encompassing amino acids 1–32 of pORF3 was critical for its interaction with the MAPK phosphatases.
Fig. 4. Mapping of the interaction domain on pORF3.
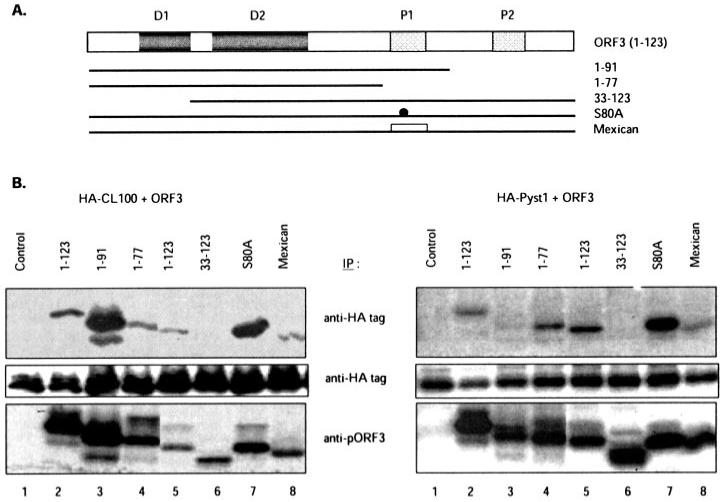
A, the ORF3 protein and its mutants used in this study are illustrated. The two N-terminal hydrophobic domains (D1 and D2) and two C-terminal proline-rich regions (P1 and P2) are shown. The S80A mutant contains a site-directed Ser to Ala mutation at amino acid residue 80 in pORF3. The Mexican mutant expresses an ORF3 protein with a divergent P1 region and that lacks the Ser-80 residue. B, COS-1 cells were transfected with pSG-HA-CL100 (left panels) or pSG-HA-Pyst1 (right panels) together with either the control vector pMT3 (lane 1) or the same vector expressing wild type or mutant pORF3 as indicated (lanes 2-8). Cells were transfected with plasmids expressing either His6-tagged (lanes 2-4) or untagged (lanes 5-8) versions of the wild type or mutant pORF3, metabolically labeled, and immunoprecipitated (IP) with either anti-HA tag (top and middle panels) or anti-pORF3 (bottom panels). The panels show wild type or mutant pORF3 (top and bottom) or HA-CL100 or HA-Pyst1 (middle).
The region(s) in MKP-3 responsible for binding pORF3 were mapped using GST fusions of the full-length and truncated Pyst1 protein (Fig. 5A). The MKP-3/Pyst1 protein includes two N-terminal domains that bear homology to the Cdc25 protein and a C-terminal catalytic domain (28, 29). We made N- and C-terminal deletion mutants (Fig. 5A) that included amino acids 56–283 (N670), 150–383 (C696), 229–383 (C450), 150–283 (C400), and 283–383 (C300) and fused these in-frame with GST. The GST-Pyst1 proteins were expressed in E. coli and purified by binding to glutathione-Sepharose. The beads with bound full-length or mutant protein were incubated with full-length pORF3 expressed and labeled with [35S]methioninecysteine using an in vitro transcription-translation system. After washing, pORF3 bound to Pyst1 on the resin was estimated by SDS-PAGE and fluorography. The ORF3 protein differentially bound to full-length and mutant forms of the Pyst1 protein fused to GST; no binding was observed with GST alone (Fig. 5B, lane 4). Furthermore the luciferase protein prepared similarly did not show any binding to GST-Pyst1 (Fig. 5B, lane 11). All mutant Pyst1 proteins that included amino acids 150–229 bound strongly to pORF3 (Fig. 5B, lanes 6, 7, and 9), while weak binding was also observed with the C450 mutant that included regions just downstream (Fig. 5B, lane 8). No binding was observed with the C300 mutant that included the catalytic site and its C-terminal sequences (Fig. 5B, lane 10). The dimeric form of pORF3 preferentially bound Pyst1, although the input pORF3 contained more of the ORF3 monomer (Fig. 5B, lane 1). Very little binding was observed with the pORF3 monomer. In light of our earlier results showing homodimerization of pORF3 (42) preferential binding of Pyst1 to ORF3 dimers suggests that the dimer is likely to be the functional form of pORF3. Taken together, these mapping studies showed that pORF3 and Pyst1 interacted through the N-terminal region of the former and a region encompassing amino acids 150–283 in the latter.
Fig. 5. Mapping of the interaction domain on Pyst1.
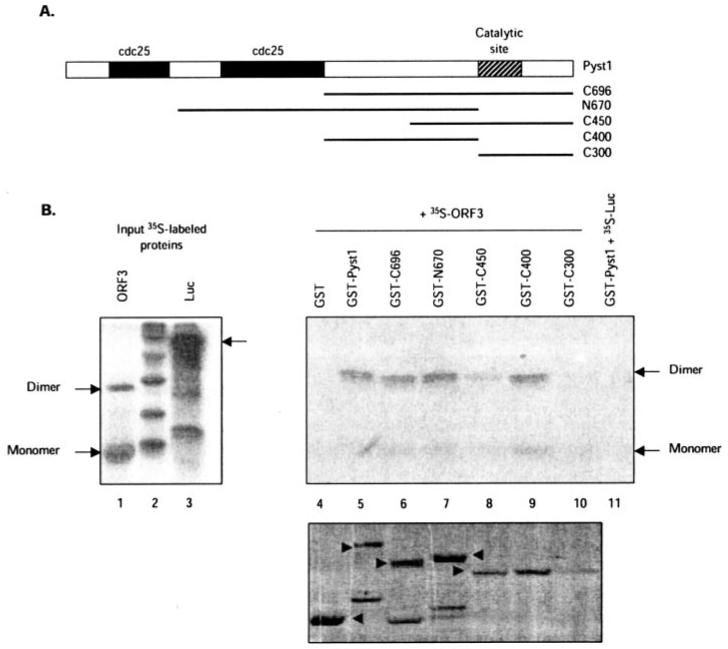
A, the Pyst1 protein and its mutants used in this study are illustrated. The two N-terminal Cdc25 homology domains and the C-terminal catalytic site are shown. B, GST pull-down assay for pORF3-Pyst1 interaction. The ORF3 protein (lane 1) or a control luciferase protein (lane 3) were expressed and labeled with [35S]methionine-cysteine in a coupled in vitro transcription-translation reaction. The labeled proteins were then incubated with glutathione-Sepharose beads containing equivalent amounts of GST-fused full-length (lane 5) or mutant Pyst1 (lanes 6-10) proteins, and the retained pORF3 was analyzed as described under “Experimental Procedures.” As controls, pORF3 retained on GST beads (lane 4) or 35S-labeled luciferase (Luc) retained on GST-Pyst1 beads (lane 11) was also analyzed. The pORF3 monomer and dimer are indicated. The bottom panel shows GST and GST-Pyst1 fusion proteins (arrowheads) used for the pull-down.
Yeast Two-hybrid Analysis of pORF3-Pyst1 Interactions
The full-length and truncated ORF3 and Pyst1 proteins were used to test their interactions in the yeast two-hybrid system. The ORF3 protein or its N-terminal deletion mutant was expressed as a fusion with the Gal4 DNA-binding domain, while the Pyst1 protein or its various deletion mutants were expressed as fusions to the Gal4 activation domain. The results of cotransformation of AH109 S. cerevisiae cells and subsequent analysis are shown in Fig. 6. All yeast transformants grew on YPD (2% each yeast extract, peptone, and dextrose) plates indicating no toxicity as a result of expression of the fusion proteins. While all the cotransformants grew on both Leu− and Trp− plates, single transformants grew only on the appropriate selective media. The interaction between two fusion proteins was tested genetically on His− plates and biochemically using a β-galactosidase assay either qualitatively on colony lifts or quantitatively in liquid phase. The relative strength of a true interaction was also judged by growth of transformed AH109 cells on His− plates containing increasing concentrations of 3′-aminotriazole. The positive control proteins SNF1 and SNF4 showed interaction based on growth on His− plates in the presence of up to 10 mm 3′-aminotriazole; the negative control single transformants or untransformed AH109 cells did not show growth on His− plates. Full-length ORF3 protein displayed a positive interaction phenotype with full-length Pyst1 as well its deletion mutants N670, C450, and C400. The interaction with Pyst1 C696 and C300 deletion mutants could not be tested conclusively. While the AD-C696 plasmid could not be cotransformed reproducibly into AH109 cells, the AD-C300 plasmid showed promoter transactivation and growth on His− plates on its own in the absence of any BD-ORF3 plasmid (results not shown). The ORF3-(33–123) N-terminal deletion mutant showed significantly weaker interaction with Pyst1 as the cotransformants failed to grow on His− plates containing 10 mm 3′-aminotriazole. This was also evident from the liquid β-galactosidase assay results. This assay also showed higher values for the interactions between full-length ORF3 and the C450 or C400 deletion mutants of Pyst1 compared with full-length Pyst1. This may be due to either higher expression levels or better folding of the truncated Pyst1 fusion proteins, resulting in increased exposure of the binding surface. Overall the yeast two-hybrid analysis confirmed the results obtained with the co-immunoprecipitation and GST pull-down assays described under “The ORF3 Protein Binds MAPK Phosphatase.”
Fig. 6. Yeast two-hybrid analysis.
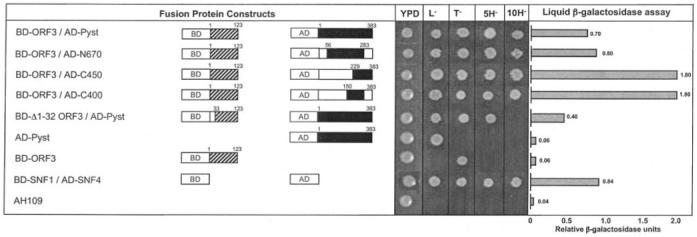
The Gal4 DNA-binding domain (BD) and activation domain (AD) were cloned in-frame with either full-length or mutant ORF3 (hatched boxes) or full-length or mutant Pyst1 (solid boxes). Open boxes indicate regions that were deleted from the wild type sequences of both ORF3 and Pyst1. The numbers above the boxes represent the first and last amino acids of the regions included. L− and T− represent growth on SDLeu− or SDTrp− plates, respectively, where SD is synthetic dextrose, composed of 0.67% yeast nitrogen base without amino acids, 2% dextrose, amino acids, and uracil. 5H− and 10H− represent growth on SDLeu−Trp−His− plates containing 5 or 10 mm 3-aminotriazole, respectively. The liquid β-galactosidase assay results are shown for the transformants.
In Vivo Interactions of the ORF3 Protein
To detect intimate protein-protein interactions in vivo and to complement the results of in vitro interaction assays, we used FRET. This non-radiative energy transfer follows stringent conditions of distance and dipole orientations between the donor and acceptor fluorophores. Proteins fused to the cyan (ECFP) and yellow (EYFP) colored variants of the EGFP were used as the donor-acceptor FRET pair (43). The efficiency of FRET was measured following cotransfection of COS-1 cells as described under “Experimental Procedures.” To make measurements independent of the expression levels of the two fusion proteins, we followed an acceptor photobleach protocol and recorded the mean fluorescence intensity from the donor fluorophore (ECFP) before and after photobleaching of the acceptor fluorophore (EYFP). Two areas within the same cell were recorded, one where the two proteins colocalized (Fig. 7A) and another where no colocalization was observed (Fig. 7B). Since the ORF3 protein has been shown to dimerize (42), the ECFP-ORF3 and EYFP-ORF3 pair was used as a positive control in the FRET assay (Fig. 7A). An average percent FRET efficiency of 26.40 ± 7.01 was found in the region of colocalization as opposed to 8.68 ± 4.48 in the non-colocalized area (Table I). Similar measurements were then made for the ECFP-ORF3 and EYFP-Pyst1 pair (Fig. 7B). This showed an average percent FRET efficiency of 27.79 ± 7.51 in the region of colocalization and 3.42 ± 3.30 in the non-colocalized area (Table I). The differences in FRET efficiency between the areas of colocalization and non-colocalization were highly significant with p values in the 10−6−10−7 range (Table I). Under certain expression conditions, EGFP and its color variants have been shown to oligomerize (44). We therefore used co-expression of non-fused ECFP and EYFP as an additional negative control for the FRET assay. This showed a low percent FRET efficiency of 1.20 ± 1.19 (Table I). These results provide strong in vivo support for a physical interaction between the ORF3 and Pyst1 proteins.
Fig. 7. FRET analysis of protein-protein interactions.
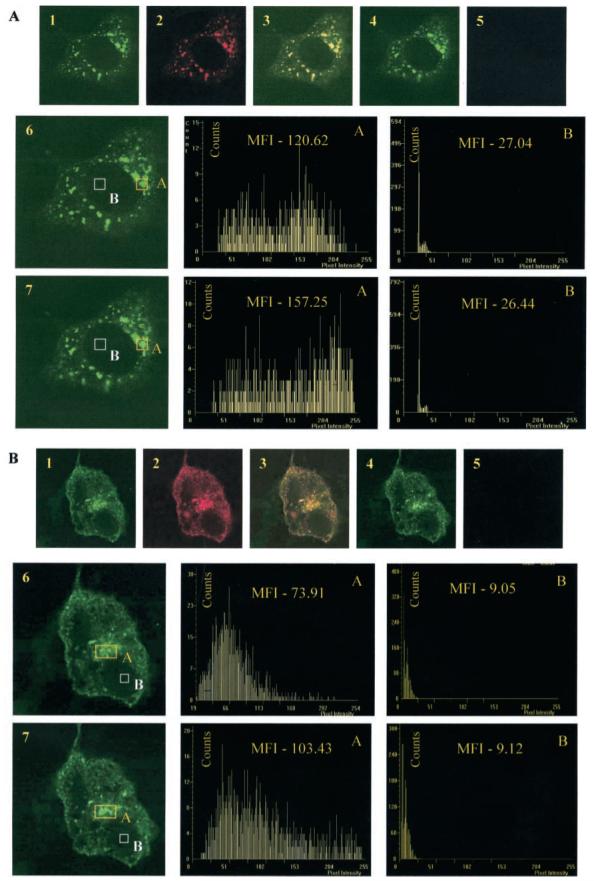
A, homodimerization of the ORF3 protein. COS-1 cells were cotransfected with pECFP-ORF3 and pEYFP-ORF3 and imaged for ECFP (pseudocolored green) or EYFP (pseudocolored red) before (panels 1 and 2) and after (panels 4 and 5) EYFP photobleaching. Panel 3 shows a merge of panels 1 and 2. Histograms of the mean fluorescence intensity (MFI) of ECFP in the area of colocalization (A) and in the region where the two proteins do not colocalize (B) are shown either before (panel 6) or after (panel 7) photobleaching of EYFP. B, interaction between the ORF3 and Pyst1 proteins. COS-1 cells were cotransfected with pECFP-ORF3 and pEYFP-Pyst1 and imaged for ECFP and EYFP as above. Mean fluorescence intensities were determined as described under “Experimental Procedures.” Representative images are shown.
Table I. Percent FRET efficiencies for different protein pairs.
Percent FRET efficiency = 1 – ((ECFP before photobleach)/(ECFP after photobleach)) × 100
| Protein pairs | Region of colocalizationa | Region of non-colocalizationa | p value (two-tailed) |
|---|---|---|---|
| ECFP-ORF3:EYFP-ORF3 | 26.40 ± 7.01 | 8.68 ± 4.48 | 2.60 × 10⁻⁶ |
| ECFP-ORF3:EYFP-Pyst1 | 27.79 ± 7.51 | 3.42 ± 3.30 | 1.97 × 10⁻⁷ |
| ECFP:EYFP | 1.20 ± 1.19 | Not determined | Not determined |
Each calculation was based on 10 independent measurements in different cells in two separate experiments.
The ORF3 Protein Inhibits MKP-3
To test the functional relevance of interactions between pORF3 and MKPs, we evaluated the ability of mutant ORF3 proteins to activate ERK. We have shown previously that pORF3 contains two proline-rich motifs, P1 and P2, in its C-terminal half of which P2 encompassing amino acid residues 104–113 binds the SH3 domains in various signaling proteins (20). A mutant pORF3 containing only 77 N-terminal residues, ORF3-(1–77), and lacking both proline-rich domains was as effective as the full-length ORF3 protein in activating ERK (Fig. 8, lanes 2, 3, 6, and 7). This was also the case for a mutant containing 91 N-terminal amino acids lacking the SH3-binding P2 domain in pORF3 (data not shown). Thus, the proline-rich regions of pORF3 and its interaction with cellular proteins through their SH3 domains have no measurable effect on the ability of pORF3 to activate ERK. However, the ORF3-(33–123) mutant lacking 32 N-terminal amino acid residues, the region responsible for pORF3-MKP3 interaction, did not activate ERK (Fig. 8, lanes 4 and 8) over the basal levels seen in vector-transfected cells (Fig. 8, lanes 1 and 5). These effects were more pronounced when Pyst1 was co-expressed with the ORF3 proteins (Fig. 8, lanes 5-8). Taken together, these results showed that pORF3-mediated ERK activation correlated with its ability to bind the MKP-3.
Fig. 8. ERK activation by mutant ORF3 proteins.
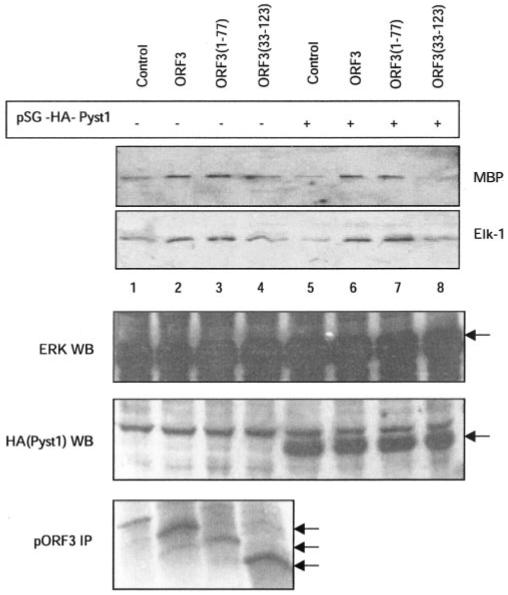
Cells were transfected with expression vectors for wild type (lanes 2 and 6) or mutant (lanes 3, 4, 7, and 8) ORF3 proteins in the absence (lanes 1-4) or presence (lanes 5-8) of plasmid pSG-HA-Pyst1. Empty pMT3 vector was used as control (lanes 1 and 5). Cell lysates were prepared and assayed for ERK activity using either MBP or Elk-1 as a substrate as described under “Experimental Procedures.” The lower panels show Western blots (WB) for expression of ERK and Pyst1 (anti-HA tag) and immunoprecipitation (IP) for full-length and deleted pORF3. Arrows indicate the relevant protein bands.
This would imply that by binding to MKP-3, pORF3 either sequesters it away from its ERK substrate or inhibits its catalytic activity. The competition between ERK and pORF3 for binding to Pyst1 was evaluated as described under “Experimental Procedures.” The ORF3 protein was synthesized and labeled with 35S in a coupled transcription-translation reaction (TnT). This was added to lysates of COS-1 cells expressing HA-tagged ERK, and the mixture was incubated with GST-Pyst1 protein bound to glutathione-Sepharose beads. Following incubation and washing, the ERK or ORF3 proteins bound to beads were estimated either by Western blotting with antibodies to the HA tag or 35S autoradiography. There was no difference in the amount of HA-ERK retained on beads in the absence or presence of pORF3 (Fig. 9A, lanes 2-5). Similarly there was no significant and reproducible decrease in the amount of pORF3 retained on beads in the presence of HA-ERK compared with control lysates (Fig. 9A, lanes 9 and 10). The binding competition was also repeated with purified recombinant pORF3 expressed in E. coli. There was no change in HA-ERK retained on beads with increasing amounts of purified pORF3 when compared with BSA as a control (Fig. 9B, lanes 1-5). Thus, pORF3 does not appear to compete with ERK for binding to Pyst1. This supports our observation that the pORF3-binding domain in Pyst1 is distinct from the ERK-binding domain.
Fig. 9. Competition between ERK and pORF3 for binding Pyst1.
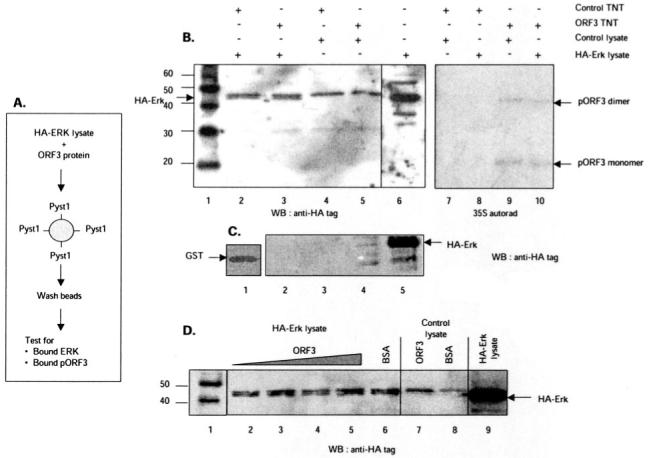
A, schematic representation showing the experimental strategy. Lysates from cells expressing HA-tagged ERK were mixed with pORF3, and the mixture was incubated with either GST-tagged Pyst1 or GST alone bound to glutathione-Sepharose beads. After washing, the amounts of ERK and pORF3 trapped on the beads were estimated. B, either control (lanes 2, 4, 7, and 8) or ORF3-expressing (lanes 3, 5, 9, and 10) in vitro transcription-translation (TnT) lysates were mixed with lysates from control (lanes 4, 5, 7, and 9) or HA-ERK-expressing (lanes 2, 3, 8, and 10) cells. The TnT reactions were labeled with [35S]methionine. The ERK retained on beads was estimated by Western blotting (WB) with anti-HA tag antibodies (lanes 1-6); the retained pORF3 was estimated by autoradiography (lanes 7-10). Lane 1 shows molecular size markers (kilodaltons), and lane 6 shows HA-ERK expression in the cell lysates. Arrows indicate HA-ERK (lower band in the doublet) and the pORF3 monomer or dimer. C, lysates from control (lane 2) or HA-ERK-expressing (lane 3) cells were incubated with GST beads. After washing, the beads were Western blotted with anti-HA tag antibodies. Lane 1 shows GST loading on beads, while lanes 4 and 5 show direct Western blotting of control or HA-ERK cell lysates, respectively, with anti-HA antibodies. D, lysates from HA-ERK-expressing cells (lanes 2-6) were mixed with 6, 10, 15, or 20 μg of purified recombinant pORF3 (lanes 2-5) or 20 μg of BSA (lane 6). Lysates from control cells were mixed with 20 μg of either pORF3 (lane 7) or BSA (lane 8). Following incubation with beads and washing, the retained HA-ERK was estimated by Western blotting. Lane 1 shows molecular size markers (kilodaltons), and lane 9 shows HA-ERK expression in the cell lysates.
To test for the effect of pORF3 on MKP activity in transiently transfected cells, COS-1 cells were transfected with expression vectors for ORF3, CL100, or Pyst1. The cell lysates were subjected to an immunocomplex kinase assay for ERK using MBP as a substrate. Transient transfection with the ORF3 expression vector alone resulted in a 2–2.5-fold activation of ERK (Fig. 10A, lanes 2 and 3). While transfection with the CL100 expression vector showed no significant change, that with the Pyst1 expression vector resulted in about 40–50% decrease in basal ERK activity (Fig. 10A, lanes 4 and 5). This reduction in ERK activity by Pyst1 was reversed by co-expression of pORF3 (Fig. 10A, lane 7), implying that pORF3 protected ERK from MKP-3-mediated dephosphorylation and inactivation. Inactivation of MKP-3 following ORF3 expression was also evaluated by Western blotting for endogenous phospho-ERK in lysates from transfected cells (Fig. 10B). Cells transfected with the ORF3 or Pyst1 expression vectors alone showed an increase (lane 2) or decrease (lane 3) in phospho-ERK, respectively. On cotransfection with mixtures of the two expression vectors (lanes 4-6), endogenous phospho-ERK levels were regained with an excess of the ORF3 expression vector. Western blotting and immunoprecipitation were used to assess expression levels of Pyst1 and pORF3, respectively (data not shown); Western blotting with anti-ERK antibodies was used to assess total ERK expression under the various transfection conditions.
Fig. 10. Protection of ERK activity by pORF3.
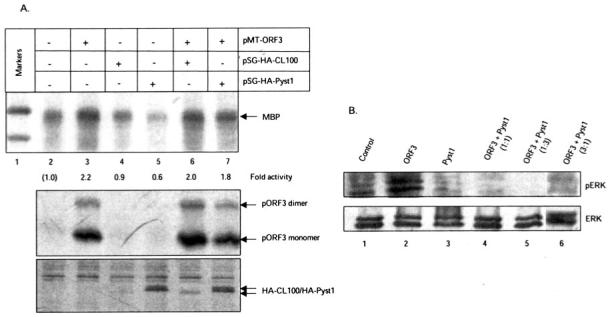
A, cells were transfected with the indicated plasmids, and the endogenous ERK activity present in cell lysates was determined using the MBP assay. The -fold activity was calculated by densitometric scanning of the bands; the ERK activity present in mock-transfected cells (lane 2) was used as a reference. The lower panels show Western blots for expression of pORF3 and HA-tagged CL100 or Pyst1. Arrows indicate the relevant protein bands. B, cell lysates were Western blotted for cellular ERK with anti-phospho-ERK (pERK) or anti-ERK antibodies.
Direct in vitro measurements of Pyst1 phosphatase activity were made using E. coli-expressed and purified GST-Pyst1, His-tagged KD-ERK, and His-tagged pORF3 as described under “Experimental Procedures.” No significant differences in phosphatase activity were observed under the various conditions (data not shown). We then measured phosphatase activity in lysates of cells transfected with the Pyst1 expression vector alone or together with expression vectors for ERK and ORF3 (Fig. 11). The low phosphatase activity in mock-transfected cell lysates (line 1) was boosted following expression of Pyst1 (line 2) and further increased in the presence of ERK expression (line 3). Co-expression of pORF3 showed a modest decrease in phosphatase activity (line 4). However, the addition of an excess of purified recombinant pORF3 led to complete inhibition of phosphatase activity (line 5).
Fig. 11. Inhibition of MKP by pORF3.
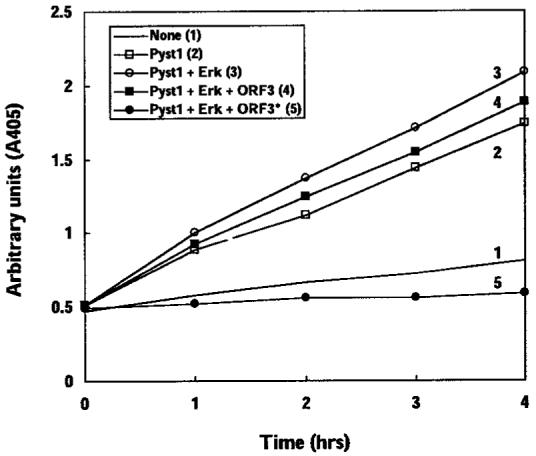
Cells were transfected with expression vectors for ORF3, Pyst1, or mixtures of the two in the indicated ratios. Cell lysates (2 μg of protein each) were assayed for phosphatase activity in the presence of either exogenously added purified recombinant pORF3 (line 5) or an equivalent amount of BSA (lines 1-4) as described under “Experimental Procedures.” The values represent an average of triplicate measurements from one of two separate experiments.
DISCUSSION
The biology and pathogenesis of HEV are poorly characterized. In our continuing efforts to utilize subgenomic expression strategies toward this goal, we have focused on the interactions between viral and host proteins. Earlier we had shown that the HEV ORF3 protein bound a variety of host cell proteins involved in various signal transduction pathways (20). The identified molecules were upstream regulators of the MEK/ERK (Src and Grb2), PI3K/Akt (p85α), and protein kinase C (phospholipase C γ) pathways. The interactions involved a C-terminal proline-rich motif in pORF3 and the SH3 domains in the cellular proteins. We also showed that in cells stably expressing pORF3 as well as in transiently transfected cells there was increased activity of ERK (20). Furthermore pORF3-expressing cells showed increased nuclear translocation of the phosphorylated (and activated) form of ERK. In the case of other members of the MAPK family, JNK and p38, pORF3 appeared to enhance the expression levels of these proteins. In the ORF3 stable lines, while JNK activation was still responsive to a stress signal such as anisomycin, no activation of p38 was observed. The effects of pORF3 on the JNK and p38 pathways will be investigated separately.
In this study we investigated the mechanism of pORF3-mediated ERK activation. The activation of ERK follows sequential phosphorylation and activation of the upstream kinases MEK and Raf-1 following receipt of mitogenic signals at the cell surface (23). This pathway can also be activated by the phosphorylation of Raf-1 by protein kinase C (45), through activation of the PI3K/Akt pathway (46-48), or through increased calcium mobilization from intracellular pools in the endoplasmic reticulum (49). As a first step toward elucidating the mechanism of pORF3-mediated ERK activation, we used chemical inhibitors of various pathways and studied their effect on ERK activity. The MEK inhibitor U0126 only partially inhibited ERK activity at a concentration of 5 times its IC50 value, suggesting this to be, at best, a minor pathway of pORF3-mediated ERK activation. Inhibitors of the PI3K/Akt pathway, the protein kinase C pathway, or intracellular calcium mobilization as well as a generic protein-tyrosine kinase inhibitor also did not block pORF3-mediated ERK activation. These results suggested a mechanism that was distinct from a kinase-directed activation of ERK.
MAPK activation is triggered by phosphorylation of specific threonine and tyrosine residues localized within its activation loop by upstream kinases. This activation is transient and reversible; inactivation is achieved by dephosphorylation of the specific residues by dual specificity MKPs. Here we present results of in vitro experiments to show that pORF3 binds CL100 and Pyst1, prototypic members of the MKP-1 and MKP-3 subfamilies of these phosphatases, respectively (27, 29-30). Deletion mapping studies showed both these proteins to bind the same region of pORF3. Since MKP-3 is the ERK-specific phosphatase and its cellular localization like that of pORF3 is cytoplasmic, we concentrated our studies on the Pyst1-pORF3 association. This interaction was further confirmed with the yeast two-hybrid system (50).
Results of the in vitro interaction between these proteins were confirmed by in vivo FRET measurements (43, 51-53) using ECFP (donor) and EYFP (acceptor) fused upstream to pORF3 and Pyst-1, respectively. Since FRET efficiency between two molecules decreases by the sixth power of the distance between them (43), the presence of FRET indicates an actual protein-protein interaction. Simple colocalization of two proteins is not sufficient to yield energy transfer, and FRET represents a powerful indicator of in vivo protein-protein interaction (43, 51-53). The ECFP-EYFP pair is a commonly used donor-acceptor pair ideally suited for FRET measurements (43). FRET exploits the ability of the higher energy donor fluorophore (ECFP) to transfer some of its energy to the acceptor fluorophore (EYFP) in its excited state under optimum conditions of spectral overlap and Forster’s radius (43). Following FRET, there is a reduction in the donor emission due to the transfer of energy and an increase in the acceptor emission. However, in the acceptor photobleaching method used here, after photobleaching of the EYFP acceptor, there should be an increase in emission from the ECFP donor if FRET is taking place. This is because the acceptor fluorophore is no longer able to quench the donor emission. Based on this method, we show here significant FRET efficiency between ECFP-ORF3 and EYFP-Pyst1, supporting the in vitro results that pORF3 and Pyst1 interact with each other. The FRET studies carried out here also support our earlier results showing dimerization of pORF3 (42).
The MKPs are composed of a divergent N-terminal substratebinding region and a conserved C-terminal catalytic domain. The N-terminal region containing two Cdc25 phosphatase-like domains is responsible for selective docking of the MAPKs (54). The catalytic domain by itself does not show strict selectivity in dephosphorylating various members of the MAPK family (55, 56). Through selective MAPK binding, the N-terminal domain plays a major role in this selectivity. Structural analysis of the N-terminal domain of MKP-3 (57) and biochemical analysis of the MAPK docking surface on MKPs (58) reveal a direct interaction surface for ERK. The docking surface is proposed to contain three modules that include two clusters of positively charged amino acids flanking a cluster of hydrophobic amino acids (58). This modular structure would fit well within the docking groove on MAPKs and is proposed to confer binding specificity between various MKPs and their substrate MAPKs.
The catalytic activation of MKPs requires binding to the cognate MAPKs. The ERK-induced activation of MKP-3 requires the N-terminal ERK-binding (EB) domain of MKP-3. The catalytic domain alone has very low phosphatase activity, and it cannot be directly activated by ERK (59), suggesting that intimate coupling of the N- and C-terminal domains is required for an allosteric effect on the active site conformation of MKP-3. Such has also been suggested by the crystal structure of the MKP-3 catalytic domain (60). It has been proposed from the NMR structure of the EB domain of MKP-3 (57) that the enzyme exists in a low activity state in which key active site residues within the C-terminal catalytic domain are disengaged from enzymatic catalysis. Binding of ERK to the N-terminal EB domain alters intramolecular interactions between the N- and C-terminal domains of MKP-3. This conformational change results in a restructuring of the active site leading to a catalytically active MKP-3. This study also showed that EB domain constructs that contained the linker sequence between the N- and C-terminal domains exhibited higher binding affinity to ERK than those that contained the minimal EB domain (57). Although the linker sequence is not part of the EB domain, its functional coupling to the EB domain may be critical for ERK-induced activation of MKP-3. Our mapping results show that pORF3 binds predominantly to this linker region of Pyst1 (amino acids 150–228). However, binding was also observed within the region of amino acids 229–283 of Pyst1. This region includes the critical Asp-262 residue used as a proton donor for the phenolic (tyrosine) or hydroxyl (threonine) oxygen of the leaving group (60). Thus, pORF3 would be predicted to interfere with the ERK-mediated activation as well as with the catalytic function of Pyst1.
The N-terminal region of pORF3 encompassing amino acids 1- 32 is shown here to be responsible for its interaction with MKPs. Previously we have shown the same region to be required for association of pORF3 with cytoskeletal and membrane components of cells (11). Although pORF3 has an isoelectric point of ∼10.5, it predominantly contains prolines and hydrophobic residues with only 2.4% acidic residues. The N-terminal region is largely hydrophobic with an unusual concentration of cysteines in the region of amino acids 20–31. Complementary to this, the Pyst1 region encompassing amino acids 150–283 shows 13.5% acidic residues, ∼6% basic residues, and a predominance of amino acids with neutral and hydrophobic side chains. The region of amino acids 150–229 in Pyst1 that provides the major binding surface for pORF3 contains 15% acidic residues and only 4% basic residues. Present within this region is an acidic stretch, DIESDLDRD (amino acids 179–187), as well as a hydrophobic stretch, PLPVLGLGGL (amino acids 161–170). These characteristics of the cognate binding regions of the two proteins suggest that the binding energy is largely contributed by hydrophobic and electrostatic interactions.
The functional relevance of pORF3-Pyst1 interaction for ERK activation was addressed through two different types of experiments. In the first approach we assessed the ability of ORF3 mutants to activate ERK. While pORF3 mutants lacking the C-terminal proline-rich motifs had no effect on ERK activation, the N-terminal deletion mutant lacking amino acids 1–32 of pORF3 was deficient in ERK activation. This N-terminal region is also the region through which pORF3 binds MKPs. There was, however, no measurable competition between ERK and pORF3 for binding to Pyst1. In the second approach, we evaluated ERK activity in cells ectopically expressing CL100 (MKP-1) or Pyst1 (MKP-3) in the absence or presence of pORF3. These experiments showed reduced ERK activity in cells expressing Pyst1. However, co-expression of pORF3 and Pyst1 protected ERK activity from the inactivating effects of the latter. Western blotting also showed similar results wherein phospho-ERK levels were higher in cells expressing pORF3. Together these results prove that the pORF3-directed ERK activation is due to the ability of pORF3 to bind the ERK-specific phosphatase MKP-3.
In vitro phosphatase assays carried out on lysates of transfected cells showed a direct inhibitory effect of the ORF3 protein on MKP-3 phosphatase activity. That an excess of pORF3 was required to inhibit MKP-3 activity in vitro was supported by other observations, including Western blotting of the cell lysates for anti-phospho-ERK. This might reflect that dimeric (or oligomeric) forms of pORF3 are required to bind and inhibit MKP-3. The binding of pORF3 dimers to Pyst1 and earlier observations on pORF3 dimerization (42) would support this premise.
Based on our results, we propose a model for the ERK activating property of pORF3 (Fig. 12). Activated ERK, phosphorylated at threonine and tyrosine within the TXY motif, can bind to MKP-3 through an N-terminal EB domain in the latter. This binding is known to result in a conformational change that brings the MKP-3 catalytic domain in close proximity to the phosphothreonine and phosphotyrosine residues resulting in their dephosphorylation and inactivation of ERK (59, 60). We show here that pORF3 binds to the linker region between the EB and catalytic domains of MKP-3. While this interaction would not preclude binding of ERK to MKP-3, it is likely to interfere with the conformational change in MKP-3 necessary for bringing its catalytic domain close to the phosphorylated residues. This would result in inhibition of ERK dephosphorylation (and inactivation) by MKP-3.
Fig. 12. Model for pORF3-mediated ERK activation.
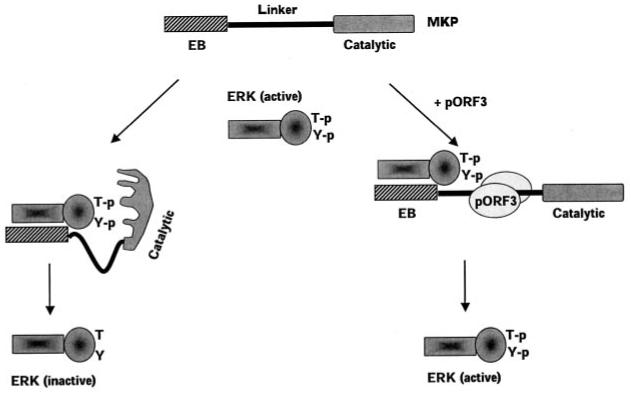
Binding of ERK to the EB domain of MKP-3 leads to a conformational change in the latter bringing its catalytic domain in close proximity to the phosphothreonine (T-p) and phosphotyrosine (Y-p) residues in activated ERK. This leads to dephosphorylation and inactivation of ERK. The ORF3 protein binds the linker region of MKP-3 (possibly as a dimer) and prevents the conformational change required for its activation following ERK binding to the EB domain. This results in catalytically inefficient MKP-3 and higher levels of active ERK.
Tumor antigens encoded by small DNA viruses such as SV40 and the polyoma virus target the cellular serine/threonine phosphatase 2A during transformation (61). By binding and inactivating phosphatase 2A, the SV40 small t antigen activates ERK and promotes mitogenic signaling (62) in addition to other effects such as activation of cell growth and NF-κB signaling through the protein kinase C-ζ isoform (63) and activation of the cell cycle through cyclic AMP-response element-binding protein-mediated cyclin D1 transcription (64). The inhibitory effect of these transforming viral proteins on a ubiquitous phosphatase has a generalized effect. Here we show the effect of pORF3 from HEV, an acutely infecting virus, on the ERK-specific dual specificity phosphatase MKP-3.
Why should HEV modulate the ERK signaling pathway? Proteins expressed by two other hepatitis viruses have been shown to activate this pathway. The hepatitis B virus X protein prevents the turnover of Ras-GTP resulting in activation of Ras and the downstream MAPK pathway in quiescent cells, forcing them to enter the S phase (65, 66). It also transactivates the epidermal growth factor receptor promoter (67); increased epidermal growth factor receptor density on hepatitis B virus-infected cells would promote cellular growth through increased epidermal growth factor/Ras/Raf/MEK/MAPK signaling. The hepatitis B virus middle surface antigen MHBs(t) can also trigger a protein kinase C-dependent activation of the Ras/MEK/ERK pathway (68). The core protein of hepatitis C virus forms the viral capsid; it has also been shown to activate the Raf-MEK-ERK cascade (69-71) independently of epidermal growth factor or transforming growth factor-α signaling. This activation is blocked by the MEK inhibitor PD98059, suggesting that the hepatitis C virus core protein functions either at or upstream of MEK (70). It also enhances Elk-1 activation in cell lines, without affecting ERK activity or Elk-1 phosphorylation, placing the effect downstream of MEK (71).
We show here that the ORF3 protein of HEV also activates ERK but uses an entirely different mechanism. Collectively our data provide the first example of a viral protein that activates cellular ERK primarily by inhibiting its cognate inactivating dual specificity phosphatase. Increased activation of cellular ERK would provide the signal necessary for regeneration of quiescent hepatocytes (72) as well as a survival signal crucial for overcoming the innate apoptotic responses that are triggered following viral infection of the host cell (73). Both these effects of ERK activation would aid the replication of these small hepatotropic viruses.
Acknowledgments
We thank Dr. S. Keyse for the MAPK phosphatase reagents, Dr. E. Nishida for the pSR-HA-Erk expression vector, and Dr. Gary Johnson for KD-ERK and KD-MEK1 expression constructs. The technical assistance of Ravinder Kumar, Charu Tanwar, Preeti Malik, and Syed Moin is gratefully acknowledged.
Footnotes
This work was supported by a grant from the Wellcome Trust, UK. The costs of publication of this article were defrayed in part by the payment of page charges. This article must therefore be hereby marked “advertisement” in accordance with 18 U.S.C. Section 1734 solely to indicate this fact.
- HEV
- hepatitis E virus
- ORF
- open reading frame
- MAPK
- mitogen-activated protein kinase
- ERK
- extracellular signal-regulated kinase
- pORF3
- ORF3 protein
- MEK
- MAPK/ERK kinase
- FRET
- fluorescence resonance energy transfer
- SH3
- Src homology 3
- PI3K
- phosphatidylinositol 3-kinase
- JNK
- c-Jun N-terminal kinase
- SAPK
- stress-activated protein kinase
- MKP
- MAPK phosphatase
- EGFP
- enhanced green fluorescent protein
- HA
- hemagglutinin
- GST
- glutathione S-transferase
- ECFP
- enhanced cyan fluorescent protein
- EYFP
- enhanced yellow fluorescent protein
- TBS
- Tris-buffered saline
- BSA
- bovine serum albumin
- MBP
- myelin basic protein
- PBS
- phosphate-buffered saline
- KD
- kinase-dead
- EB
- ERK-binding
REFERENCES
- 1.Purcell RH, Ticehurst JR. In: Viral Hepatitis and Liver Disease. Zuckerman AJ, editor. New York: Alan R. Liss; 1988. pp. 131–137. [Google Scholar]
- 2.Ramalingaswami V, Purcell RH. Lancet. 1988;1:571–573. doi: 10.1016/s0140-6736(88)91362-1. [DOI] [PubMed] [Google Scholar]
- 3.Krawczynski K. Hepatology. 1993;17:932–941. [PubMed] [Google Scholar]
- 4.Panda SK, Jameel S. Viral Hepatitis Rev. 1997;3:227–251. [Google Scholar]
- 5.Purcell RH, Emerson SU. In: Fields Virology. 4th Ed. Knipe DM, Howley PM, editors. Philadelphia: Lippincott Williams and Wilkins; 2001. pp. 3051–3061. [Google Scholar]
- 6.Khuroo MS, Teli MR, Skidmore S, Sofi MA, Khuroo M. Am. J. Med. 1981;70:252–255. doi: 10.1016/0002-9343(81)90758-0. [DOI] [PubMed] [Google Scholar]
- 7.Nayak NC, Panda SK, Datta R, Zuckerman AJ, Guha DK, Madangopalan N, Buckshee K. J. Gastroenterol. Hepatol. 1989;4:345–352. doi: 10.1111/j.1440-1746.1989.tb00846.x. [DOI] [PubMed] [Google Scholar]
- 8.Nanda SK, Yalcinkaya K, Panigrahi AK, Acharya SK, Jameel S, Panda SK. J. Med. Virol. 1994;42:133–137. doi: 10.1002/jmv.1890420207. [DOI] [PubMed] [Google Scholar]
- 9.Lau JY, Sallie R, Fang JW, Yarbough PO, Reyes GR, Portmann BC, Mieli-Vergani G, Williams R. J. Hepatol. 1995;22:605–610. doi: 10.1016/0168-8278(95)80215-0. [DOI] [PubMed] [Google Scholar]
- 10.Jameel S, Zafrullah M, Ozdener MH, Panda SK. J. Virol. 1996;70:207–216. doi: 10.1128/jvi.70.1.207-216.1996. [DOI] [PMC free article] [PubMed] [Google Scholar]
- 11.Zafrullah M, Ozdener MH, Panda SK, Jameel S. J. Virol. 1997;71:9045–9053. doi: 10.1128/jvi.71.12.9045-9053.1997. [DOI] [PMC free article] [PubMed] [Google Scholar]
- 12.Zafrullah M, Ozdener MH, Kumar R, Panda SK, Jameel S. J. Virol. 1999;73:4074–4082. doi: 10.1128/jvi.73.5.4074-4082.1999. [DOI] [PMC free article] [PubMed] [Google Scholar]
- 13.Tam AW, Smith MM, Guerra ME, Huang CC, Bradley DW, Fry KE, Reyes GR. Virology. 1991;185:120–131. doi: 10.1016/0042-6822(91)90760-9. [DOI] [PMC free article] [PubMed] [Google Scholar]
- 14.Koonin EV, Gorbalenya AE, Purdy MA, Rozanov MN, Reyes GR, Bradley DW. Proc. Natl. Acad. Sci. U. S. A. 1992;89:8259–8263. doi: 10.1073/pnas.89.17.8259. [DOI] [PMC free article] [PubMed] [Google Scholar]
- 15.Kabrane-Lazizi Y, Meng XJ, Purcell RJ, Emerson SU. J. Virol. 1999;73:8848–8850. doi: 10.1128/jvi.73.10.8848-8850.1999. [DOI] [PMC free article] [PubMed] [Google Scholar]
- 16.Agrawal S, Gupta D, Panda SK. Virology. 2001;282:87–101. doi: 10.1006/viro.2000.0819. [DOI] [PubMed] [Google Scholar]
- 17.Li TC, Yamakawa Y, Suzuki K, Tatsumi M, Razak MA, Uchida T, Takeda N, Miyamura T. J. Virol. 1997;71:7207–7213. doi: 10.1128/jvi.71.10.7207-7213.1997. [DOI] [PMC free article] [PubMed] [Google Scholar]
- 18.Zhang M, Emerson SU, Nguyen H, Engle R, Govindarjan S, Blackwelder WC, Gerin J, Purcell RH. Vaccine. 2002;20:3285–3291. doi: 10.1016/s0264-410x(02)00314-6. [DOI] [PubMed] [Google Scholar]
- 19.Li T, Takeda N, Miyamura T. Vaccine. 2001;19:3476–3484. doi: 10.1016/s0264-410x(01)00059-7. [DOI] [PubMed] [Google Scholar]
- 20.Korkaya H, Jameel S, Gupta D, Tyagi S, Kumar R, Zafrullah M, Mazumdar M, Lal SK, Xiaofang L, Sehgal D, Das SR, Sahal D. J. Biol. Chem. 2001;276:42389–42400. doi: 10.1074/jbc.M101546200. [DOI] [PubMed] [Google Scholar]
- 21.Robinson MJ, Cobb MH. Curr. Opin. Cell Biol. 1997;9:180–186. doi: 10.1016/s0955-0674(97)80061-0. [DOI] [PubMed] [Google Scholar]
- 22.Ip YT, Davis RJ. Curr. Opin. Cell Biol. 1998;10:205–219. doi: 10.1016/s0955-0674(98)80143-9. [DOI] [PubMed] [Google Scholar]
- 23.Davis RJ. In: Signaling Networks and Cell Cycle Control: The Molecular Basis of Cancer and Other Diseases. Silvio Gutkind J, editor. Totowa, NJ: Humana Press; 2000. pp. 3219–3256. [Google Scholar]
- 24.Keyse SM. Biochim. Biophys. Acta. 1995;1265:152–160. doi: 10.1016/0167-4889(94)00211-v. [DOI] [PubMed] [Google Scholar]
- 25.Keyse SM. Curr. Opin. Cell Biol. 2000;12:186–192. doi: 10.1016/s0955-0674(99)00075-7. [DOI] [PubMed] [Google Scholar]
- 26.Tonks NK, Neel BG. Curr. Opin. Cell Biol. 2001;13:182–195. doi: 10.1016/s0955-0674(00)00196-4. [DOI] [PubMed] [Google Scholar]
- 27.Alessi DR, Smythe C, Keyse SM. Oncogene. 1993;8:2015–2020. [PubMed] [Google Scholar]
- 28.Groom LA, Sneddon AA, Alessi DR, Dowd S, Keyse SM. EMBO J. 1996;15:3621–3632. [PMC free article] [PubMed] [Google Scholar]
- 29.Muda M, Boschert U, Dickinson R, Martinou JC, Martinou I, Camps M, Schlegel W, Arkinstall S. J. Biol. Chem. 1996;271:4319–4326. doi: 10.1074/jbc.271.8.4319. [DOI] [PubMed] [Google Scholar]
- 30.Theodosiou A, Smith A, Gillieron C, Arkinstall S, Ashworth A. Oncogene. 1999;18:6981–6988. doi: 10.1038/sj.onc.1203185. [DOI] [PubMed] [Google Scholar]
- 31.Rosenberg IM. Protein Analysis and Purification. Boston: Birkhauser; 1996. pp. 343–344. [Google Scholar]
- 32.Tyagi S, Korkaya H, Zafrullah M, Jameel S, Lal SK. J. Biol. Chem. 2002;277:22759–22767. doi: 10.1074/jbc.M200185200. [DOI] [PubMed] [Google Scholar]
- 33.Favata MF, Horiuchi KY, Manos EJ, Daulerio AJ, Stradley DA, Feeser WS, Van Dyk DE, Pitts WJ, Earl RA, Hobbs F, Copeland RA, Magolda RL, Scherle PA, Trzaskos JM. J. Biol. Chem. 1998;273:18623–18632. doi: 10.1074/jbc.273.29.18623. [DOI] [PubMed] [Google Scholar]
- 34.Vlahos CJ, Matter WF, Hui KY, Brown RF. J. Biol. Chem. 1994;269:5241–5248. [PubMed] [Google Scholar]
- 35.Kobayashi E, Nakano H, Morimoto M, Tamaoki T. Biochem. Biophys. Res. Commun. 1989;159:548–553. doi: 10.1016/0006-291x(89)90028-4. [DOI] [PubMed] [Google Scholar]
- 36.Northover BJ. Biochem. Pharmacol. 1992;44:425–432. doi: 10.1016/0006-2952(92)90432-i. [DOI] [PubMed] [Google Scholar]
- 37.Akiyama T, Ishida J, Nakagawa S, Ogawara H, Watanabe S, Itoh N, Shibuya M, Fukami Y. J. Biol. Chem. 1987;262:5592–5595. [PubMed] [Google Scholar]
- 38.Cohen PT. Trends Biochem. Sci. 1997;22:245–251. doi: 10.1016/s0968-0004(97)01060-8. [DOI] [PubMed] [Google Scholar]
- 39.Marshall CJ. Cell. 1995;80:179–185. doi: 10.1016/0092-8674(95)90401-8. [DOI] [PubMed] [Google Scholar]
- 40.Cano E, Mahadevan LC. Trends Biochem. Sci. 1995;20:117–122. doi: 10.1016/s0968-0004(00)88978-1. [DOI] [PubMed] [Google Scholar]
- 41.Cahill MA, Janknecht R, Nordheim A. Curr. Biol. 1996;6:16–19. doi: 10.1016/s0960-9822(02)00410-4. [DOI] [PubMed] [Google Scholar]
- 42.Tyagi S, Jameel S, Lal SK. J. Virol. 2001;75:2493–2498. doi: 10.1128/JVI.75.5.2493-2498.2001. [DOI] [PMC free article] [PubMed] [Google Scholar]
- 43.Siegel RM, Chan FK, Zacharias DA, Swofford R, Holmes KL, Tsien RY, Lenardo MJ. Science’s STKE. 2000 doi: 10.1126/stke.2000.38.pl1. http://stke.sciencemag.org/cgi/content/full/OC_sigtrans;2000/38/pl1. [DOI] [PubMed]
- 44.Zacharias DA. Science’s STKE. 2002 doi: 10.1126/stke.2002.131.pe23. http://stke.sciencemag.org/cgi/content/full/OC_sigtrans;2002/131/pe23. [DOI] [PubMed]
- 45.Kolch W, Heidecker G, Kochs G, Hummel R, Vahidi H, Mischak H, Finkenzeller G, Marme D, Rapp UR. Nature. 1993;364:249–252. doi: 10.1038/364249a0. [DOI] [PubMed] [Google Scholar]
- 46.Franke TF, Kaplan DR, Cantley LC, Toker A. Science. 1997;275:665–668. doi: 10.1126/science.275.5300.665. [DOI] [PubMed] [Google Scholar]
- 47.Rommel C, Clarke BA, Zimmermann S, Nunez L, Rossman R, Reid K, Moelling K, Yancopoulos GD, Glass DJ. Science. 1999;286:1738–1741. doi: 10.1126/science.286.5445.1738. [DOI] [PubMed] [Google Scholar]
- 48.Zimmermann S, Moelling K. Science. 1999;286:1741–1744. doi: 10.1126/science.286.5445.1741. [DOI] [PubMed] [Google Scholar]
- 49.Agell N, Bachs O, Rocamora N, Villalonga P. Cell. Signal. Rev. 2002;14:649–654. doi: 10.1016/s0898-6568(02)00007-4. [DOI] [PubMed] [Google Scholar]
- 50.Chien CT, Bartel PL, Sternglanz R, Fields S. Proc. Natl. Acad. Sci. U. S. A. 1991;88:9578–9582. doi: 10.1073/pnas.88.21.9578. [DOI] [PMC free article] [PubMed] [Google Scholar]
- 51.Truong K, Ikura M. Curr. Opin. Struct. Biol. 2001;11:573–578. doi: 10.1016/s0959-440x(00)00249-9. [DOI] [PubMed] [Google Scholar]
- 52.Gordon GW, Berry G, Liang XH, Levine B, Herman B. Biophys. J. 1998;74:2702–2713. doi: 10.1016/S0006-3495(98)77976-7. [DOI] [PMC free article] [PubMed] [Google Scholar]
- 53.Xia Z, Liu Y. Biophys. J. 2001;81:2395–2402. doi: 10.1016/S0006-3495(01)75886-9. [DOI] [PMC free article] [PubMed] [Google Scholar]
- 54.Tanoue T, Adachi M, Moriguchi T, Nishida E. Nat. Cell Biol. 2000;2:110–116. doi: 10.1038/35000065. [DOI] [PubMed] [Google Scholar]
- 55.Muda M, Theodosiou A, Gillieron C, Smith A, Chabert C, Camps M, Boschert U, Rodrigues N, Davies K, Ashworth A, Arkinstall S. J. Biol. Chem. 1998;273:9323–9329. doi: 10.1074/jbc.273.15.9323. [DOI] [PubMed] [Google Scholar]
- 56.Tanoue T, Moriguchi T, Nishida E. J. Biol. Chem. 1999;274:19949–19956. doi: 10.1074/jbc.274.28.19949. [DOI] [PubMed] [Google Scholar]
- 57.Farooq A, Chaturvedi G, Mujtaba S, Plotnikova O, Zeng L, Dhalluin C, Ashton R, Zhou MM. Mol. Cell. 2001;7:387–399. doi: 10.1016/s1097-2765(01)00186-1. [DOI] [PubMed] [Google Scholar]
- 58.Tanoue T, Yamamoto T, Nishida E. J. Biol. Chem. 2002;277:22942–22949. doi: 10.1074/jbc.M202096200. [DOI] [PubMed] [Google Scholar]
- 59.Camps M, Nichols A, Gillieron C, Antonsson B, Muda M, Chabert C, Boschert U, Arkinstall S. Science. 1998;280:1262–1265. doi: 10.1126/science.280.5367.1262. [DOI] [PubMed] [Google Scholar]
- 60.Stewart AE, Dowd S, Keyse SM, McDonald NQ. Nat. Struct. Biol. 1999;6:174–181. doi: 10.1038/5861. [DOI] [PubMed] [Google Scholar]
- 61.Mumby M. Semin. Cancer Biol. 1995;6:229–237. doi: 10.1006/scbi.1995.0030. [DOI] [PubMed] [Google Scholar]
- 62.Sontag E, Federov S, Kamibayashi C, Robbins D, Cobb MH, Mumby M. Cell. 1993;75:889–897. doi: 10.1016/0092-8674(93)90533-v. [DOI] [PubMed] [Google Scholar]
- 63.Sontag E, Sontag JM, Garcia A. EMBO J. 1997;16:5662–5671. doi: 10.1093/emboj/16.18.5662. [DOI] [PMC free article] [PubMed] [Google Scholar]
- 64.Watanabe G, Howe A, Lee RJ, Albanese C, Shu IW, Karnezis AN, Zon L, Kyriakis J, Rundell K, Pestell RG. Proc. Natl. Acad. Sci. U. S. A. 1996;93:12861–12866. doi: 10.1073/pnas.93.23.12861. [DOI] [PMC free article] [PubMed] [Google Scholar]
- 65.Benn J, Schneider RJ. Proc. Natl. Acad. Sci. U. S. A. 1994;91:10350–10354. doi: 10.1073/pnas.91.22.10350. [DOI] [PMC free article] [PubMed] [Google Scholar]
- 66.Benn J, Schneider RJ. Proc. Natl. Acad. Sci. U. S. A. 1995;92:11215–11219. doi: 10.1073/pnas.92.24.11215. [DOI] [PMC free article] [PubMed] [Google Scholar]
- 67.Menzo S, Clementi M, Alfani E, Bagnarelli P, Iacovacci S, Manzin A, Dandri M, Natoli G, Levrero M, Carloni G. Virology. 1993;196:878–882. doi: 10.1006/viro.1993.1550. [DOI] [PubMed] [Google Scholar]
- 68.Hildt E, Munz B, Saher G, Reifenberg K, Hofschneider PH. EMBO J. 2002;21:525–535. doi: 10.1093/emboj/21.4.525. [DOI] [PMC free article] [PubMed] [Google Scholar]
- 69.Giambartolomei S, Covone F, Levrero M, Balsano C. Oncogene. 2001;20:2606–2610. doi: 10.1038/sj.onc.1204372. [DOI] [PubMed] [Google Scholar]
- 70.Hayashi J, Aoki H, Kajino K, Moriyama M, Arakawa Y, Hino O. Hepatology. 2000;32:958–961. doi: 10.1053/jhep.2000.19343. [DOI] [PubMed] [Google Scholar]
- 71.Fukuda K, Tsuchihara K, Hijikata M, Nishiguchi S, Kuroki T, Shimotohno K. Hepatology. 2001;33:159–165. doi: 10.1053/jhep.2001.20794. [DOI] [PubMed] [Google Scholar]
- 72.Rescan C, Coutant A, Talarmin H, Theret N, Glaise D, Guguen G. Mol. Biol. Cell. 2001;12:725–738. doi: 10.1091/mbc.12.3.725. [DOI] [PMC free article] [PubMed] [Google Scholar]
- 73.O’Brien V. J. Gen. Virol. 1998;79:1833–1845. doi: 10.1099/0022-1317-79-8-1833. [DOI] [PubMed] [Google Scholar]