

Abstract
Mice deficient in the expression of vitamin D-binding protein (DBP) are normocalcemic despite undetectable levels of circulating 1,25-dihydroxyvitamin D3 [1,25(OH)2D3]. We used this in vivo mouse model together with cells in culture to explore the impact of DBP on the biological activity of 1,25(OH)2D3. Modest changes in the basal expression of genes involved in 1,25(OH)2D3 metabolism and calcium homeostasis were observed in vivo; however, these changes seemed unlikely to explain the normal calcium balance seen in DBP-null mice. Further investigation revealed that despite the reduced blood levels of 1,25(OH)2D3 in these mice, tissue concentrations were equivalent to those measured in wild-type counterparts. Thus, the presence of DBP has limited impact on the extracellular pool of 1,25(OH)2D3 that is biologically active and that accumulates within target tissues. In cell culture, in contrast, the biological activity of 1,25(OH)2D3 is significantly impacted by DBP. Here, although DBP deficiency had no effect on the activation profile itself, the absence of DBP strongly reduced the concentration of exogenous 1,25(OH)2D3 necessary for transactivation. Surprisingly, analogous studies in wild-type and DBP-null mice, wherein we explored the activity of exogenous 1,25(OH)2D3, produced strikingly different results as compared with those in vitro. Here, the carrier protein had virtually no impact on the distribution, uptake, activation profile, or biological potency of the hormone. Collectively, these experiments suggest that whereas DBP is important to total circulating 1,25(OH)2D3 and sequesters extracellular levels of this hormone both in vivo and in vitro, the binding protein does not influence the hormone’s biologically active pool.
VITAMIN D AND its activated metabolites are highly lipophilic and are therefore generally found in the circulation bound to vitamin D-binding protein (DBP), an evolutionarily conserved, highly abundant serum Gc-globulin that is produced by the liver (1,2,3). The ability of circulating DBP to bind vitamin D sterols suggests that this protein may facilitate the dispersal of lipophilic vitamin D molecules from their sites of synthesis to sites of either metabolic conversion or regulatory action (4,5,6,7). DBP-bound sterols may also represent reservoirs available for use during normal physiological circumstances or during times of reduced intake or limited production (8,9). An extensive body of literature (summarized in Refs. 1 and 9) as well as primary studies in a DBP-deficient mouse strain (10) provide considerable support for these likely roles for DBP in modulating components that are central to the regulation of calcium homeostasis.
1,25-Dihydroxyvitamin D3 [1,25(OH)2D3], the active form of vitamin D3, is generally believed to enter target cells by diffusion and then to interact with a cytoplasmic/nuclear vitamin D receptor (VDR) protein that localizes to enhancer regions of target genes where it modifies their transcriptional activity (11,12,13). The free hormone hypothesis suggests that the source of this diffusible hormone is derived from a small pool of ligand in the blood that is either free (unbound) or bound to nonspecific or low-affinity carrier proteins such as albumin (8). It has been proposed that this pool of 1,25(OH)2D3 exists in dynamic equilibrium with that which is bound to DBP. If this hypothesis is correct, the removal of DBP should lead to both a striking reduction in the levels of total circulating vitamin D sterols and perhaps to an overall reduction in biologically active levels as well. Recent studies suggest, however, that this is only partially true. Accordingly, although genetic ablation of the DBP gene leads to a striking decrease in the total circulating levels of both 1,25(OH)2D3 and its precursor 25-hydroxyvitamin D3 (25OHD3), this reduction does not result in a change in calcium homeostasis (10). Indeed, this phenotype recapitulates patients with severe liver disease, wherein despite reduced levels of circulating DBP and total 1,25(OH)2D3 levels, calcium status appears unperturbed (14,15). How normocalcemia is maintained in the presence of strikingly reduced levels of the vitamin D hormone remains unclear.
This dramatic decrease in the level of total circulating 1,25(OH)2D3 that is coincident with DBP deficiency in both patients as well as in genetically engineered mice is similar to that found in other steroid hormone systems. Thus, natural mutations in either corticosteroid-binding globulin (CBG) (16) or T4-binding globulin (TBG) (17,18) can result in striking reductions in total circulating cortisol or in both T4 and T3 levels, respectively. One of these defects has been also recapitulated in a mouse model (19). Although minor changes in the levels of free hormone have been noted in some circumstances, the phenotypes of patients with CBG and TBG deficiencies and indeed in the mouse model are extremely modest. Accordingly, patients with CBG deficiency display mild hypotension and fatigue, whereas those with TGB deficiency can experience subclinical thyrotoxicosis (16,18). Although these and additional examples suggest that carrier proteins such as DBP play a minimal role in regulating target cell activity, their global impact on underlying hormonal physiology is perhaps more expansive as suggested above.
A number of vitamin D analogs have been synthesized over the past decade, with the goal of identifying modified versions of 1,25(OH)2D3 that exhibit properties exploitable therapeutically for diseases such as psoriasis, autoimmune disease, and cancer (20,21). Some appear to manifest superagonist properties in vitro and to act at concentrations that are much lower than those for 1,25(OH)2D3 (22,23). Others do not appear to be 1,25(OH)2D3-like in their ability to induce hypercalcemia in vivo and have therefore been classified as both tissue selective and noncalcemic in nature (24,25). Interestingly, many of these analogs do not bind to DBP (6), suggesting the possibility that this feature may contribute to their unusual biological activities. An alternative explanation, however, is that these vitamin D analogs induce novel conformations within the VDR protein that are ligand specific and that function to provoke unique downstream biological responses (26,27,28,29). Although selective receptor-mediated properties have been firmly established for hormonal ligands in the sex steroid arena (30), these properties have not been convincingly demonstrated for analogs that regulate the vitamin D endocrine system.
In the present report, we extend the phenotype of the DBP-null mouse and explore the relationship that exists between DBP and the activation of biological responses by hormonal 1,25(OH)2D3. We show that although the loss of DBP results in a reduction in total levels of circulating 1,25(OH)2D3, tissue levels of this sterol remain unaffected. This appears to underlie the normal biological activities that are characteristic of target tissues responsible for calcium homeostasis in these DBP-deficient mice. These findings suggest that the pool of 1,25(OH)2D3 that is capable of entering cells and activating transcription in vivo is largely unaffected by perturbations in the pool of ligand that is bound to DBP. Additional studies in vitro and in vivo using both 1,25(OH)2D3 as well as several novel analogs of the vitamin D hormone support this principle.
Materials and Methods
Reagents
General biochemicals were obtained from Fisher (Pittsburgh, PA) and Sigma-Aldrich Chemical Co. (St. Louis, MO). α-MEM was purchased from Life Technologies (Grand Island, NY). Oligonucleotide primers were obtained from IDT (Coralville, IA). Anti-VDR (H-81) was obtained from Santa Cruz Biotechnology, Inc. (Santa Cruz, CA). Anti-VDR-9A7 has been described previously (31). Zysorbin was obtained from Invitrogen (Carlsbad, CA). Rodent diets were obtained from Harlan-Teklad (Madison, WI) or Research Diets (New Brunswick, NJ).
Vitamin D compounds
Tritiated 1,25(OH)2D3 (166 Ci/mmol) was purchased from Perkin-Elmer (Boston, MA). Radioinert 1,25(OH)2D3 was obtained from Solvay (da Weesp, The Netherlands). MC1288 [20-ep-1,25(OH)2D3] and KH1060 [20-epi-22-oxa-24a,26a,27a-tri-homo-1,25(OH)2D3] were kindly provided by Dr. Lise Binderup of Leo Pharma, Inc. (Ballerup, Denmark). The chemical structures of these two compounds as well as 1,25(OH)2D3 are indicated in Fig. 1.
Figure 1.

Molecular structures of 1α,25 (OH)2D3, MC1288 [20-epi-1α,25(OH)2D3] and KH1060 [20-epi-22-oxa, 24a, 26a, 27a-tri-homo-1α,25(OH)2D3].
Cell culture
MC3T3-E1 cells were cultured in α-MEM supplemented with 10% fetal bovine serum (FBS) from BioWhittaker (Walkerville, MD). Cell cultures were supplemented with 10% FBS and allowed to expand for 48 h. Upon confluence and immediately before the experiment, culture medium was removed, the cells were briefly washed with PBS, and fresh medium with or without the indicated concentration of FBS or specific mouse serum was reintroduced. 1,25(OH)2D3 and other ligands were then added to the cells in ethanol (1% maximum final concentration) for the periods indicated.
Intact cell ligand binding assay
MC3T3-E1 cells were seeded at high density (5 × 10⁵ cells per well) into 24-well plates and cultured overnight in normal FBS-supplemented α-MEM. The culture medium was replaced with fresh medium with or without added 10% FBS. 1,25(OH)2D3 (166 Ci/mmol, 1 nm) was then added to the cells at the indicated concentrations with or without a 250-fold molar excess of radioinert 1,25(OH)2D3 and allowed to incubate for the times indicated. After incubation, the cells were washed, lysed in 10 mm Tris-HCl (pH 7.4), 0.3 m KCl, and 1 mm dithiothreitol containing 1% Nonidet P-40, and the soluble fraction subjected to a hydroxyapatite assay to assess total and nonspecific 1,25(OH)2D3 as previously described (32). The difference between total binding and nonspecific binding represented a measure of specific VDR-bound ligand. The validity of this assay in these cells was confirmed by using an immunoprecipitation assay with agarose-coupled anti-VDR 9A7 antibody (data not shown). Radioactivity measurements were carried out using a Packard Tricarb 2900TR scintillation spectrometer.
Western blot analysis
MC3T3-E1 cells were plated in six-well dishes (1 × 10⁵ cells/ml) and treated the following day with vehicle, 1,25(OH)2D3, MC1288, or KH1060 for the indicated time periods. Cells were washed twice with PBS and then dissolved directly on the plates using 10 mm Tris-HCl (pH 7.4), 0.3 m NaCl, 1 mm dithiothreitol, and 1% Nonidet P-40. Cell lysates were harvested and centrifuged briefly, and the supernatant was evaluated for protein content. Samples (30 μg) were subjected to SDS-PAGE on 4–20% gradient gels. Proteins were transferred to Immunoblot polyvinylidene difluoride membranes (Bio-Rad, Hercules, CA) and subjected to Western blot analysis using the anti-VDR monoclonal antibody 9A7 as previously described (31). Images were developed using the ECL kit from Perkin-Elmer and quantitated densitometrically using Kodak 1D Image Analysis (software version 3.5). Densitometric plots were evaluated using the PRIZM statistical package.
RNA isolation and analysis
MC3T3-E1 cells were plated in six-well dishes (1 × 10⁵ cells/ml) and cultured overnight in normal FBS-supplemented α-MEM. The culture medium was then replaced with fresh medium with or without 10% FBS or with fresh medium containing either 7% DBP+/+ or 7% DBP−/− mouse serum. The cells were then treated with increasing concentrations of vehicle, 1,25(OH)2D3, MC1288, or KH1060 for a period of 6 h. Total RNA was isolated using the Trizol reagent obtained from MRC (Cincinnati, OH) and quantitated by standard spectrophotometry. The isolated RNA was reverse transcribed using the SuperScript II RNase H reverse transcriptase kit from Invitrogen and then subjected to standard PCR analysis as described in the figure legends. Primers used to detect specific transcripts include those for mouse (m) β-actin (mβ-actin) (forward, TGTTTGAGACCTTCAACACCC; reverse, CGTTGCCAATAGTGATGACCT), mCyp24a1 (forward, ACAGTCTTAACACTAAATACCCAA; reverse, CCAGCAA-AGAGCCAAGTGGAGCTG), or mRANKL (forward, GAATCCTGAGACTCCATGAAAACGC; reverse, CCATGAGCCTTCCATCATAGCTGG). In some cases, images were quantitated densitometrically using Kodak 1D Image Analysis (software version 3.5) and evaluated using the PRIZM statistical package.
Chromatin immunoprecipitation (ChIP) assays
ChIP was performed as described previously (33,34). Briefly, MC3T3-E1 cells were treated for 6 h with increasing concentrations of 1,25(OH)2D3 in the absence or presence of 10% FBS. The treated cells were then washed several times with PBS and subjected to a 15-min cross-linking reaction with 1.5% formaldehyde. After the cross-linking reaction, isolated cell extracts were sonicated to prepare chromatin fragments (average DNA size of 500–600 bp DNA as assessed by agarose gel electrophoresis) using a Fisher Model 100 Sonic Dismembranator at a power setting of 1. Precleared samples were then subjected to immunoprecipitation using antibodies to either control IgG or anti-VDR (C-20). The precipitated DNA was washed, the cross-links reversed, and the DNA fragments purified using QIAGEN QIAquick PCR purification kits (Valencia, CA). The isolated DNA [or DNA acquired before precipitation (input)] was then subjected to PCR analysis using primers designed to amplify fragments of murine Cyp24 promoter (−234 to −51) or murine OPN promoter (−854 to −658) reported previously (33). PCR products were resolved on 2% agarose gels and visualized using ethidium bromide staining. Densitometric quantitation was carried out using Kodak 1D Image Analysis (software version 3.5).
Animals
Vitamin D binding protein gene (DBP−/−) null mice in a C57BL/6 genetic background (10) were maintained in the Biochemistry Animal Care facility at the University of Wisconsin-Madison. All animal husbandry was conducted according to protocols on file with the University of Wisconsin-Madison Research Animal Resource Center and approved by Institutional Animal Care and Use Committee of this institution. We compared 7- to 8-wk-old female homozygous DBP−/− mice with DBP +/+ control mice of similar age and sex. All mice were genotyped using a standard PCR protocol employing primers identified previously (10). Additional C57BL/6 mice were obtained from Harlan and maintained in the same animal facility. Mice were maintained on a standard purified diet obtained from Research Diets (AIN-76A) or transiently on a vitamin D- and calcium-deficient diet containing strontium (Teklad 00562). This latter manipulation modestly reduced circulating levels of 1,25(OH)2D3 (<10%) and calcium (<1 mg/dl) and facilitated measurements of TRPV5 and TRPV6 mRNA induction.
Steady-state in vivo studies
Homozygous DBP−/− and homozygous DBP+/+ littermates maintained on a standard diet were used to measure serum levels of calcium and both serum and tissue levels of 1,25(OH)2D3. Blood was obtained via retroorbital or axial bleed and allowed to clot at room temperature, and the serum was recovered after a brief centrifugation and stored at −20 C before analysis. The first 2 cm of intestine was obtained from DBP−/− and DBP+/+ control mice (8-wk-old females, five per group), the intestinal contents flushed with PBS, and the cleansed tissues frozen and stored at −80 C.
Serum calcium.
Serum calcium levels were determined using flame atomic absorption spectrophotometry (model 3110; PerkinElmer, Norwalk, CT).
Serum 1,25(OH)2D3.
Serum 1,25(OH)2D3 was measured using solid-phase extraction/silica purification chromatography followed by a RIA with a sensitivity of 5 pg/ml 1,25(OH)2D3 as previously described (35). To achieve a more robust detection limit for circulating 1,25(OH)2D3 in DBP-null mice, serum collected from six homozygous mice (1.5 ml total) was extracted using a solid-phase C18OH silica cartridge (DiaSorin Corp., Stillwater, MN) as described above (35,36). The 1,25(OH)2D3-containing fraction from this column was dried under N2 and further purified by normal-phase HPLC using a Zorbax-sil column (Agilent Technologies) (5 μm, 25 × 0.4 cm) developed in hexane-isopropanol (80:20, vol/vol) at a flow rate of 2 ml/min. Peak fractions containing 1,25(OH)2D3 were then collected, dried, resuspended in ethanol and quantitated using the RIA for 1,25(OH)2D3 described above. Under these conditions, the limit of detection was reduced to 1 pg/ml 1,25(OH)2D3. Recovery was estimated in separate plasma samples using [3H]1,25(OH)2D3, because the addition of even a small amount of mass from isotopic 1,25(OH)2D3 could be detected by the RIA and falsely elevate the endogenous measurement.
Tissue 1,25(OH)2D3.
Tissue levels of 1,25(OH)2D3 were determined in a similar manner. In brief, individual tissue samples (∼250 mg each) were homogenized in 4 vol PBS, vortex-mixed in an equal volume of acetonitrile, and adjusted with an equal volume of K2PO4, and the supernatant was obtained after centrifugation. The samples were individually applied to a C18OH silica cartridge (DiaSorin), and the 1,25(OH)2D3 eluted in hexane-isopropanol (98:2). The 1,25(OH)2D3-containing samples were subjected to RIA as documented above (35). The concentrations of 1,25(OH)2D3 were reported as picograms per gram wet tissue.
RNA analysis.
Eight-week-old female homozygous DBP−/− and homozygous DBP+/+ littermate controls (five per group) maintained on a standard diet were used to quantitate the levels of selected mRNA transcripts in the intestine and kidney. A single kidney and a portion of the intestine (2 cm) were isolated after the animal was killed and was washed and/or flushed thoroughly in ice-cold PBS, immersed directly in Trizol reagent (MRC), frozen in a dry ice/ethanol bath, and stored at −80 C before extraction. Samples were individually thawed and subjected to tissue homogenization using 3- to 5-sec bursts with a tissue-mizer fitted with a 0.5-cm grinder. The homogenates were centrifuged and total RNA isolated as described by the manufacturer. After spectrophotometric quantitation, the RNA was reverse transcribed using the Superscript III RNase H reverse transcriptase kit obtained from Invitrogen and then subjected to PCR analysis using a real-time (q) PCR (qRT-PCR) technique. The LightCycler FastStart DNA Master SYBR Green 1 kit was obtained from Roche (Indianapolis, IN). Primers used for qRT-PCR included those for mβ-actin (forward, TGTTTGAGACCTTCAACACCC; reverse, CGTTGCCAATAGTGATGACCT), mCyp24a1 (forward, GTGCGGATTTCCTTTGTGATA; reverse, GGTAGCGTGTATTCACCCAGA), mCyp27b1 (forward, ATCGCAGAACCACCATCTTT; reverse, GCATCAACGAACACTACAGGAT), mTRPV6 (forward, CTCCACAACTCCTTTATCTTGG; reverse, AGTGTTCTCCATCCGTCGTCT), mCaD9K (forward, CTGGATAAGAATGGCGATGG; reverse, ACGTGTCTCCGAACTTGCTTTA), mPMCA1b (forward, GCTCTCATC-TCACGCACGAT; reverse, GCATCAGCACAAAGGTATTGA), mTRPV5 (forward, CTGGTATCTGTGGTTGCGAATA; reverse, GCTGCTTAGGGATGTAGTCCT), and mCaD28K (forward, GTCCTCTGCTGGTTATTGGTG; reverse, TGTATCACTTCTCCCCATCC. Relevant mRNA products were all normalized to those of mβ-actin.
Dynamic in vivo studies
Homozygous DBP−/− and DBP+/+ littermates were used to investigate the kinetic of 1,25(OH)2D3 uptake into blood and tissues and to evaluate biological responses to 1,25(OH)2D3 as a function of concentrations.
1,25(OH)2D3 uptake.
Eight-week-old female homozygous DBP−/− and DBP+/+ controls (three per group) maintained on a standard diet were treated with a single ip injection containing 1 microcurie (μCi) tritiated 1,25(OH)2D3 (166 Ci/mmol) and 10 ng/g body weight (bw) of radioinert 1,25(OH)2D3 in polypropylene glycol. Individual groups of mice were killed at 30, 60, 180, and 360 min, and both blood and kidneys were removed for further analysis. Samples were digested in concentrated nitric acid and triplicate aliquots evaluated for total tritium using a Packard Tricarb 2900TR scintillation spectrometer. Total radioactivity was averaged and reported as the mean ± sem.
In vivo mRNA response.
Eight-week-old female homozygous DBP−/− and DBP+/+ controls (five per group) were each treated with a single ip injection of 1,25(OH)2D3 from 0–100 ng/g bw (in polypropylene glycol). The individual groups of mice were killed at 6 h, and both the intestine and kidneys harvested, frozen directly in Trizol reagent (MRC) in a dry ice/ethanol bath, and stored at −80 C before extraction. Total RNA was isolated as described above and then subjected to qRT-PCR analysis using the primer sets identified. mRNA transcripts were normalized to those of mβ-actin.
Serum calcium response.
Eight-week-old female homozygous DBP−/− and DBP+/+ controls (five per group) were each treated with a single ip injection of 1,25(OH)2D3 (0, 0.01, 1, or 10 ng/g bw in polypropylene glycol). Mice were anesthetized at 0, 24, and 28 h and subjected to a retroorbital bleed. Samples were prepared and analyzed for serum calcium content as described above.
Statistical analyses
Unpaired t tests and EC50 calculations (as determined by nonlinear regression analysis with sigmoidal dose-response curves) were performed using the GraphPad PRISM version 4 statistical software package from GraphPad Software Inc. (San Diego, CA).
Results
DBP-null mice are normocalcemic in the presence of strikingly reduced blood levels of 1,25(OH)2D3
The results presented in Fig. 2 confirm a previous observation that disruption of the DBP gene in the mouse leads to a phenotype in which normal serum calcium levels coexist with drastically reduced concentrations of circulating 1,25(OH)2D3 (10). Because, as seen in Fig. 2B, the levels of 1,25(OH)2D3 in DBP-null mice were below the detection limits for our standard RIA (5 pg/ml), we carried out an additional analysis using larger serum volumes and a more refined assay (see Materials and Methods) with a detection limit that was considerably lower (1 pg/ml). Surprisingly, the circulating levels of 1,25(OH)2D3 in the genetically altered mice were below the level of detection in this assay as well (<1 pg/ml). This low level of circulating 1,25(OH)2D3 together with normal blood levels of both calcium and PTH (observed in the earlier pioneering study) (10) strengthen the concept that DBP-null mice exist in a quasi-normal physiological state with regard to calcium homeostasis.
Figure 2.

Serum concentrations of calcium and 1,25(OH)2D3 in wild-type and DBP-null mice. A, Serum calcium content. Serum was collected from 8-wk-old female DBP-null mice and their comparable controls maintained on a standard synthetic diet and analyzed for calcium content by atomic absorption spectrophotometry. The histograms reflect the means ± sem (n = 5). B, Serum 1,25(OH)2D3 content. Serum was collected from eight week old female DBP-null mice and their comparable controls as above and evaluated for 1,25(OH)2D3 content by RIA as described in the Materials and Methods. The histograms reflect the means ± sem (n = 5). *, P < 0.05 vs. wild-type control levels of 1,25(OH)D3.
Adaptations in gene expression do not explain normal tissue responses to 1,25(OH)2D3
In view of the significant correlation that normally exists between extracellular calcium concentrations and 1,25(OH)2D3 and PTH levels, we explored this interesting phenotype further. We began by measuring the levels of mRNAs for the metabolic enzymes responsible for both producing (Cyp27b1) as well as degrading (Cyp24a1) 1,25(OH)2D3 in the kidney (37). We also explored the hypothesis that normocalcemia might be maintained through a physiological adaptation in DBP-null mice that produced an increase in the levels of mRNAs for genes involved in calcium uptake in the intestine and reabsorption by the kidney (38). As observed in Fig. 3A, the abundance of Cyp27b1 transcripts in DBP-null mouse kidneys was twice that of their wild-type counterparts. Cyp24a1 transcripts, on the other hand, were reduced in the kidney by almost 80%. Despite this, the levels of mRNA for intestinal TRPV6, calbindin D9k, and PMCA1b and renal TRPV5 in the DBP-null mice as seen in Fig. 3B were generally not significantly different from those of wild-type mice, and the level of renal calbindin D28k mRNA was only modestly reduced. We interpret these data to suggest that whereas changes in the expression of metabolic and calcium transport mRNAs may contribute, they cannot explain fully the ability of DBP-null mice to maintain normal calcium homeostasis.
Figure 3.

Target gene expression levels in the intestine and kidney of wild-type and DBP-null mice. A, Kidney content of mRNA transcripts for Cyp24a1 and Cyp27b1. Kidneys were isolated from both wild-type and DBP-null mice (age and sex as in Fig. 2) and the isolated RNA subjected to qRT-PCR to quantitate levels of Cyp24a1 and Cyp27b1 as described in Materials and Methods. Specific mRNA content was normalized to mβ-actin. The histograms reflect the means ± sem (n = 5). *, P < 0.05 vs. wild-type levels of Cyp24a1 or Cyp27b1 transcripts. B, Intestinal and kidney content of mRNA transcripts for calcium-regulating target genes. The intestines and kidneys were isolated from both wild-type and DBP-null mice (age and sex as above) and the isolated RNA subjected to qRT-PCR as above to quantitate levels of intestinal TRPV6, CaD9K, and PMCA1b and renal TRPV5 and CaD28K mRNA. Content was normalized as in A. The histograms reflect the means ± sem (n = 5). *, P < 0.05 vs. wild-type levels of Cyp24a1, Cyp27b1 or CaD28K transcripts.
DBP-null mice maintain normal tissue levels of 1,25(OH)2D3
In light of these results, we focused upon the possibility that although loss of DBP expression dramatically altered the level of 1,25(OH)2D3 in the circulation, the level of this hormone within target tissues might be sustained. We therefore harvested intestinal tissue from both wild-type and DBP-null mice and measured the levels of 1,25(OH)2D3 therein. The results in Fig. 4 confirm our hypothesis that the concentration of 1,25(OH)2D3 in intestinal tissues is not reduced in DBP-null mice. Rather, the levels of the hormone were at least equivalent to if not modestly elevated above the levels found in wild-type mice. In fact, it is possible that the minor elevation of 1,25(OH)2D3 observed in the intestine could be responsible for the modest increases in the expression of TRPV6 and CaD9K seen in the previous experiment. These results indicate that the tissues of DBP-null mice are capable of accumulating significant concentrations of 1,25(OH)2D3 even in the presence of what appears to be a striking intracellular-extracellular gradient with respect to the hormone. Apparently, although the loss of DBP had a profound influence on the levels of total circulating 1,25(OH)2D3, this loss had a minimal impact on the pool of bioavailable 1,25(OH)2D3 required to maintain calcium homeostasis. These data also support the idea that DBP synthesis is not required for either the dispersal of 1,25(OH)2D3 from its renal site of synthesis to other organs or for the uptake of this endocrine ligand into specific target tissues.
Figure 4.
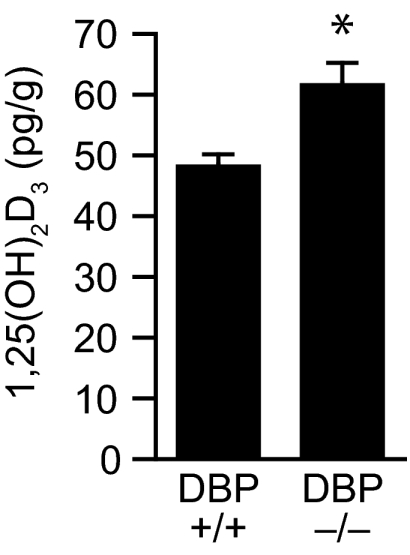
Concentrations of 1,25(OH)2D3 in intestinal tissue of wild-type and DBP-null mice. Serum was collected from DBP-null mice and their wild-type littermates (age and sex as in Fig. 2) and subjected to solid-phase extraction chromatography and RIA as described in Materials and Methods. The histograms reflect the means ± sem (n = 5). *, P < 0.05 vs. wild-type levels of 1,25(OH)2D3.
DBP reduces the effective concentration of exogenous 1,25(OH)2D3 necessary for gene activation in MC3T3-E1 cells in vitro but does not alter the activation profile
The above studies suggested that the elimination of DBP from the blood resulted in a striking reduction in the circulating levels of 1,25(OH)2D3. This finding appears analogous to that which has been observed in cell culture models (32,39,40,41), an example of which is depicted in Fig. 5. Here, equivalent activation of Cyp24a1 gene expression by 1,25(OH)2D3 in the bone osteoblastic cell line MC3T3-E1 is achieved using a two-log lower concentration of exogenously added hormone when the experiments were conducted either in the presence of serum devoid of DBP or in the complete absence of sera. In the latter case, the complete lack of serum had no effect on biological response due to the acute nature of the experiment itself. This DBP-induced change in the apparent biological potency of 1,25(OH)2D3 in MC3T3-E1 cells was also observed at additional target genes such as OPN, RANKL, and the VDR itself as well as in other cell types (data not shown). Interestingly, although in this in vitro system, much lower concentrations of 1,25(OH)2D3 (see above) were required for equivalent activation in the absence of DBP, the biological response to increasing concentrations of 1,25(OH)2D3 was dose dependent. However, neither the overall efficacy of the ligand (the maximal level of response elicited) nor the gene activation profile itself (shape of the induction curve) was significantly altered. These observations indicate that DBP does not directly influence the pool of ligand that is biologically active. These conclusions are strengthened by results obtained using the 1,25(OH)2D3 analogs KH1060 and MC1288 (see compound structures in Fig. 1), both of which do not bind to DBP yet interact with the VDR with an affinity generally equivalent to that of 1,25(OH)2D3 (42). As shown in Fig. 5A, the biological activity of KH1060 (equivalent MC1288 data not shown) was unaffected by the presence or absence of DBP and was similar to that elicited by 1,25(OH)2D3 when the latter’s activity was assessed in the absence of DBP.
Figure 5.

The effects of DBP on the biological activity of 1,25(OH)2D3 and the 1,25(OH)2D3 analog KH1060 in osteoblastic MC3T3-E1 cells. A, Serum increases the concentration of 1,25(OH)2D3 necessary for activation. MC3T3-E1 cells were treated in the presence or absence of serum with increasing concentrations of either 1,25(OH)2D3 or KH1060. RNA isolated at 6 h was subjected to RT-PCR analysis to detect Cyp24a1 and mβ-actin mRNA transcript levels. Analysis of cells induced in the absence of serum included a single group that was incubated in the presence of serum and 1,25(OH)2D3 to control for overall efficacy. This experiment is representative of six to eight similar experiments. B, The effect of serum on the biological potency of 1,25(OH)2D3 is due to DBP. MC3T3-E1 cells were treated in the presence [FBS (+)] or absence [FBS (−)] of serum or in the presence of serum obtained from either wild-type (S-DBP+/+) or DBP-null (S-DBP−/−) mice. RNA was isolated and evaluated as in A. Cyp24a1 transcripts were normalized to those of mβ-actin. EC50 and r2 values for each condition are as follows: FBS (+), 2.0 × 10⁻⁸ m (0.99); FBS (−), 3.0 × 10⁻¹¹ m (0.95); S-DBP+/+, 2.6 × 10⁻⁹ m (0.99); S-DBP−/−, 6.0 × 10⁻¹¹ m (0.97). The data are representative of several similar experiments.
Biological response correlates directly with VDR ligand binding and target gene association in MC3T3-E1 cells in vitro
Unlike our studies in vivo, we were unable to establish a direct correlation between the cellular gene responses we measured in vitro and the actual intracellular levels of 1,25(OH)2D3 that arose from the exogenous addition of 1,25(OH)2D3. To define this relationship further and to define a mechanistic link between the uptake of 1,25(OH)2D3 from the medium and its actions on downstream mRNA production, we examined the ability of DBP both to alter parameters of 1,25(OH)2D3 binding to the VDR and to modulate VDR localization at representative target gene promoters. We also explored the effects of several vitamin D analogs on these systems as well. An initial experiment in viable cultured cells, as seen in Fig. 6A, revealed a striking temporal acceleration in the binding of 1,25(OH)2D3 (10−9 m) to the VDR when DBP was absent compared with that observed when DBP was present in the medium. This approach was not technically feasible, however, for studying the effects of DBP on VDR binding in cells at higher concentrations of 1,25(OH)2D3. Thus, we made use of a previous finding that direct interaction of the VDR with vitamin D ligands can be estimated by measuring direct up-regulation of the receptor protein itself (VDR undergoes a rapid enhancement in protein stability in the presence of vitamin D ligands) (43,44). Indeed, this up-regulation in VDR protein is detectable by Western blot analysis within 1 h of ligand treatment and is independent of transcriptional activation (data not shown). Figure 6B reveals that the ability of 1,25(OH)2D3 to induce an up-regulation of VDR protein is concentration dependent and correlates directly with the concentrations of ligand necessary for the up-regulation of Cyp24a1 mRNA. More importantly, the removal of serum (and therefore DBP) resulted in an identical two log shift in responsiveness to exogenously added 1,25(OH)2D3; this change was identical to that observed at the level of target gene up-regulation. These data suggest that despite the requirement for different levels of exogenously added 1,25(OH)2D3 in the medium when DBP was present, similar levels of intracellular 1,25(OH)2D3 were achieved for VDR activation, and these levels correlated directly with biological response. This conclusion is further supported by the results obtained with KH1060 and MC1288, wherein a similar up-regulation of VDR protein was obtained irrespective of whether DBP was present; again, this up-regulation was equivalent to that seen with 1,25(OH)2D3 in the absence of DBP. To provide a final link between VDR activation and mRNA up-regulation, we explored whether DBP manifested similar effects on the ability of 1,25(OH)2D3 to induce VDR binding directly to target Cyp24a1 and OPN genes using ChIP assays (33). Although a full dose-response curve was not conducted in the absence of DBP, the results in Fig. 6C revealed that VDR binding to both Cyp24a1 and OPN at the lower concentrations of 1,25(OH)2D3 was increased substantially when DBP was removed, reaching levels equivalent to those observed at 10−7 m 1,25(OH)2D3 when DBP was present. These studies support the idea that despite the substantial differences in extracellular 1,25(OH)2D3 necessary for gene activation when DBP is present, there is a direct correlation between intracellular hormone levels and the activation of gene expression.
Figure 6.

The effect of DBP on vitamin D ligand binding to VDR on MC3T3-E1 cells in culture. A, The influence of serum on 1,25(OH)2D3 binding to the VDR in intact cells in culture. MC3T3-E1 cells were incubated in triplicate with tritiated 1,25(OH)2D3 (1 nm, 166 Ci/mmol) or a 250-fold molar excess of radioinert 1,25(OH)2D3 as outlined in Materials and Methods. At the times indicated, cells were harvested, and the level of total and nonspecific 1,25(OH)2D3 binding activity was determined by hydroxyapatite assay. Specific VDR binding is depicted. Each point represents the mean + sem for a triplicate determination. These data are representative of at least three similar independent evaluations. B, The influence of serum on the interaction between selected vitamin D ligands and the VDR. MC3T3-E1 cells were treated in the presence (left panel) or absence (right panel) of serum with increasing concentrations of 1,25(OH)2D3, MC1288, or KH1060. Cells were harvested at 6 h and subjected to Western blot analysis using the anti-VDR monoclonal antibody 9A7. EC50 and r2 values for each condition are as follows: 1,25(OH)2D3 [FBS (+)], 2.8 × 10⁻⁹ m (0.99) and [FBS (−)], 1.1 × 10⁻¹¹ m (0.99); KH1060 [FBS (+)], 3.2 × 10⁻¹¹ m (0.94) and [FBS (−)], 1.6 × 10⁻¹¹ m (0.99); MC1288 [FBS (+)], 6.4 × 10⁻¹¹ m (1.0) and[FBS (−)], 4.5 × 10⁻¹¹ m (0.99). Data from at least three different experiments were quantitated using densitometry and presented as fold induction over vehicle treatment. C, The influence of serum on 1,25(OH)2D3-induced VDR localization to the Cyp24a1 and OPN gene promoters. MC3T3-E1 cells were treated in the absence or presence of serum with increasing concentrations of 1,25(OH)2D3. Cells were harvested after 6 h and subjected to ChIP analysis using antibodies to either VDR or nonspecific IgG. Immunoprecipitated DNA was evaluated for the presence of vitamin D response element-containing Cyp24a1 (left panel) or OPN (right panel) promoter DNA using oligonucleotide primers indicated in Materials and Methods. PCR products were quantitated using densitometry and the values plotted as fold induction over vehicle controls. These data are representative of at least three similar comparable evaluations by ChIP.
Uptake of 1,25(OH)2D3 into the tissues of wild-type and DBP-null mice is similar
Our earlier results represent measurements of 1,25(OH)2D3 levels in blood and tissues of wild-type and DBP-null mice at steady state and highlight the direct correlation that is present between tissue levels of hormone and biological output. Based upon the studies performed above in vitro, we therefore anticipated that the administration of 1,25(OH)2D3 in vivo would evoke a dynamic and dose-dependent response as well. To evaluate this hypothesis, we first examined the influence of DBP on both the dispersal and tissue uptake of 1,25(OH)2D3 after a single ip injection of the ligand [1 μCi in radioinert 1,25(OH)2D3 (10 ng/g bw)] as a function of time into either wild-type or DBP-null mice. Interestingly, although 1,25(OH)2D3 appeared to increase more rapidly yet transiently in the blood of wild-type compared with DBP-null mice, the levels of 1,25(OH)2D3 that accumulated in the kidneys of both mice as seen in Fig. 7, A and B, were not substantially different. Thus, although only total tritium and not authentic 1,25(OH)2D3 was quantitated after injection in this experiment, our results indicated strongly that localization of exogenously administered 1,25(OH)2D3 into tissues in the two mouse strains was kinetically and quantitatively similar. This finding also provides additional support for the idea that DBP is not essential for either ligand dispersal or cellular uptake.
Figure 7.

Uptake and kidney tissue content of tritiated 1,25(OH)2D3 after injection into wild-type and DBP-null mice. A, The kinetics of 1,25(OH)2D3 uptake into the blood. A single dose of 1,25(OH)2D3 (10 ng/g bw) containing 1 μCi tritiated 1,25(OH)2D3 was injected ip into 8-wk-old female DBP-null mice and their comparable controls. Blood was drawn at the times indicated and the presence of tritiated ligand assessed as described in Materials and Methods. The histogram values represent the mean ± sem (n = 3). These results are representative of two similar experiments. B, The kinetics of 1,25(OH)2D3 uptake into kidneys. A single dose of 1,25(OH)2D3 (10 ng/g bw) containing 1 μCi tritiated 1,25(OH)2D3 was injected ip into 8-wk-old female DBP-null mice and their comparable controls. Individual kidneys were harvested at the time points indicated and processed as described in Materials and Methods, and the presence of tritiated ligand was assessed as in A. The histogram values represent the mean ± sem for each group of mice at each time point (n = 3). *, P < 0.01 relative to wild-type control.
Dose-response curves for 1,25(OH)2D3 in both wild-type and DBP-null mice are similar
Based upon this temporal study, we injected single doses of 1,25(OH)2D3 at increasing concentrations of the ligand into both wild-type and DBP-null mice and assessed the level of mRNAs for intestinal Cyp24a1 and TRPV6 and renal Cyp24a1 and TRPV5, as outlined earlier. We also measured in a similar experiment the ability of 1,25(OH)2D3 to induce calcemic responses. Surprisingly, as documented in Fig. 8, the induction profiles for individual selected mRNAs were almost identical between the two mouse strains when plotted as a function of injected 1,25(OH)2D3 concentration. Calcemic responses to 1,25(OH)2D3 as seen in Fig. 9 were similar as well, although these were evaluated in response to more limited 1,25(OH)2D3 concentrations. Collectively, these results are consistent with our kinetic studies and suggest that in addition to its failure to influence ligand dispersal and cellular uptake, DBP is also unable to influence the concentration of exogenously administered 1,25(OH)2D3 necessary for half-maximal induction (EC50) of gene expression in vivo. Interestingly, these in vivo dose-response results in both wild-type and DBP-null mice appear to be fully at odds with the observation that DBP alters the overall potency of 1,25(OH)2D3 action in vitro.
Figure 8.

Dose-dependent induction of intestinal and kidney target genes by 1,25(OH)2D3 in wild-type and DBP-null mice. A single dose of 1,25(OH)2D3 (0–100 ng/g bw as indicated) was injected ip into 8-wk-old female DBP-null mice and their comparable controls. The intestine and kidneys were harvested at 6 h and processed to obtain total RNA as described in Materials and Methods. A, Analysis of Cyp24a1 (left panel) and TRPV5 (right panel) transcripts induced in kidney. Total RNA was subjected to qRT-PCR analysis using the primers documented in Fig. 2 and Materials and Methods, normalized to mβ-actin levels and plotted as a function of injected 1,25(OH)2D3 concentration. Each point represents the mean ± sem (n = 5). EC50 and r2 values for each condition are as follows: kidney Cyp24a1 (DBP+/+), 0.33 ng/g bw (0.95); (DBP−/−), 0.23 ng/g bw (0.96); kidney TRPV5 (DBP+/+), 0.09 ng/g bw (0.91); (DBP−/−), 0.02 ng/g bw (0.82). B, Analysis of Cyp24a1 (left panel) and TRPV6 (right panel) transcripts induced in intestine. Measurements were assessed as in A. Each point represents the mean ± sem (n = 5). EC50 and r2 values for each condition are as follows: intestinal Cyp24a1 (DBP+/+), 0.30 ng/g bw (0.77); (DBP−/−), 0.44 ng/g bw (0.88); intestinal TRPV6 (DBP+/+), 1.15 ng/g bw (0.55); (DBP−/−), 0.05 ng/g bw (0.67).
Figure 9.

Induction of calcemic responses by 1,25(OH)2D3 in wild-type and DBP-null mice. Eight-week-old DBP-null mice and controls maintained on a standard diet were treated with single doses of 1,25(OH)2D3 at the concentrations indicated. Blood was drawn at 24 and 48 h and serum calcium content determined by atomic absorption spectrophotometry as described in Materials and Methods. A, Experiment 1 examines 1,25(OH)2D3 at 0.01 ng/g bw. *, Different from DBP+/+ controls at the equivalent time points, P < 0.05. B, Experiment 2 examines 1,25(OH)2D3 at 1 ng/g bw. The histograms represent the mean ± sem (n = 5) for each treatment group as indicated. *, Different from DBP+/+ controls at the equivalent time points, P < 0.05; **, different from DBP−/− controls at the equivalent time points, P < 0.05.
Discussion
The influence of DBP on the biological activity of 1,25(OH)2D3 has been explored for decades. Much of this work has been conducted in vitro in both broken cell preparations and in cell culture models. More recently, the creation of a DBP-null mouse has provided the opportunity to explore further the consequence of DBP removal on the activity of 1,25(OH)2D3 in vivo and to contrast these findings in the mouse with those obtained in cell culture. An initial observation with respect to the phenotype of the DBP-null mouse was the finding that these mice were normocalcemic in the face of a severely depleted circulating level of 1,25(OH)2D3. Indeed, our own measurements support this conclusion and demonstrate that whereas serum calcium levels in DBP-null mice were equivalent to those in wild-type mice, blood levels of 1,25(OH)2D3 were less than 1%. How is this normal biological status sustained? Our results demonstrate that DBP-null mice maintain normal blood calcium levels not through an unusual physiological adaptation enabling the overexpression of calcium-regulating genes but rather through an ability of 1,25(OH)2D3 to accumulate in target tissues in a fashion similar to that of wild-type mice. These findings raise interesting questions as to the mechanism by which 1,25(OH)2D3 accumulates appropriately within target tissues when circulating levels are immeasurably low. Regardless, our results together with those from earlier studies suggest that DBP is dispensable, both for transporting 1,25(OH)2D3 from its renal site of synthesis to distant target organs and for facilitating the uptake of the ligand into target tissues as well. Because 1,25(OH)2D3 appears fully capable of reaching its distant target organs in DBP-null mice, we presume that this delivery is accomplished through the ligand’s low-affinity interaction with albumin or other relatively abundant serum proteins with which it is known to interact. However, because neither these interactions nor those specifically associated with DBP appear to alter biological activity, our results call into question the very nature of the dynamic equilibrium that is believed to exist between protein-bound and free, and therefore bioactive, 1,25(OH)2D3.
As indicated above, there was no evidence of a striking physiological adaptation leading to a significant up-regulation of the expression of calcium-regulating genes in the DBP-null mice. In many ways, this mild phenotype is analogous to that observed when carrier proteins for other steroid hormones were genetically deleted, as outlined earlier (16,18,45). However, we did observe significant changes in the levels of mRNAs for several 1,25(OH)2D3 gene targets, including an up-regulation of Cyp27b1, the enzyme solely responsible for the production of 1,25(OH)2D3 by the kidney, and a down-regulation of Cyp24a1, the enzyme responsible for ligand degradation. If regulatory feedback controls remain uniquely operable in the kidney in DBP-null mice, it is possible that these controls are also responsible for the modest down-regulation of calbindin D28K expression. Collectively, however, these data suggest that enhanced synthesis of 1,25(OH)2D3 and perhaps reduced catabolism may be required to maintain adequate tissue levels of 1,25(OH)2D3 in DBP-null mice and that the maintenance of a normal calcium balance in these animals may require higher than normal levels of metabolic activity. It is worth noting here that the strikingly low Cyp24a1 mRNA levels that exist in the intestine prevented us from determining whether the down-regulation of renal Cyp24a1 expression in DBP-null mice also occurred in extrarenal tissues. That these mice might be more sensitive to physiological stress than wild-type mice is consistent with the earlier observation that mild dietary vitamin D deficiency in DBP-null mice leads to striking secondary hyperparathyroidism not seen in normal mice (10). Despite this, our findings clearly do not support the idea that an unusual physiological adaptation in calcium-regulating genes is responsible for the normocalcemic status of DBP-null mice.
The most likely explanation for the maintenance of normal calcium levels in DBP-null mice is derived from the finding that despite the exceptionally low levels of 1,25(OH)2D3 in circulation, the tissue levels of active ligand were normal and at least equivalent to those observed in wild-type mice. Although 1,25(OH)2D3 can be synthesized from its precursor 25OHD3 in certain cell types in vivo, its production and subsequent biological activity in most normal tissues remains somewhat controversial. In addition, although Cyp27b1 has been identified in the colon and in colon tumors, it does not appear to be expressed in the small intestine (46). Thus, we suggest that our findings highlight the key role of intracellular VDR in net target tissue accumulation of 1,25(OH)2D3. Indeed, the ability of the VDR to concentrate 1,25(OH)2D3 in the tissue we examined appears highly efficient, probably due to the receptor’s extremely high affinity for its cognate ligand (Kd ∼1 × 10⁻¹⁰ m) (47,48,49). Perhaps more interesting is the finding that the receptor is able to facilitate a level of ligand uptake in DBP-null mice that is at least equivalent to that of normal mice despite the low circulating concentrations of bioactive 1,25(OH)2D3. This suggests the possibility that the levels of bioactive or DBP-free hormone in the blood of the two mouse strains are likely equivalent. Interestingly, these exceptionally low levels of bioactive hormone in the blood provide a likely explanation for the modest degree of VDR occupancy (<10%) that generally exists for the vitamin D endocrine system (50,51,52).
The results presented above suggest that DBP is unable to directly impact or influence the free pool of 1,25(OH)2D3 that enters cells, interacts with the VDR, and triggers changes in gene expression. This conclusion is supported by several additional observations that we made in DBP-null mice. First, the time course of 1,25(OH)2D3 uptake from the blood to tissues after a single injection is not different between wild-type and DBP-null mice. Second, dose-response curves for Cyp24a1 and TRPV6 induction in the kidney and intestine in the two mouse strains are nearly identical. Third, calcemic responses that are initiated by increasing concentrations of 1,25(OH)2D3 and that are a consequence of gene up-regulation are also similar. These results suggest that whereas DBP is capable of binding 1,25(OH)2D3 in the blood, it does not appear to be in active equilibrium with circulating levels of free, bioactive hormone. Perhaps an additional compartment is involved, one analogous to that exemplified by membrane-localized megalin that is associated in some way with the direct accumulation of ligand within target cell membranes (53).
If DBP is unable to influence blood levels of bioactive 1,25(OH)2D3 directly, what is its physiological role with regard to this hormone? It seems possible that DBP might function as a storage reservoir for 1,25(OH)2D3 after the ligand’s synthesis in the kidney, a function consistent with its role in the maintenance and appropriate turnover of 25OHD3 in particular. If so, however, a novel mechanism would appear to be necessary to facilitate the transfer of stored ligand to the bioactive pool, because, as discussed above, a dynamic equilibrium does not appear to exist between that which is free and that which is bound to DBP. It is also possible that DBP functions to maintain high levels of 1,25(OH)2D3 for other purposes. Perhaps high levels are required to meet enzymatic requirements for either synthesis or degradation in the kidney or for regulatory feedback. Alternatively, it is possible that the primary function of DBP is not directed toward controlling the activity of 1,25(OH)2D3 but rather at maintaining appropriate levels of 25OHD3, as indicated above. In that regard, the increased affinity of DBP for 25OHD3 might be potentially advantageous. There is clearly a fine balance with regard to the relationship between DBP and 25OHD3, however, because the removal of DBP can also be beneficial, resulting in increased resistance to vitamin D toxicity and reduced susceptibility to hypercalcemia (10). Future research will be required to provide answers to these speculative questions regarding DBP function.
If DBP is unable to influence blood levels of bioactive hormone in vivo, why does DBP exert such a profound effect on the overall potency of 1,25(OH)2D3 in vitro? And perhaps more importantly, why do the effects of DBP in vivo and in vitro appear so different? The answers to these questions and the nature of the processes that underlie these striking differences are unclear at this point. Because a difference in potency is not apparent between wild-type and DBP-null mice treated with increasing concentrations of 1,25(OH)2D3 in vivo, one possibility is that the response to hormone identified in vitro in the presence of DBP is aberrant. Perhaps direct exposure of the cells in culture to DBP-containing serum results in an unusual capacity of DBP to restrict the uptake of 1,25(OH)2D3 into cells, thus shifting the profile of potency for 1,25(OH)2D3 significantly to the right and well below that of its affinity for the VDR. This seems unlikely to represent an activity of DBP that is dynamic because despite the finding that the overall potency of the hormone is increased, neither the activation profile nor the efficacy of the ligand is altered. It is also possible that the effects observed in vivo arise as a result of the influence of existing levels of endogenous 1,25(OH)2D3 on exogenously added 1,25(OH)2D3. Regardless of the mechanism, these differences seen in the presence of DBP provide an explanation for why levels of 1,25(OH)2D3 well above the equilibrium dissociation constant for the VDR are generally required for maximal biological response in vitro.
The ability of DBP-null mice to maintain normal calcium homeostasis in the face of highly reduced levels of circulating 1,25(OH)2D3 contrasts with an original view that blood hormone concentrations provide a generally accurate measure of both vitamin D and calcium status in humans. Indeed, our observations raise important questions as to the overall relevance of 1,25(OH)2D3 measurements in most clinical settings. Surprisingly, the data that directly support biological changes in calcium regulation as a result of altered blood levels of 1,25(OH)2D3 per se are mixed. On the one hand, the reduction in blood 1,25(OH)2D3 levels that result from decreased Cyp27b1 activity in various kidney diseases has a striking effect on calcium homeostasis and leads to profound skeletal disease (54,55,56). Similarly, sarcoidosis-induced macrophagic overproduction of 1,25(OH)2D3 is readily detected in the circulation, has a direct impact on tissues involved in calcium homeostasis, and also produces hypercalcemia (57,58). The biological consequences of changes in blood 1,25(OH)2D3 levels in other physiological states are less clear, however, and may be due to changes in PTH or to other hormones that provoke alterations in calcium homeostasis rather than 1,25(OH)2D3 itself. It was initially reported, for example, that 1,25(OH)2D3 levels were increased during pregnancy and lactation (59,60,61). Later studies, however, revealed that these increases were due, at least in part, to an up-regulation in DBP production (56,62,63). Therefore, it is clear that direct measurements of 1,25(OH)2D3 may not in all circumstances reflect accurately the biologically active component of 1,25(OH)2D3 in the blood. Although this important conclusion was drawn some years ago by Bikle and colleagues (14,15), it did not appear to be universally accepted, because clinical measurements of circulating 1,25(OH)2D3 continued to be standard practice. Nevertheless, the clinical practice of measuring circulating 1,25(OH)2D3 levels as an indication of calcium and vitamin D status has waned, due in part to these particular issues. It remains to be determined why 25OHD3, the highly stable precursor of 1,25(OH)2D3, represents a more useful measure of vitamin D and calcium status in most clinical situations than 1,25(OH)2D3 (36,64).
The present studies have direct implications for the mechanism of action of vitamin D analogs as well as for the evaluation of their biological properties. First, the biological activity of 1,25(OH)2D3 is not influenced directly by its interaction with DBP in vivo. Thus, its seems illogical to suggest that the unexpected biological activities of synthetic vitamin D analogs arise in vivo as a result of this interaction, regardless of whether or not they display a biochemical affinity for DBP in vitro. Accordingly, unique vitamin D analog activity is more likely due to differential sensitivity to local or systemic degradation unassociated with DBP and/or to its ability to provoke an unusual structural conformation within the VDR that manifests itself functionally in unexpected gene regulatory properties (26,27,28,29,42). Second, and perhaps as important, is the observation that the ability of DBP to influence the apparent potency of exogenously added 1,25(OH)2D3 occurs only in vitro. Why this difference is observed is unknown. Regardless, it seems that the use of this parameter to contrast the activity of a vitamin D analog with that of 1,25(OH)2D3 for possible therapeutic purposes is likely limited and potentially highly risky.
In conclusion, we have extended biological insight into the phenotype of the DBP-null mouse. Through a series of experiments both in vitro and in vivo, we have shown that the presence of DBP raises the total levels of 1,25(OH)2D3 in the blood but does not appear to influence levels of the hormone that are free to enter cells and tissues. These findings suggest that additional studies are warranted to determine why relatively high levels of 1,25(OH)2D3 are bound to DBP under normal circumstances and how these levels, which can be altered both physiologically and pathologically, impact the concentration of bioactive hormone.
Acknowledgments
We thank Dr. Sungtae Kim and other members of the Pike laboratory for helpful contributions to this work. We thank Laura Vanderploeg for facilitating preparation of the illustrations contained in this manuscript and Wendy Hellwig for conducting the serum calcium measurements reported herein.
Footnotes
This work was supported by National Institutes of Health Grants DK-72281 and DK-73995 to J.W.P.
Disclosure Statement: The authors have nothing to declare.
First Published Online March 27, 2008
Abbreviations: CBG, Corticosteroid-binding globulin; ChIP, chromatin immunoprecipitation; DBP, vitamin D-binding protein; FBS, fetal bovine serum; m, mouse; 1,25(OH)2D3, 1,25-dihydroxyvitamin D3; 25OHD3, 25-hydroxyvitamin D3; q, real-time; TBG, T4-binding globulin; VDR, vitamin D receptor.
References
- Cooke NE, Haddad JG 1989 Vitamin D binding protein (Gc-globulin). Endocr Rev 10:294–307 [DOI] [PubMed] [Google Scholar]
- Cooke NE 1986 Rat vitamin D binding protein. Determination of the full-length primary structure from cloned cDNA. J Biol Chem 261:3441–3450 [PubMed] [Google Scholar]
- Haddad Jr JG, Walgate J 1976 25-Hydroxyvitamin D transport in human plasma. Isolation and partial characterization of calcifidiol-binding protein. J Biol Chem 251:4803–4809 [PubMed] [Google Scholar]
- Rikkers H, DeLuca HF 1967 An in vivo study of the carrier proteins of 3H-vitamins D3 and D4 in rat serum. Am J Physiol 213:380–386 [DOI] [PubMed] [Google Scholar]
- Bouillon R, Van Baelen H, Rombauts W, De Moor P 1976 The purification and characterisation of the human-serum binding protein for the 25-hydroxycholecalciferol (transcalciferin). Identity with group-specific component. Eur J Biochem 66:285–291 [DOI] [PubMed] [Google Scholar]
- Norman AW, Ishizuka S, Okamura WH 2001 Ligands for the vitamin D endocrine system: different shapes function as agonists and antagonists for genomic and rapid response receptors or as a ligand for the plasma vitamin D binding protein. J Steroid Biochem Mol Biol 76:49–59 [DOI] [PubMed] [Google Scholar]
- Siiteri PK, Murai JT, Hammond GL, Nisker JA, Raymoure WJ, Kuhn RW 1982 The serum transport of steroid hormones. Recent Prog Horm Res 38:457–510 [DOI] [PubMed] [Google Scholar]
- Mendel CM 1989 The free hormone hypothesis: a physiologically based mathematical model. Endocr Rev 10:232–274 [DOI] [PubMed] [Google Scholar]
- Laing C, Cooke NE 2005 Vitamin D-binding protein. In: Feldman D, Pike JW, Glorieux F, eds. Vitamin D. 2nd ed. New York: Elsevier/Academic Press; 117–134 [Google Scholar]
- Safadi FF, Thornton P, Magiera H, Hollis BW, Gentile M, Haddad JG, Liebhaber SA, Cooke NE 1999 Osteopathy and resistance to vitamin D toxicity in mice null for vitamin D binding protein. J Clin Invest 103:239–251 [DOI] [PMC free article] [PubMed] [Google Scholar]
- Haussler MR, Whitfield GK, Haussler CA, Hsieh JC, Thompson PD, Selznick SH, Dominguez CE, Jurutka PW 1998 The nuclear vitamin D receptor: biological and molecular regulatory properties revealed. J Bone Miner Res 13:325–349 [DOI] [PubMed] [Google Scholar]
- Sutton AL, MacDonald PN 2003 Vitamin D: more than a “bone-a-fide” hormone. Mol Endocrinol 17:777–791 [DOI] [PubMed] [Google Scholar]
- Pike JW, Shevde NK 2005 The vitamin D receptor. In: Feldman D, Pike JW, Glorieux F, eds. Vitamin D. 2nd ed. New York: Elsevier/Academic Press; 167–191 [Google Scholar]
- Bikle DD, Gee E, Halloran B, Haddad JG 1984 Free 1,25-dihydroxyvitamin D levels in serum from normal subjects, pregnant subjects, and subjects with liver disease. J Clin Invest 74:1966–1971 [DOI] [PMC free article] [PubMed] [Google Scholar]
- Bikle DD, Siiteri PK, Ryzen E, Haddad JG 1985 Serum protein binding of 1,25-dihydroxyvitamin D: a reevaluation by direct measurement of free metabolite levels. J Clin Endocrinol Metab 61:969–975 [DOI] [PubMed] [Google Scholar]
- Torpy DJ, Bachmann AW, Grice JE, Fitzgerald SP, Phillips PJ, Whitworth JA, Jackson RV 2001 Familial corticosteroid-binding globulin deficiency due to a novel null mutation: association with fatigue and relative hypotension. J Clin Endocrinol Metab 86:3692–3700 [DOI] [PubMed] [Google Scholar]
- Domingues R, Bugalho MJ, Garrao A, Boavida JM, Sobrinho L 2002 Two novel variants in the thyroxine-binding globulin (TBG) gene behind the diagnosis of TBG deficiency. Eur J Endocrinol 146:485–490 [DOI] [PubMed] [Google Scholar]
- Su CC, Wu YC, Chiu CY, Won JG, Jap TS 2003 Two novel mutations in the gene encoding thyroxine-binding globulin (TBG) as a cause of complete TBG deficiency in Taiwan. Clin Endocrinol (Oxf) 58:409–414 [DOI] [PubMed] [Google Scholar]
- Petersen HH, Andreassen TK, Breiderhoff T, Brasen JH, Schulz H, Gross V, Grone HJ, Nykjaer A, Willnow TE 2006 Hyporesponsiveness to glucocorticoids in mice genetically deficient for the corticosteroid binding globulin. Mol Cell Biol 26:7236–7245 [DOI] [PMC free article] [PubMed] [Google Scholar]
- Brown AJ 2001 Therapeutic uses of vitamin D analogues. Am J Kidney Dis 38:S3–S19 [DOI] [PubMed] [Google Scholar]
- Pike JW, Yamamoto H, Shevde NK 2002 Vitamin D receptor-mediated gene regulation mechanisms and current concepts of vitamin D analog selectivity. Adv Ren Replace Ther 9:168–174 [DOI] [PubMed] [Google Scholar]
- Binderup L, Latini S, Binderup E, Bretting C, Calverley M, Hansen K 1991 20-epi-vitamin D3 analogues: a novel class of potent regulators of cell growth and immune responses. Biochem Pharmacol 42:1569–1575 [DOI] [PubMed] [Google Scholar]
- Johnsson C, Binderup L, Tufveson G 1996 Immunosuppression with the vitamin D analogue MC 1288 in experimental transplantation. Transplant Proc 28:888–891 [PubMed] [Google Scholar]
- Binderup L, Bramm E 1988 Effects of a novel vitamin D analogue MC903 on cell proliferation and differentiation in vitro and on calcium metabolism in vivo. Biochem Pharmacol 37:889–895 [DOI] [PubMed] [Google Scholar]
- Zhou JY, Norman AW, Lubbert M, Collins ED, Uskokovic MR, Koeffler HP 1989 Novel vitamin D analogs that modulate leukemic cell growth and differentiation with little effect on either intestinal calcium absorption or bone mobilization. Blood 74:82–93 [PubMed] [Google Scholar]
- Peleg S, Sastry M, Collins ED, Bishop JE, Norman AW 1995 Distinct conformational changes induced by 20-epi analogues of 1α,25-dihydroxyvitamin D3 are associated with enhanced activation of the vitamin D receptor. J Biol Chem 270:10551–10558 [DOI] [PubMed] [Google Scholar]
- Liu YY, Nguyen C, Peleg S 2000 Regulation of ligand-induced heterodimerization and coactivator interaction by the activation function-2 domain of the vitamin D receptor. Mol Endocrinol 14:1776–1787 [DOI] [PubMed] [Google Scholar]
- Yang W, Freedman LP 1999 20-Epi analogues of 1,25-dihydroxyvitamin D3 are highly potent inducers of DRIP coactivator complex binding to the vitamin D3 receptor. J Biol Chem 274:16838–16845 [DOI] [PubMed] [Google Scholar]
- Tocchini-Valentini G, Rochel N, Wurtz JM, Mitschler A, Moras D 2001 Crystal structures of the vitamin D receptor complexed to superagonist 20-epi ligands. Proc Natl Acad Sci USA 98:5491–5496 [DOI] [PMC free article] [PubMed] [Google Scholar]
- McDonnell DP 1998 Definition of the molecular mechanism of action of tissue-selective oestrogen-receptor modulators. Biochem Soc Trans 26:54–60 [DOI] [PubMed] [Google Scholar]
- Yamamoto H, Shevde NK, Warrier A, Plum LA, DeLuca HF, Pike JW 2003 2-Methylene-19-nor-(20S)-1,25-dihydroxyvitamin D3 potently stimulates gene-specific DNA binding of the vitamin D receptor in osteoblasts. J Biol Chem 278:31756–31765 [DOI] [PubMed] [Google Scholar]
- Pike JW, Haussler MR 1983 Association of 1,25-dihydroxyvitamin D3 with cultured 3T6 mouse fibroblasts. Cellular uptake and receptor-mediated migration to the nucleus. J Biol Chem 258:8554–8560 [PubMed] [Google Scholar]
- Kim S, Shevde NK, Pike JW 2005 1,25-Dihydroxyvitamin D3 stimulates cyclic vitamin D receptor/retinoid X receptor DNA-binding, co-activator recruitment, and histone acetylation in intact osteoblasts. J Bone Miner Res 20:305–317 [DOI] [PubMed] [Google Scholar]
- Kim S, Yamazaki M, Zella LA, Shevde NK, Pike JW 2006 Activation of receptor activator of NF-κB ligand gene expression by 1,25-dihydroxyvitamin D3 is mediated through multiple long-range enhancers. Mol Cell Biol 26:6469–6486 [DOI] [PMC free article] [PubMed] [Google Scholar]
- Hollis BW, Kamerud JQ, Kurkowski A, Beaulieu J, Napoli JL 1996 Quantification of circulating 1,25-dihydroxyvitamin D by radioimmunoassay with 125I-labeled tracer. Clin Chem 42:586–592 [PubMed] [Google Scholar]
- Hollis BW 2005 Detection of vitamin D and its major metabolites. In: Feldman D, Pike JW, Glorieux F, eds. Vitamin D. 2nd ed. New York: Elsevier/Academic Press; 931–950 [Google Scholar]
- Prosser DE, Jones G 2004 Enzymes involved in the activation and inactivation of vitamin D. Trends Biochem Sci 29:664–673 [DOI] [PubMed] [Google Scholar]
- Hoenderop JGJ, Nilius B, Bindels RJM 2005 Calcium absorption across epithelia. Physiol Rev 85:373–422 [DOI] [PubMed] [Google Scholar]
- Jung SJ, Lee YY, Pakkala S, de Vos S, Elstner E, Norman AW, Green J, Uskokovic M, Koeffler HP 1994 1,25(OH)2-16ene-vitamin D3 is a potent antileukemic agent with low potential to cause hypercalcemia. Leuk Res 18:453–463 [DOI] [PubMed] [Google Scholar]
- Bikle DD, Abe-Hashimoto J, Su MJ, Felt S, Gibson DF, Pillai S 1995 22-Oxa calcitriol is a less potent regulator of keratinocyte proliferation and differentiation due to decreased cellular uptake and enhanced catabolism. J Invest Dermatol 105:693–698 [DOI] [PubMed] [Google Scholar]
- Skowronski RJ, Peehl DM, Feldman D 1995 Actions of vitamin D3, analogs on human prostate cancer cell lines: comparison with 1,25-dihydroxyvitamin D3. Endocrinology 136:20–26 [DOI] [PubMed] [Google Scholar]
- Dilworth FJ, Calverley MJ, Makin HL, Jones G 1994 Increased biological activity of 20-epi-1,25-dihydroxyvitamin D3 is due to reduced catabolism and altered protein binding. Biochem Pharmacol 47:987–993 [DOI] [PubMed] [Google Scholar]
- Wiese RJ, Uhland-Smith A, Ross TK, Prahl JM, DeLuca HF 1992 Up-regulation of the vitamin D receptor in response to 1,25-dihydroxyvitamin D3 results from ligand-induced stabilization. J Biol Chem 267:20082–20086 [PubMed] [Google Scholar]
- Santiso-Mere D, Sone T, Hilliard GMt, Pike JW, McDonnell DP 1993 Positive regulation of the vitamin D receptor by its cognate ligand in heterologous expression systems. Mol Endocrinol 7:833–839 [DOI] [PubMed] [Google Scholar]
- Vogel S, Piantedosi R, O'Byrne SM, Kako Y, Quadro L, Gottesman ME, Goldberg IJ, Blaner WS 2002 Retinol-binding protein-deficient mice: biochemical basis for impaired vision. Biochemistry 41:15360–15368 [DOI] [PubMed] [Google Scholar]
- Hewison M, Adams J 2005 Extra-renal 1α-hydroxylase activity and human disease. In: Feldman D, Pike JW, Glorieux F, eds. Vitamin D. 2nd ed. New York: Elsevier/Academic Press; 1379–1400 [Google Scholar]
- Wecksler WR, Ross FP, Norman AW 1979 Characterization of the 1α,25-dihydroxyvitamin D3 receptor from rat intestinal cytosol. J Biol Chem 254:9488–9491 [PubMed] [Google Scholar]
- Mellon WS, DeLuca HF 1979 An equilibrium and kinetic study of 1,25-dihydroxyvitamin D3 binding to chicken intestinal cytosol employing high specific activity 1,25-dehydroxy[3H-26,27] vitamin D3. Arch Biochem Biophys 197:90–95 [DOI] [PubMed] [Google Scholar]
- Dokoh S, Donaldson CA, Marion SL, Pike JW, Haussler MR 1983 The ovary: a target organ for 1,25-dihydroxyvitamin D3. Endocrinology 112:200–206 [DOI] [PubMed] [Google Scholar]
- Hunziker W, Walters MR, Norman AW 1980 1,25-dihydroxyvitamin D3 receptors. Differential quantitation of endogenously occupied and unoccupied sites. J Biol Chem 255:9534–9537 [PubMed] [Google Scholar]
- Dokoh S, Haussler MR, Pike JW 1984 Development of a radioligand immunoassay for 1,25-dihydroxycholecalciferol receptors utilizing monoclonal antibody. Biochem J 221:129–136 [DOI] [PMC free article] [PubMed] [Google Scholar]
- Uhland-Smith A, Prahl JM, DeLuca HF 1996 An enzyme-linked immunoassay for the 1,25-dihydroxyvitamin D3 receptor protein. J Bone Miner Res 11:1921–1925 [DOI] [PubMed] [Google Scholar]
- Nykjaer A, Dragun D, Walther D, Vorum H, Jacobsen C, Herz J, Melsen F, Christensen EI, Willnow TE 1999 An endocytic pathway essential for renal uptake and activation of the steroid 25-(OH) vitamin D3. Cell 96:507–515 [DOI] [PubMed] [Google Scholar]
- Haussler MR, Baylink DJ, Hughes MR, Brumbaugh PF, Wergedal JE, Shen FH, Nielsen RL, Counts SJ, Bursac KM, McCain TA 1976 The assay of 1α,25-dihydroxyvitamin D3: physiologic and pathologic modulation of circulating hormone levels. Clin Endocrinol (Oxf) 5(Suppl):151S–165S [DOI] [PubMed] [Google Scholar]
- Haussler MR, McCain TA 1977 Basic and clinical concepts related to vitamin D metabolism and action (first of two parts). N Engl J Med 297:974–983 [DOI] [PubMed] [Google Scholar]
- van Hoof HJ, de Sevaux RG, van Baelen H, Swinkels LM, Klipping C, Ross HA, Sweep CG 2001 Relationship between free and total 1,25-dihydroxyvitamin D in conditions of modified binding. Eur J Endocrinol 144:391–396 [DOI] [PubMed] [Google Scholar]
- Bell NH, Stern PH, Pantzer E, Sinha TK, DeLuca HF 1979 Evidence that increased circulating 1α,25-dihydroxyvitamin D is the probable cause for abnormal calcium metabolism in sarcoidosis. J Clin Invest 64:218–225 [DOI] [PMC free article] [PubMed] [Google Scholar]
- Barbour GL, Coburn JW, Slatopolsky E, Norman AW, Horst RL 1981 Hypercalcemia in an anephric patient with sarcoidosis: evidence for extrarenal generation of 1,25-dihydroxyvitamin D. N Engl J Med 305:440–443 [DOI] [PubMed] [Google Scholar]
- Kumar R, Cohen WR, Silva P, Epstein FH 1979 Elevated 1,25-dihydroxyvitamin D plasma levels in normal human pregnancy and lactation. J Clin Invest 63:342–344 [DOI] [PMC free article] [PubMed] [Google Scholar]
- Toverud SU, Boass A, Haussler MR, Pike JW 1983 Circulating levels and function of 1,25-(OH)2D3 in lactation. J Steroid Biochem 19:505–510 [DOI] [PubMed] [Google Scholar]
- Kumar R, Cohen WR, Epstein FH 1980 Vitamin D and calcium hormones in pregnancy. N Engl J Med 302:1143–1145 [DOI] [PubMed] [Google Scholar]
- Wilson SG, Retallack RW, Kent JC, Worth GK, Gutteridge DH 1990 Serum free 1,25-dihydroxyvitamin D and the free 1,25-dihydroxyvitamin D index during a longitudinal study of human pregnancy and lactation. Clin Endocrinol (Oxf) 32:613–622 [DOI] [PubMed] [Google Scholar]
- van Hoof HJ, van der Mooren MJ, Swinkels LM, Sweep CG, Merkus JM, Benraad TJ 1999 Female sex hormone replacement therapy increases serum free 1,25-dihydroxyvitamin D3: a 1-year prospective study. Clin Endocrinol (Oxf) 50:511–516 [DOI] [PubMed] [Google Scholar]
- Vieth R 2005 The pharmacology of vitamin D, including fortification strategies. In: Feldman D, Pike JW, Glorieux F, eds. Vitamin D. 2nd ed. New York: Elsevier/Academic Press; 995–1015 [Google Scholar]