

Abstract
Aims/hypothesis
Peroxisome proliferator-activated receptor γ (PPARγ), encoded by the PPARG gene, regulates insulin sensitivity and adipogenesis, and may bind polyunsaturated fatty acids (PUFA) and thiazolidinediones in a ligand-dependent manner. The PPARG proline for alanine substitution at position 12 (Pro12Ala polymorphism) has been related with obesity directly and via interaction with PUFA.
Methods
We tested the effect-modifying role of Pro12Ala on the 1 year change in obesity-related traits in a randomized clinical trial of treatment with metformin (n=989), troglita-zone (n=363) or lifestyle modification (n=1,004) vs placebo (n=1,000) for diabetes prevention in high-risk individuals.
Results
At baseline, Ala12 carriers had larger waists (p<0.001) and, in a subset, more subcutaneous adipose tissue (SAT; lumbar 2/3; p=0.04) than Pro12 homozygotes. There was a genotype-by-intervention interaction on 1-year weight change (p=0.01); in the placebo arm, Pro12 homozygotes gained weight and Ala12 carriers lost weight (p=0.001). In the metformin and lifestyle arms, weight loss occurred across genotypes, but was greatest in Ala12 carriers (p<0.05). Troglitazone treatment induced weight gain, which tended to be greater in Ala12 carriers (p=0.08). In the placebo group, SAT (lumbar 2/3, lumbar 4/5) decreased in Ala12 allele carriers, but was unchanged in Pro12 homozygotes (p≤0.005). With metformin treatment, SAT decreased independently of genotype. In the lifestyle arm, SAT (lumbar 2/3) reductions occurred across genotypes, but were greater in Ala12 carriers (p=0.03). A genotype-by-PUFA intake interaction on reduction in visceral fat (lumbar 4/5; p=0.04) was also observed, which was most evident with metformin treatment (p<0.001).
Conclusions
/interpretation Within the Diabetes Prevention Program, the Ala12 allele influences central obesity, an effect which may differ by treatment group and dietary PUFA intake (ClinicalTrials.gov ID no: NCT00004992).
Keywords: Computed tomography, Gene-environment interaction, Obesity, Peroxisome proliferator-activated receptor γ, PPARG, PUFA intake, Randomised clinical trial, Subcutaneous fat, Visceral fat
Introduction
Excess adiposity, particularly when localised to the visceral compartments [1] is a major risk factor for a variety of disorders including type 2 diabetes, heart disease, osteoarthritis, certain cancers and sleep apnoea [2–5]. The propensity for weight gain [6] and the regional distribution of adipose tissue [7] are highly heritable traits, indicating that they have a genetic basis. Moreover, the prevalence of obesity has dramatically increased during recent years in most industrialised societies [8], but the rates of increase and the overall prevalence vary greatly across ethnic groups [9]. The combination of these factors suggests that gene–lifestyle interactions influence common obesity. Identifying these interactions may elucidate the mechanisms underlying the development of obesity and prove useful for targeted disease prevention.
In the Diabetes Prevention Program (DPP), treatment with metformin and intensive lifestyle modification reduced the incidence of diabetes by 31 and 58%, respectively, by comparison with the placebo group [10]. Weight loss explained the majority of the reduction in diabetes risk in the intensive lifestyle modification group [11].
Although body composition is highly heritable [7], few genetic variants have been reproducibly associated with common obesity or weight loss in response to drug or lifestyle interventions. For those that have, the mechanism(s) for association and the role of gene–environment interactions are poorly understood. One of the more consistently associated genetic variants for obesity is the proline for alanine substitution at position 12 (Pro12Ala) polymorphism at the peroxisome proliferator-activated receptor γ (PPARG) gene [12]. The Pro12Ala genotype was discovered by sequencing the gene in people with and without type 2 diabetes [13]. One of the first studies of Pro12Ala reported higher BMI and decreased insulin sensitivity in elderly Finnish people who carried the Pro12Pro genotype and a fourfold elevation in type 2 diabetes risk in Japanese Americans who carried the Pro12Pro genotype [14]. In a second study, published at the same time as the Finnish/Japanese study, overweight and obese European American carriers of the Ala12 allele were reported to have higher levels of obesity traits than Pro12 allele homozygotes [15]. Since these initial reports, the Pro12Pro genotype has been consistently associated with increased type 2 diabetes risk in populations ranging in ethnicity, lifestyle and level of obesity [16].
In the DPP, which was a randomised, placebo-controlled trial, we reported elsewhere that Pro12 homozygotes engaged a ~1.3-fold elevated risk of developing type 2 diabetes compared with carriers of the Ala12 allele, irrespective of the intervention to which they were assigned. However, the effect of the Pro12Ala genotype on diabetes risk was modified by level of obesity, such that the genotypic effects were most evident in leaner individuals and were absent in the most obese [17].
In the present study, we tested whether the Pro12Ala variant interacts with glucose-lowering drug treatment or lifestyle intervention to modify the risk of weight gain and change in adipose distribution in DPP participants. We also assessed the possibility that polyunsaturated fatty acid (PUFA) intake interacts with Pro12Ala to influence changes in body weight and adipose distribution.
Methods
The Diabetes Prevention Program
The DPP study design and details of the preventive interventions have been described previously [10, 18]. In brief, the DPP was a multi-centre randomised clinical trial, in which the effects of metformin, troglitazone and intensive lifestyle intervention on the incidence of type 2 diabetes were assessed. Nondiabetic persons (n=3,234) with elevated fasting and post-challenge glucose were randomised to placebo, metformin 850 mg twice daily or a lifestyle intervention programme aimed at ~7% weight loss and ~150 min of physical activity per week; a fourth arm of 585 participants assigned to troglitazone 400 mg daily was stopped 2 years after the trial commenced because of hepatotoxicity [10]. The principal endpoint was the development of diabetes by confirmed OGTT. Detailed measurements of other phenotypes such as weight change and change in abdominal obesity were also collected. This report focuses on these obesity-related traits (i.e. weight, waist circumference or fat mass). Written, informed consent specific to genetic investigation was obtained from each participant; each of the 27 DPP centres obtained approval from their respective institutional review boards prior to initiation of the study protocol.
Participants
Consent for genetic analyses was obtained from 93.3% (n=3,356/3,597) of participants who were originally assigned to a treatment arm in the DPP and for whom data at 1 year are available. Of the participants studied in this report, 56.1% were European American, 20.4% were African American, 16.7% were Hispanic, 4.4% were Asian American and 2.5% were American Indian by self report. Similar to the entire DPP, the participants’ mean age at enrolment was 51 years and mean BMI was 34.1 kg/m2.
Quantification of dietary fat intake and body composition
A semiquantitative food frequency questionnaire was used to determine usual intake of dietary fatty acids over the previous year [19, 20]. Information on dietary fatty acid consumption was partitioned into total intake of fatty acid subtypes and polyunsaturated to saturated fatty acid ratio (P:S ratio). Body composition measurements (referred to hereafter as obesity-related traits) included height, weight, waist circumference and, in a subgroup, abdominal computed tomography (CT) scanning of subcutaneous adipose tissue (SAT) and visceral adipose tissue (VAT) areas. Although good-quality CT scans were available in 957 participants from 18 of the 27 DPP centres, the additional baseline and follow-up data necessary for the present study were only available in 725 individuals. The CT instruments used included GE High Speed Advantage (GE Medical Systems, Waukesha, WI, USA; five centres), Picker PQ 5000 (TransAmerican Medical Imaging, Lindon, UT, USA; five centres), Siemens and Siemens Somatom Plus (Siemens, New York, NY, USA; two centres), GE 9800 (GE Medical Systems; three centres) and GE Highlite (GE Medical Systems; two centres). Two 10 mm thick axial images were obtained at the L2-3 and L4-5 disc spaces and used to define the different adipose compartments and areas by trained staff at a central reading facility (Health Sciences Centre, University of Colorado, Denver, CO, USA) as described previously [21].
Genotyping
The methods for DNA extraction and quantification as well as for Pro12Ala genotyping in the DPP have been described in detail previously [17]. The genotyping success rate was 99.9% and the consensus rate in forward and reverse reactions was 100%. The allele frequencies at Pro12Ala in each of the five ethnic groups were in Hardy–Weinberg equilibrium (p>0.05).
Statistical analysis
The primary endpoints for these analyses were changes in weight, waist circumference or fat mass during the first year. Owing to the relatively low frequency of the Ala12Ala genotype, and to minimise type 1 error rates, we specified a priori that we would only test the Pro12Pro vs Ala12X genetic model. This restriction applied to all main effect and interaction models. For similar reasons, all genotype-by-treatment-group interaction models were tested using a chunk test incorporating all treatment groups simultaneously [22]. We used ANOVA with genotype, intervention and genotype-by-intervention interactions as the independent variables predicting change in weight, waist circumference or body fat mass. Results from all models are adjusted for age, sex, ethnicity and the baseline value for the respective outcome trait. Where no significant genotype-by-treatment-group interaction was evident, the statistical models were adjusted for treatment group rather than constructing separate models for each treatment group. Differences between means were tested using pairwise contrasts; the p values were adjusted for multiple comparisons using the adjusted Holm’s procedure [23] within each set of tests pertaining to the same general hypothesis. Two-sided nominal p values are reported.
Results
Participant characteristics
Table 1 shows the characteristics of the participants stratified by Pro12Ala genotype. Allele frequencies of Pro12Ala differed significantly by ethnicity, with Ala12 allele frequencies of 11.7% (European Americans), 4.0% (African Americans), 9.1% (Hispanics), 8.6% (Asian/Pacific Islander) and 19.6% (American Indians; p<0.001).
Table 1.
Pro12Ala genotype by participant characteristics
| Baseline characteristic | Pro12Pro (n=2787) | Ala12X (n=569) | p value |
|---|---|---|---|
| Treatment | |||
| Placebo | 831 (83.1) | 169 (16.9) | 0.14a |
| Metformin | 831 (84.0) | 158 (16.0) | |
| Lifestyle | 839 (83.6) | 165 (16.4) | |
| Troglitazone | 286 (78.8) | 77 (21.2) | |
| Self-reported ethnicity | |||
| European American | 1499 (79.6) | 384 (20.4) | <0.001b,a |
| African American | 653 (95.6) | 30 (4.4) | |
| Hispanic | 460 (82.1) | 100 (17.9) | |
| Asian/Pacific Islander | 122 (83.6) | 24 (16.4) | |
| American Indian | 53 (63.1) | 31 (36.9) | |
| Sex | |||
| Male | 911 (32.7) | 205 (36.0) | 0.12 |
| Female | 1876 (67.3) | 364 (64.0) | |
| Age (years) | 50.7±10.6 | 50.9±11.1 | 0.56 |
| Weight (kg) | 94.4±20.5 | 95.7±19.5 | 0.20 |
| BMI kg/m2 | 34.0±6.8 | 34.2±6.4 | 0.57 |
| Waist circumference (cm) | 105.0±14.7 | 107.0±14.3 | <0.001 |
| PUFA (g/day) | 13.6 (2.1, 89.9) | 14.0 (3.2, 69.0) | 0.34c |
| Energy from PUFA (%) | 6.3 (2.1, 14.9) | 6.3 (2.6, 14.1) | 0.85c |
| SFA (g/day) | 23.8 (2.3, 179.6) | 24.6 (3.3, 182.6) | 0.09c |
| Energy from SFA (%) | 11.4 (2.2, 29.2) | 11.9 (2.8, 26.3) | <0.01c |
| PUFA/SFA ratio | 0.57 (0.18, 1.66) | 0.56 (0.16, 1.36) | 0.20c |
Data are n (percentage of study population), mean±SD or median (min, max). Genotype percentages express the proportion of each genotypic category within each treatment arm or ethnic group SFA, saturated fatty acids The p values are from Student’s t test
Statistical comparison for all groups combined
The p values are from Fisher’s exact test
The p values are from Wilcoxon’s test
Baseline associations for Pro12Ala genotype
At baseline, following adjustments for age, sex and ethnicity, Ala12 allele carriers had larger waist circumferences (p<0.001), as previously reported [17] (unadjusted results Table 1). The allele frequency for participants who had a CT scan for quantification of abdominal fat area was similar to that of the whole cohort; these Ala12 allele carriers also had more SAT at lumbar 2/3 (p=0.06) and lumbar 4/5 (p=0.04), after adjustments for age, sex and ethnicity, than Pro12 homozygotes (unadjusted results Table 2). Baseline VAT was significantly associated with Pro12Ala genotype prior to adjustment (Table 2), but not following adjustment for age, sex and ethnicity. No differences between genotypes were observed for baseline weight or BMI before or following adjustment for age, sex and ethnicity. After adjustment for multiple hypothesis testing (n tests =5), only the genotypic differences for waist circumference remained statistically significant (p<0.001).
Table 2.
Pro12Ala genotype by participant characteristics for the subset of individuals in whom CT scans were undertaken
| Baseline characteristic | Pro12Pro (n=608) | Ala12X (n=117) | p value |
|---|---|---|---|
| Treatment | |||
| Placebo | 202 (86.7) | 31 (13.3) | 0.07a |
| Metformin | 198 (79.5) | 51 (20.5) | |
| Lifestyle | 208 (85.6) | 35 (14.4) | |
| Self-reported ethnicity | |||
| European American | 330 (79.7) | 84 (20.3) | <0.001b,a |
| African American | 147 (N/A) | N/Ac | |
| Hispanic | 105 (84.7) | 19 (15.3) | |
| Asian/Pacific Islander | 24 (N/A) | N/Ac | |
| American Indian | N/Ac | N/Ac | |
| Sex | |||
| Male | 203 (33.4) | 43 (36.8) | 0.48 |
| Female | 405 (66.6) | 74 (63.2) | |
| Age (years) | 51.8±10.4 | 53.0±10.9 | 0.24 |
| Weight (kg) | 90.9±17.1 | 92.4±16.2 | 0.40 |
| BMI kg/m2 | 32.6±5.6 | 33.1±5.1 | 0.36 |
| Waist circumference (cm) | 102±12.8 | 104±12.4 | 0.25 |
| SAT L 2/3 (cm2) | 294±117 | 308±116 | 0.25 |
| SAT L 4/5 (cm2) | 428±146 | 444±140 | 0.27 |
| VAT L 2/3 (cm2) | 193±84.5 | 215±92.7 | 0.01 |
| VAT L 4/5 (cm2) | 156±61.9 | 164±72.0 | 0.21 |
| PUFA (g/day) | 13.4 (2.6, 48.7) | 14.0 (3.2, 37.5) | 0.42d |
| Energy from PUFA (%) | 6.4 (3.0,14.0) | 6.3 (2.6, 11.6) | 0.44d |
| SFA (g/day) | 18.6 (3.1, 94.5) | 19.8 (6.6, 70.8) | 0.41d |
| Energy from SFA (%) | 11.5(3.7, 29.2) | 11.6 (2.8, 20.8) | 0.45d |
| PUFA: SFA ratio | 0.71 (0.17, 4.85) | 0.69 (0.16, 2.92) | 0.76d |
Data are n (percent), mean±SD or median (min, max). Genotype percentages express the proportion of each genotypic category within each treatment arm or ethnic group SFA, saturated fatty acids
p values are from Student’s t test
Statistical comparison for all groups combined
p values are from Fisher’s exact test
N/A, not available because of insufficient data (cell size<15)
p values are from Wilcoxon’s test
Effect of interventions by Pro12Ala genotype
Figure 1 shows the effect of treatment by Pro12Ala genotype on weight change. In a global test including all intervention arms, we observed a significant genotype-by-intervention interaction on weight change (p=0.01), with a different genotypic effect in the troglitazone arm than in the other arms. In the placebo arm, Pro12 homozygotes gained weight and Ala12 allele carriers lost weight (p=0.001 for difference). In the metformin and lifestyle arms, all individuals lost weight, but this reduction was greatest in Ala12 allele carriers (p=0.01 and p=0.04, respectively for the test between genotypes on weight loss). By contrast, with troglitazone treatment, which tended to induce weight gain, albeit not significantly (p=0.15), Ala12 allele carriers tended to gain more weight than Pro12 homozygotes (p=0.08). After adjustment for multiple hypothesis testing (n tests=5), the genotypic differences for weight change in the placebo and metformin groups remained statistically significant (p=0.005 and 0.04, respectively).
Fig. 1.
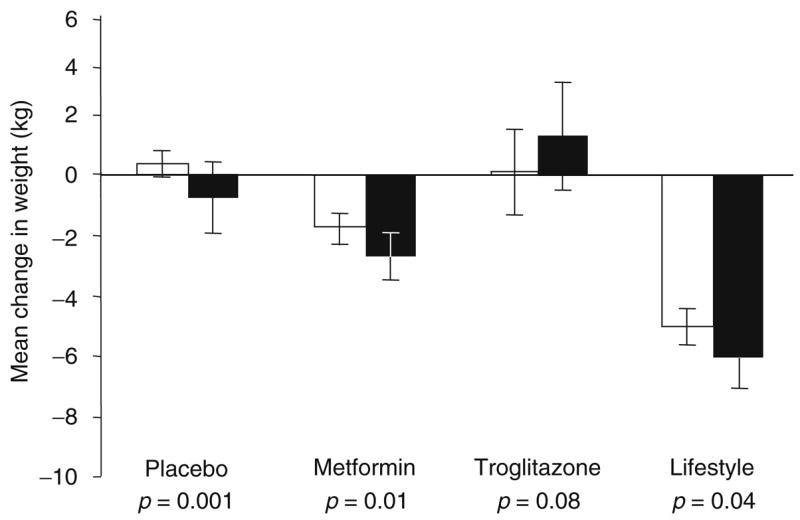
Association between the Pro12Ala genotype and weight change (kg) at 1 year stratified by treatment group. White bars, Pro12Pro genotype carriers; black bars, data from Ala12X genotype carriers. Data are adjusted means and 95% CI. The p values are for the tests of difference for change in weight by genotype (Pro12Pro vs Ala12X), within treatment groups. The test of interaction between genotype and treatment groups was statistically significant (p=0.01)
Intra-abdominal fat was assessed by CT scan in a substudy of 725 participants. CT scan measures of adiposity were unavailable in individuals assigned to the troglitazone intervention due to the early termination of treatment of these participants [10]. The global test of interaction (placebo, metformin or lifestyle) by genotype on change in fat mass was not statistically significant for SAT lumbar 2/3 (p=0.15), SAT lumbar 4/5 (p=0.07), VAT lumbar 2/3 (p=0.30) or VAT lumbar 4/5 (p=0.11). Within the placebo group, as shown in Fig. 2, SAT at lumbar 2/3 and 4/5 decreased during the trial in Ala12 allele carriers, but did not change in Pro12 homozygotes (p=0.004 and p=0.005 for differences between genotypes for SAT lumbar 2/3 and 4/5, respectively). With metformin treatment, similar reductions in SAT lumbar 2/3 and 4/5 were observed in both genotype groups (p=0.49 and p=0.92, respectively). In the lifestyle arm, reductions in SAT lumbar 2/3 were observed in both genotype groups, but the reduction was greatest in Ala12 allele carriers (p=0.03). No significant genotype effect on SAT lumbar 4/5 was observed in the lifestyle intervention arm (p=0.12). No genotype effects on measures of VAT were observed in any of the intervention groups. After adjustment for multiple hypothesis testing (n tests=14), only the genotypic differences for changes in SAT (lumbar 2/3 and 4/5) in the placebo group remained of borderline statistical significance (p=0.056 and 0.065, respectively).
Fig. 2.

Association between Pro12Ala genotype and 1 year change in CT-assessed abdominal fat areas SAT lumbar 2/3 (a), SAT lumbar 4/5 (b), VAT lumbar 2/3 (c) and VAT lumbar 4/5 (d) stratified by treatment group. White bars, data from Pro12Pro genotype carriers; black bars, data from Ala12X genotype carriers. Data are adjusted means and 95% CIs. The p values are for the tests of difference for change in adipose mass by genotype (Pro12Pro vs Ala12X), within treatment groups. The test of interaction between genotype and treatment groups was not statistically significant for any CT measure
Interaction between Pro12Ala genotype and dietary fat intake on change in body composition
Owing to the significant genotype-by-treatment-group interaction on weight change (p=0.01), we assessed the interaction between Pro12Ala and P:S ratio on 1 year weight change within treatment groups. In these models, we observed no significant interaction effects between Pro12Ala genotype and dietary P:S ratio on weight change within any of the intervention arms (all p values for interaction >0.17).
For the CT measures of body composition, we tested for interaction between Pro12Ala genotype and P:S ratio for each of the four CT slices. The Pro12Ala by P:S ratio interactions for SAT lumbar 2/3 (p=0.70), SAT lumbar 4/5 (p=0.45) and VAT lumbar 2/3 (p=0.24) were not significant. However, because the interaction between Pro12Ala and P:S ratio for change in VAT lumbar 4/5 was of borderline statistical significance (p=0.04), we continued by examining the Pro12Ala-by-P:S ratio interactions for VAT lumbar 4/5 within each of the three intervention arms. In the placebo (p=0.29) and lifestyle intervention (p=0.23) groups, the interaction was not statistically significant. However, within the metformin group, the interaction between Pro12Ala and P:S ratio on VAT lumbar 4/5 was statistically significant (p<0.001). Figure 3 shows the nature of this interaction in individuals randomised to metformin treatment. In Pro12 homozygotes, VAT was reduced to a similar degree irrespective of the level of P:S ratio. By contrast, in Ala12 allele carriers, an inverse association between P:S ratio and VAT lumbar 4/5 was apparent, where individuals consuming low P:S ratio diets (quartile 1) tended to gain VAT mass during the ensuing year, whereas those who consumed high P:S ratio diets (quartile 4) tended to lose VAT. After adjustment for multiple hypothesis testing (n tests=14), the P:S-ratio-by-genotype interaction on change in VAT lumbar 4/5 remained statistically significant (p=0.001).
Fig. 3.

Interaction between Pro12Ala genotype and polyunsaturated to saturated dietary fatty acid ratio (P:S ratio) for CT-assessed abdominal fat areas SAT lumbar 2/3 (a), SAT lumbar 4/5 (b), VAT lumbar 2/3 (c) and VAT lumbar 4/5 (d) in individuals randomised to metformin treatment. White bars, data from Pro12Pro genotype carriers (n=198); black bars, data from Ala12X genotype carriers (n=51). Data are adjusted means and 95% CIs. p= 0.125 (a), p=0.626 (b), p=0.064 (c) and p=0.0003 (d) for the tests of interaction between genotype (Pro12Pro vs Ala12X) and P:S ratio as a continuous trait, as reported in the Results
As a post hoc test, we tested whether the three-way interactions between Pro12Ala × treatment × P:S ratio on the VAT measures were significant, but found that they were not (VAT lumbar 2/3: p=0.60; VAT lumbar 4/5: p=0.46).
It is possible that a person’s ethnicity may influence the way in which they respond to questions about dietary fat intake. This could complicate the interpretation of tests of gene-nutrient interaction when performed in ethnically heterogeneous groups such as the DPP. Therefore, we repeated the P:S-ratio-by-Pro12Ala interaction analyses in Whites and Hispanics only (n=538). When all treatment groups were combined, the effect of P:S-ratio-Pro12Ala interaction on 1 year change in VAT area at lumbar 4/5 was of borderline statistical significance (p=0.07). As with the main analyses including all ethnic groups, this interaction term was statistically significant in individuals randomised to metformin treatment (p=0.0008). In the placebo group, the interaction on VAT area (lumbar 4/5) was also nominally significant (p=0.02) and was of borderline statistical significance for SAT area (lumbar 4/5; p=0.056). In the lifestyle group, the P:S-ratio-Pro12Ala interaction showed a similar trend for SAT area (lumbar 2/3; p=0.075), but no evidence of interaction on VAT area was observed.
Discussion
We have studied the role of the PPARG Pro12Ala genotype on body composition and adipose distribution assessed by CT scan in participants from the DPP. This is the only study to date to have assessed the interactions between Pro12Ala genotype and dietary fatty acid intake on changes in visceral or subcutaneous fat measured using gold-standard techniques. This is also the first clinical trial to assess the interactions between the Pro12Ala genotype and glucose-lowering drug treatment on obesity-related traits. We found that Ala12 allele carriers had more central adiposity at baseline, but in contrast to Pro12 allele carriers they lost weight during follow-up when assigned to the placebo arm of the study. In people randomised to either metformin treatment or intensive lifestyle modification, weight loss occurred in both genotype groups, but was greater in Ala12 allele carriers, suggesting that the effect of Pro12Ala genotype on weight change is independent of either intervention. In those randomised to the troglitazone arm, weight gain occurred, but was generally restricted to Ala12 allele carriers, suggesting an effect-modifying role for the Pro12Ala genotype in troglitazone-related weight gain. Whether this is due to fat accumulation, fluid retention or both could not be addressed in this study due to the lack of follow-up CT data in troglitazone participants. We also observed a significant interaction between genotype and dietary intake of PUFA, a putative PPARγ ligand, in individuals assigned to metformin treatment, where the inverse relationship between P:S ratio and change in VAT area at lumbar 4/5 was stronger in Ala12 allele carriers than in Pro12 homozygotes.
The two core research questions investigated in this study were defined a priori and were based on existing biological evidence. Our first hypothesis, that the Pro12Ala genotype is associated with obesity-related traits at baseline, is supported by a large body of evidence showing association between the Pro12Ala and anthropometric measures of obesity [24]. The availability of CT measurements of visceral and subcutaneous fat in the DPP enabled us to investigate whether the obesity-related effects of Pro12Ala localise to a specific adipose compartment. Our second hypothesis was that Pro12Ala genotypes and DPP interventions interact to modify changes in obesity-related traits. The observations that each of the DPP interventions invoked weight change [10], that obesity modifies the effect of Pro12Ala on diabetes incidence [17] and that Pro12Ala is known to associate with obesity phenotypes [24] justify testing for gene–treatment interactions at this locus. More specific support for these hypothesis tests comes from the published studies showing that dietary fats, physical activity and thiazolidinediones (TZDs) interact with PPARG to influence weight change [25, 26].
PPARγ, the protein encoded by PPARG, regulates adipogenesis, lipolysis and insulin sensitivity and is part of a family of nuclear transcription factors that may bind long-chain fatty acids and TZDs in a ligand-dependent manner. PPARγ is primarily expressed in white adipose tissue [27] and plays a pivotal role in adipocyte differentiation, as evidenced by the lack of adipose tissue in Pparg knockout mouse embryos [28]. The transcription of PPARG is regulated largely through the availability and binding potential of specific ligands. More than a decade ago, it was discovered that the synthetic PPARγ ligands include the TZD class of glucose-lowering drugs [26] and that the accumulation of adipose tissue following TZD treatment is mediated by induction of PPARG. More recently, in vitro studies have shown that inhibiting PPARG transcription via a pharmacological antagonist prevents many of the TZD-induced effects of PPARγ on adipocyte differentiation [29]. Endogenous PPARγ ligands include prostaglandins, while natural exogenous ligands may include long-chain (>20 carbon atoms) PUFAs. The ability of PUFAs to activate PPARG is thought to underlie the lower rates of diabetes observed in groups who consume diets rich in fish oils, such as Alaskan Inuits [30]. Several observational studies have reported interaction between dietary PUFA intake and Pro12Ala genotype, where the association between PUFA intake and insulin sensitivity, body weight or type 2 diabetes risk was stronger in Ala12 allele carriers than in those homozygous for the Pro12 allele [31–34].
The Pro12Ala genotype at PPARG is believed to alter the gene’s transcriptional activity owing to its location in the functional binding domain; it has been previously associated with risk of type 2 diabetes and its intermediate traits [16]. In the initial association studies, the risk of type 2 diabetes was approximately 20% lower in carriers of the minor Ala allele than in Pro12 homozygotes [14, 35]. Two recent meta-analyses have addressed the relationship between the Pro12Ala variant and obesity. In a meta-analysis of nearly 20,000 individuals, Masud and Ye [24] reported that BMI in carriers of the Ala12 allele was 0.07 kg/m2 higher than in Pro12 allele homozygotes (p=0.019). In a subsequent meta-analysis of 32,000 individuals, Tonjes et al. [12] reported no overall association between Pro12Ala genotype and BMI; however, in European Americans, BMI was significantly higher in Ala12 allele carriers than in Pro12 homozygotes. In the meta-analysis by Masud and Ye [24], the relationship between Pro12Ala and obesity was highly variable across studies (heterogeneity p<0.0001), raising the possibility that the genetic association may be modified by other unmeasured variables. Indeed, when these data were stratified by lean and overweight/obese, an association of 50% greater magnitude was observed in the overweight/obese group compared with the effect estimate when all data were combined (0.11 vs 0.07 BMI units higher in Ala12 allele carriers compared with Pro12 homozygotes in obese and all individuals, respectively) [24]. In the DPP, baseline obesity modified the effect of the Pro12Ala polymorphism on diabetes incidence [17], where the protective effects of the Ala allele on diabetes risk decrease in magnitude at higher BMI. These differences in the effect of Pro12Ala at different levels of obesity could be related to factors associated with weight gain, such as dietary fat intake, physical inactivity and treatment with TZDs, which modify the effect of Pro12Ala genotype on fat mass accumulation.
Several [32–34, 36], but not all [37, 38] studies examining the combined roles of lifestyle factors and Pro12Ala genotype have reported interaction between Pro12Ala and dietary fatty acid ratio on insulin resistance, type 2 diabetes or BMI. In the initial report on this topic, there was an interaction between the Pro12Ala genotype and dietary P:S ratio, such that Ala12 allele carriers were more obese than Pro12 homozygotes when dietary P:S ratio was low, whereas the opposite was true (i.e. Ala12 allele carriers were less obese than Pro12 homozygotes) when the P:S ratio was high [32]. Subsequent observational studies have reported similar findings [33, 34]. These cross-sectional gene-diet interactions are consistent with the longitudinal interactions we report here for changes in VAT area in people assigned to metformin treatment. The major limitation of the earlier observational studies, however, is that obesity may confound the apparent modifying effects of dietary fatty acids. This is because obesity and dietary fat intake (particularly when self-reported) are related [39] and their respective effects cannot be disentangled in observation data. Thus, it is reassuring that intervention studies where dietary fat intake is more tightly controlled have yielded comparable results. For example, in the Finnish Diabetes Prevention Study (DPS), a randomised controlled trial of lifestyle intervention in people at high risk of type 2 diabetes, Ala12 homozygotes lost more weight than Pro12 allele carriers, which is consistent with our findings in the DPP, while none of the six Ala12 homozygotes in the intervention arm of the DPS developed diabetes during 4 years of follow-up [36]. In a small Korean study, Ala12 allele carriers had more central and total fat mass than Pro12 homozygotes at baseline, which is also consistent with our findings. However, the Pro12Ala genotype did not modify changes in these parameters during a 1 month weight-loss intervention [38], which may be due to the short duration and small size of the study.
The study we report here is not without limitations. Thus DPP participants had elevated fasting glucose, impaired glucose tolerance and BMI≥24 kg/m2 (BMI≥22 kg/m2 for Asian Americans) at baseline. Therefore our results may not be generalisable to individuals who are lean or normoglycaemic. The DPP was neither designed nor sufficiently powered to determine whether the genotypic effects we report are ethnicity-specific, further limiting generalisability. Furthermore, the observed levels of statistical significance for some of the main genetic and interaction effects reported here are marginal and do not withstand adjustment for multiple hypothesis testing. To guard against an excessive number of false positive associations, it is customary to require very stringent p value thresholds (e.g. p<10−6) for statistical significance in genetic studies. However, the hypotheses in this report were defined a priori, are biologically plausible and our findings are consistent with existing data from observational studies; thus, our prior probability is higher than in many other scenarios and the requirements for such stringency may, in our view, be relaxed somewhat in this situation.
In summary, the Pro12Ala polymorphism is associated with various baseline measures of obesity in DPP participants. When assigned to intensive lifestyle intervention or treated with metformin, Ala12 allele carriers lost more weight and subcutaneous fat than Pro12 homozygotes. By contrast, when treated with troglitazone, Ala12 allele carriers tended to gain more weight than Pro12 allele homozygotes, although we cannot establish whether this is due to fluid retention, fat accumulation or both. Furthermore, dietary PUFA intake appeared to modify the effects of Pro12Ala on visceral fat area in people treated with metformin. In this group, the P:S ratio was associated with lower visceral fat area in carriers of the minor Ala12 allele than in Pro12 homozygotes. The mechanisms underlying this interaction remain to be determined, but our findings are consistent with genotype-dependent activation of the PPARG gene by nutritional ligands.
Acknowledgments
The National Institute of Diabetes and Digestive and Kidney Diseases (NIDDK) of the National Institutes of Health provided funding to the clinical centres and the Coordinating Center for the design and conduct of the study, as well as collection, management, analysis and interpretation of the data. The Southwestern American Indian Centers were supported directly by the NIDDK, including its Intramural Research Program and the Indian Health Service. The General Clinical Research Center Program, National Center for Research Resources supported data collection at many of the clinical centres. Funding for data collection and participant support was also provided by the Office of Research on Minority Health, the National Institute of Child Health and Human Development, the National Institute on Aging, the Centers for Disease Control and Prevention, Office of Research on Women’s Health and the American Diabetes Association. P. W. Franks was supported by grants from the Västerbottens regional health authority (Västerbottens ALF Committee), Novo Nordisk (370579201) and the Swedish Diabetes Association (DIA2006-013).
Bristol-Myers Squibb and Parke-Davis provided study drugs. Life-Scan, Health O Meter, Hoechst Marion Roussel, Merck-Medco Managed Care, Merck, Nike Sports Marketing, Slim Fast Foods and Quaker Oats donated materials, equipment or medicines for concomitant conditions. McKesson BioServices, Matthews Media Group and the Henry M. Jackson Foundation provided support services under subcontract with the Coordinating Center.
The investigators gratefully acknowledge the commitment and dedication of the participants of the DPP. We thank S. Marcovina and G. Strylewicz for careful processing of the DNA samples and M. Daly, N. Burtt and our colleagues at the Broad Institute Genetic Analysis Platform for excellent assistance.
Abbreviations
- CT
computed tomography
- DPP
Diabetes Prevention Program
- DPS
Diabetes Prevention Study
- NIDDK
National Institute of Diabetes and Digestive and Kidney Diseases
- PPARγ
peroxisome proliferator-activated receptor γ
- P
S ratio, ratio of polyunsaturated to saturated fatty acid
- PUFA
polyunsaturated fatty acid
- SAT
subcutaneous adipose tissue
- TZD
thiazolidinediones
- VAT
visceral adipose tissue
Footnotes
Electronic supplementary material The online version of this article (doi: 10.1007/s00125-007-0826-6) contains a full list of the Diabetes Prevention Program investigators, which is available to authorised users.
Duality of interest The authors declare that there is no duality of interest associated with this manuscript.
References
- 1.Despres JP. Intra-abdominal obesity: an untreated risk factor for type 2 diabetes and cardiovascular disease. J Endocrinol Invest. 2006;29(3 Suppl):77–82. [PubMed] [Google Scholar]
- 2.Mokdad AH, Bowman BA, Ford ES, Vinicor F, Marks JS, Koplan JP. The continuing epidemics of obesity and diabetes in the United States. JAMA. 2001;286:1195–1200. doi: 10.1001/jama.286.10.1195. [DOI] [PubMed] [Google Scholar]
- 3.Wilson PW, D’Agostino RB, Sullivan L, Parise H, Kannel WB. Overweight and obesity as determinants of cardiovascular risk: the Framingham experience. Arch Intern Med. 2002;162:1867–1872. doi: 10.1001/archinte.162.16.1867. [DOI] [PubMed] [Google Scholar]
- 4.Huang Z, Hankinson SE, Colditz GA, et al. Dual effects of weight and weight gain on breast cancer risk. JAMA. 1997;278:1407–1411. [PubMed] [Google Scholar]
- 5.Must A, Spadano J, Coakley EH, Field AE, Colditz G, Dietz WH. The disease burden associated with overweight and obesity. JAMA. 1999;282:1523–1529. doi: 10.1001/jama.282.16.1523. [DOI] [PubMed] [Google Scholar]
- 6.Fox CS, Heard-Costa NL, Vasan RS, Murabito JM, D’Agostino RB, Sr, Atwood LD. Genomewide linkage analysis of weight change in the Framingham Heart Study. J Clin Endocrinol Metab. 2005;90:3197–3201. doi: 10.1210/jc.2004-1752. [DOI] [PubMed] [Google Scholar]
- 7.Franks PW, Ravussin E, Hanson RL, et al. Habitual physical activity in children: the role of genes and the environment. Am J Clin Nutr. 2005;82:901–908. doi: 10.1093/ajcn/82.4.901. [DOI] [PubMed] [Google Scholar]
- 8.James PT. Obesity: the worldwide epidemic. Clin Dermatol. 2004;22:276–280. doi: 10.1016/j.clindermatol.2004.01.010. [DOI] [PubMed] [Google Scholar]
- 9.Ogden CL, Carroll MD, Curtin LR, McDowell MA, Tabak CJ, Flegal KM. Prevalence of overweight and obesity in the United States, 1999–2004. JAMA. 2006;295:1549–1555. doi: 10.1001/jama.295.13.1549. [DOI] [PubMed] [Google Scholar]
- 10.The Diabetes Prevention Program Research Group. Reduction in the incidence of type 2 diabetes with lifestyle intervention or metformin. N Engl J Med. 2002;346:393–403. doi: 10.1056/NEJMoa012512. [DOI] [PMC free article] [PubMed] [Google Scholar]
- 11.Hamman RF, Wing RR, Edelstein SL, et al. Effect of weight loss with lifestyle intervention on risk of diabetes. Diabetes Care. 2006;29:2102–2107. doi: 10.2337/dc06-0560. [DOI] [PMC free article] [PubMed] [Google Scholar]
- 12.Tonjes A, Scholz M, Loeffler M, Stumvoll M. Association of Pro12Ala polymorphism in peroxisome proliferator-activated receptor gamma with pre-diabetic phenotypes: meta-analysis of 57 studies on nondiabetic individuals. Diabetes Care. 2006;29:2489–2497. doi: 10.2337/dc06-0513. [DOI] [PubMed] [Google Scholar]
- 13.Yen CJ, Beamer BA, Negri C, et al. Molecular scanning of the human peroxisome proliferator activated receptor gamma (hPPAR gamma) gene in diabetic Caucasians: identification of a Pro12Ala PPAR gamma 2 missense mutation. Biochem Biophys Res Commun. 1997;241:270–274. doi: 10.1006/bbrc.1997.7798. [DOI] [PubMed] [Google Scholar]
- 14.Deeb SS, Fajas L, Nemoto M, et al. A Pro12Ala substitution in PPARgamma2 associated with decreased receptor activity, lower body mass index and improved insulin sensitivity. Nat Genet. 1998;20:284–287. doi: 10.1038/3099. [DOI] [PubMed] [Google Scholar]
- 15.Beamer BA, Yen CJ, Andersen RE, et al. Association of the Pro12Ala variant in the peroxisome proliferator-activated receptor-gamma2 gene with obesity in two Caucasian populations. Diabetes. 1998;47:1806–1808. doi: 10.2337/diabetes.47.11.1806. [DOI] [PubMed] [Google Scholar]
- 16.Hansen L, Pedersen O. Genetics of type 2 diabetes mellitus: status and perspectives. Diabetes Obes Metab. 2005;7:122–135. doi: 10.1111/j.1463-1326.2004.00396.x. [DOI] [PubMed] [Google Scholar]
- 17.Florez JC, Jablonski KA, Sun MW, et al. Effects of the type 2 diabetes-associated PPARG P12A polymorphism on progression to diabetes and response to troglitazone. J Clin Endocrinol Metab. 2007;92:1502–1509. doi: 10.1210/jc.2006-2275. [DOI] [PMC free article] [PubMed] [Google Scholar]
- 18.The Diabetes Prevention Program Research Group. The Diabetes Prevention Program: baseline characteristics of the randomized cohort. Diabetes Care. 2000;23:1619–1629. doi: 10.2337/diacare.23.11.1619. [DOI] [PMC free article] [PubMed] [Google Scholar]
- 19.Block G, Subar AF. Estimates of nutrient intake from a food frequency questionnaire: the 1987 National Health Interview Survey. J Am Diet Assoc. 1992;92:969–977. [PubMed] [Google Scholar]
- 20.Mayer-Davis EJ, Sparks KC, Hirst K, et al. Dietary intake in the diabetes prevention program cohort: baseline and 1-year post randomization. Ann Epidemiol. 2004;14:763–772. doi: 10.1016/j.annepidem.2004.02.004. [DOI] [PubMed] [Google Scholar]
- 21.Fujimoto WY, Jablonski KA, Bray GA, et al. Body size and shape changes and the risk of diabetes in the diabetes prevention program (DPP) Diabetes. 2007;56:1680–1685. doi: 10.2337/db07-0009. [DOI] [PMC free article] [PubMed] [Google Scholar]
- 22.Greenberg RS, Kleinbaum DG. Mathematical modeling strategies for the analysis of epidemiologic research. Annu Rev Public Health. 1985;6:223–245. doi: 10.1146/annurev.pu.06.050185.001255. [DOI] [PubMed] [Google Scholar]
- 23.Holm S. A simple sequentially rejective Bonferroni test procedure. Scand J Stat. 1979;6:5–70. [Google Scholar]
- 24.Masud S, Ye S. Effect of the peroxisome proliferator activated receptor-gamma gene Pro12Ala variant on body mass index: a meta-analysis. J Med Genet. 2003;40:773–780. doi: 10.1136/jmg.40.10.773. [DOI] [PMC free article] [PubMed] [Google Scholar]
- 25.Franks PW, Mesa JL, Harding AH, Wareham NJ. Gene-lifestyle interaction on risk of type 2 diabetes. Nutr Metab Cardiovasc Dis. 2007;17:104–124. doi: 10.1016/j.numecd.2006.04.001. [DOI] [PubMed] [Google Scholar]
- 26.Lambe KG, Tugwood JD. A human peroxisome-proliferator-activated receptor-gamma is activated by inducers of adipogenesis, including thiazolidinedione drugs. Eur J Biochem. 1996;239:1–7. doi: 10.1111/j.1432-1033.1996.0001u.x. [DOI] [PubMed] [Google Scholar]
- 27.Ferre P. The biology of peroxisome proliferator-activated receptors: relationship with lipid metabolism and insulin sensitivity. Diabetes. 2004;53(Suppl 1):S43–S50. doi: 10.2337/diabetes.53.2007.s43. [DOI] [PubMed] [Google Scholar]
- 28.Barak WY, Nelson MC, Ong ES, et al. PPAR gamma is required for placental, cardiac, and adipose tissue development. Mol Cell. 1999;4:585–595. doi: 10.1016/s1097-2765(00)80209-9. [DOI] [PubMed] [Google Scholar]
- 29.Camp HS, Chaudhry A, Leff T. A novel potent antagonist of peroxisome proliferator-activated receptor gamma blocks adipocyte differentiation but does not revert the phenotype of terminally differentiated adipocytes. Endocrinology. 2001;142:3207–3213. doi: 10.1210/endo.142.7.8254. [DOI] [PubMed] [Google Scholar]
- 30.Ebbesson SO, Risica PM, Ebbesson LO, Kennish JM, Tejero ME. Omega-3 fatty acids improve glucose tolerance and components of the metabolic syndrome in Alaskan Eskimos: the Alaska Siberia project. Int J Circumpolar Health. 2005;64:396–408. doi: 10.3402/ijch.v64i4.18016. [DOI] [PubMed] [Google Scholar]
- 31.Franks PW, Luan J, Browne PO, et al. Does peroxisome proliferator-activated receptor gamma genotype (Pro12ala) modify the association of physical activity and dietary fat with fasting insulin level? Metabolism. 2004;53:11–16. doi: 10.1016/j.metabol.2003.08.005. [DOI] [PubMed] [Google Scholar]
- 32.Luan J, Browne PO, Harding AH, et al. Evidence for gene-nutrient interaction at the PPARgamma locus. Diabetes. 2001;50:686–689. doi: 10.2337/diabetes.50.3.686. [DOI] [PubMed] [Google Scholar]
- 33.Memisoglu A, Hu FB, Hankinson SE, et al. Interaction between a peroxisome proliferator-activated receptor gamma gene polymorphism and dietary fat intake in relation to body mass. Hum Mol Genet. 2003;12:2923–2929. doi: 10.1093/hmg/ddg318. [DOI] [PubMed] [Google Scholar]
- 34.Robitaille J, Despres JP, Perusse L, Vohl MC. The PPAR-gamma P12A polymorphism modulates the relationship between dietary fat intake and components of the metabolic syndrome: results from the Quebec Family Study. Clin Genet. 2003;63:109–116. doi: 10.1034/j.1399-0004.2003.00026.x. [DOI] [PubMed] [Google Scholar]
- 35.Altshuler D, Hirschhorn JN, Klannemark M, et al. The common PPARgamma Pro12Ala polymorphism is associated with decreased risk of type 2 diabetes. Nat Genet. 2000;26:76–80. doi: 10.1038/79216. [DOI] [PubMed] [Google Scholar]
- 36.Lindi VI, Uusitupa MI, Lindstrom J, et al. Association of the Pro12Ala polymorphism in the PPAR-gamma2 gene with 3-year incidence of type 2 diabetes and body weight change in the Finnish Diabetes Prevention Study. Diabetes. 2002;51:2581–2586. doi: 10.2337/diabetes.51.8.2581. [DOI] [PubMed] [Google Scholar]
- 37.Poirier O, Nicaud V, Cambien F, Tiret L. The Pro12Ala polymorphism in the peroxisome proliferator-activated receptor gamma2 gene is not associated with postprandial responses to glucose or fat tolerance tests in young healthy subjects: the European Atherosclerosis Research Study II. J Mol Med. 2000;78:346–351. doi: 10.1007/s001090000117. [DOI] [PubMed] [Google Scholar]
- 38.Kim KS, Choi SM, Shin SU, Yang HS, Yoon Y. Effects of peroxisome proliferator-activated receptor-gamma 2 Pro12Ala polymorphism on body fat distribution in female Korean subjects. Metabolism. 2004;53:1538–1543. doi: 10.1016/j.metabol.2004.06.019. [DOI] [PubMed] [Google Scholar]
- 39.Heitmann BL, Lissner L. Can adverse effects of dietary fat intake be overestimated as a consequence of dietary fat under-reporting? Public Health Nutr. 2005;8:1322–1327. doi: 10.1079/phn2005750. [DOI] [PubMed] [Google Scholar]