

Summary
Elucidating the mechanism of transcription initiation by RNA polymerases (RNAP) is essential for understanding gene transcription and regulation. Although several models such as DNA scrunching, RNAP translation, and RNAP rotation have been proposed, the mechanism of initiation by T7 RNAP has remained unclear. Using ensemble and single molecule Förster resonance energy transfer (FRET) studies, we provide evidence for concerted DNA scrunching and rotation during initiation by T7 RNAP. A constant spatial distance between the upstream and downstream edges of initiation complexes making 4-7 nt RNA supports the DNA scrunching model, but not the RNAP translation or the pure rotation model. DNA scrunching is accompanied by moderate hinging motion (18 ± 4°) of the promoter towards the downstream DNA. The observed step-wise conformational changes provide a basis to understand abortive RNA synthesis during early stages of initiation and promoter escape during the later stages that allows transition to processive elongation.
Introduction
The initial phase of the transcription reaction catalyzed by DNA-dependent RNA polymerases (RNAP) is a multistep process that begins with the formation of an open complex and ends when the RNAP makes the transition into a stable elongation complex (Hsu, 2002; Kinsella et al., 1982; Straney and Crothers, 1987; Young et al., 2002). During transcription initiation, RNAPs make short abortive products from 2 to ~8 nt while maintaining stable interactions with the promoter (Carpousis and Gralla, 1985; Hieb et al., 2006; Ikeda and Richardson, 1986; Ikeda and Richardson, 1987; Krummel and Chamberlin, 1989; Straney and Crothers, 1987). When the length of RNA transcript reaches >8 nt, the RNAP starts to release itself from the promoter and to make the transition into an elongation complex (Bandwar et al., 2006; Carpousis and Gralla, 1985; Esposito and Martin, 2004; Guo and Sousa, 2005; Hieb et al., 2006; Ikeda and Richardson, 1986; Ikeda and Richardson, 1987; Krummel and Chamberlin, 1989; Straney and Crothers, 1987; Temiakov et al., 2000). The transition from the initiation complex (IC) to the elongation complex (EC) in single-subunit T7 RNAP involves large scale protein structural reorganizations (Bandwar et al., 2006; Guo et al., 2005; Ma et al., 2002; Mukherjee et al., 2002; Tahirov et al., 2002; Yin and Steitz, 2002). In multi-subunit RNAPs, this process can involve release of one or more initiation protein factors and binding of elongation factors (Borukhov and Nudler, 2003; Mooney et al., 2005).
Crystal structures of the single subunit T7 RNAP-DNA complexes bound to a promoter with a 3 nt RNA in the IC3 state and to a 8 bp RNA/DNA hybrid in the EC state have provided a wealth of information on the changes that occur during the IC to EC transition (Cheetham et al., 1999; Tahirov et al., 2002; Yin and Steitz, 2002). The IC3 and the EC structures of T7 RNAP represent the beginning and the final conformations in the transition process, and their distinct folding states raise many interesting questions regarding the mechanism of transcription initiation (Steitz, 2006). The promoter in the early IC state is sharply bent and melted downstream from −4 to ~+3 (Cheetham and Steitz, 1999; Tang and Patel, 2006b; Turingan et al., 2007a) (Figure 1A). The promoter region (-4 to −17) upstream of the transcription start site (+1) is bound by the specificity loop (739-772) and by two elements of the N-terminal subdomain, the AT-rich loop (93-101) and the intercalating hairpin loop (230-245). These promoter specific RNAP interactions are maintained throughout initial transcription while the RNA:DNA hybrid grows to a length of 8 bp and the DNA bubble expands from −4 to +8 (Bandwar et al., 2006; Brieba and Sousa, 2001; Gong et al., 2004; Liu and Martin, 2002; Temiakov et al., 2000). The crystal structure of T7 RNAP in the IC state indicates no room to accommodate an RNA:DNA hybrid greater than 3 bp without having the DNA and/or RNAP undergoing conformational changes (Cheetham and Steitz, 1999). It is not known what DNA/RNAP conformational changes occur to accommodate the growing RNA:DNA hybrid to avoid steric hindrances within the RNAP active site, and when these changes occur during transcription initiation. A number of models have been proposed, but there is little consensus among them (Brieba and Sousa, 2001; Cheetham and Steitz, 1999; Tahirov et al., 2002; Theis et al., 2004; Yin and Steitz, 2002).
Figure 1. Three models of initial transcription: DNA scrunching, RNAP translation, and RNAP rotation.

(A) Modeled structure of the initiation complex (IC3) of T7 RNAP (rendered using PDB 1QLN using Accelrys DS ViewerPro 5.0). RNA transcript is not shown and the DNA fragment upstream of −17 is reconstructed using a DNA model server (Munteanu et al., 1998). The C-terminal domain of T7 RNAP is gray, the N-subdomain (aa1-70) is yellow, the core subdomain (aa72-151, 206-257) is pink, the flap-like domain (subdomain H, aa152-205) is green, and the specificity loop (aa738-773) is blue. The DNA template and nontemplate strands are in green and red, respectively. The donor dye was placed at -4 in the NT strand (-4NT) or at the upstream 5’ end (-22NT), and the acceptor dye was placed at downstream positions in the T strand. (B) Cartoons show the three models of T7 RNAP transcription initiation pathway: DNA scrunching (top), RNAP translation (middle), and RNAP rotation (bottom). During transcription initiation, the downstream DNA moves toward the active center (thick black arrow) while the promoter remains bound to the N-terminal subdomain. In the pure DNA scrunching model, the promoter and the upstream edge of the bubble (-4 NT) remains unmoved while the downstream template is compacted around the active center (dotted circle). In the translation model, the promoter moves away from the fixed active center in the C-terminal domain accompanied by the translational detachment of the N-terminal domain. In the pure rotation model the N terminal domain undergoes a series of conformational changes that result in the rotation of the promoter and final transition into the elongation conformation at 8/9 nt RNA synthesis.
Three general models have been proposed to explain the synthesis of >3 nt long RNA during transcription initiation and these are based on whether RNAP deformations or DNA scrunching generated stress is accountable for the transition to elongation complex (Brieba and Sousa, 2001; Cheetham and Steitz, 1999; Tahirov et al., 2002; Theis et al., 2004; Yin and Steitz, 2002). Of the two schemes based on RNAP conformational changes, the RNAP translation (or shifting) model postulates that the N-terminal domains linked via flexible elements moves gradually away from the fixed C-terminal domain of T7 RNAP during transcription initiation (Theis et al., 2004; Turingan et al., 2007b) (Figure 1B), whereas the rotation (or twisting) model postulates that the N-terminal subdomain rotates to make room for the growing RNA:DNA hybrid, and this rotation starts from as early as 4-5 nt RNA synthesis to attain a full EC conformation by ~8-9 nt RNA synthesis (Tahirov et al., 2002). The translation and rotation models postulate that the accumulation of stress from the RNAP conformational changes provides the driving force for destabilizing the initial transcriptional complexes and for triggering the IC to EC transition. The DNA scrunching model suggests a different pathway in which RNAP does not undergo conformational changes, but the downstream template DNA is continually scrunched in the active site pocket during transcription initiation (Brieba and Sousa, 2001; Cheetham and Steitz, 1999) (Figure 1B). Stress generated from the scrunched DNA is postulated to be the driving force for triggering promoter release and RNAP conformational changes during EC formation (Brieba and Sousa, 2001; Cheetham et al., 1998; Cheetham and Steitz, 1999). Note that these are not mutually exclusive models and combinations of them are possible ways to catalyze transcription initiation.
Recent studies of transcription initiation by the multi-subunit E.coli RNAP have provided evidence for DNA scrunching as the primary mechanism for abortive synthesis and the driving force for IC to EC transition (Kapanidis et al., 2006; Revyakin et al., 2006). These studies rejected the “inchworming” model in which the enzyme active site module translocates down the DNA relative to the remainder of the RNAP and the “transient incursion” model in which the RNAP molecule goes back and forth down the DNA by transiently releasing the promoter. The proposed movements of the N-terminal subdomain of the single-subunit T7 RNAP relative to the fixed active site region in the translation model are analogous to the “inchworming” changes in E. coli RNAP that invoke expansion of the RNAP to accommodate the growing RNA:DNA hybrid. DNA scrunching of the downstream template DNA was observed in the beginning stages of the transcription initiation (up to 4 nt synthesis) by T7 RNAP (Cheetham and Steitz, 1999), but there has been no evidence for scrunching throughout transcription initiation. In this paper, we have designed ensemble and single molecule fluorescence resonance energy transfer (FRET) experiments to investigate the mechanism of transcription initiation by T7 RNAP. Fluorescent donor and acceptor dye pairs were positioned at specific sites on the DNA carrying the consensus T7 promoter sequence and their spatial distances were measured during transcription initiation to distinguish between DNA scrunching and RNAP movement based models. From the results of these studies, we provide clear evidence for the co-existence of DNA scrunching and promoter rotation, likely accompanied by the rotation of the N-terminal subdomain that maintains its contact with the promoter during transcription initiation.
Results
Single molecule and ensemble FRET support DNA scrunching
During transcription initiation as the RNA length increases from 2 to 7 nt, the downstream DNA is expected to be pulled into the active site. The DNA scrunching model stipulates that the upstream edge of the transcription bubble does not shift from its original position in the initiation complex with respect to the active site, and hence the spatial distance between a dye placed at the upstream edge of the transcription bubble (-4 position on nontemplate strand (NT), -4NT) and a dye at a downstream position (e.g., +18) would progressively decrease during transcription initiation (Figure 2A). To test this model, internally labeled DNA carrying a donor (TAMRA) at -4NT and an acceptor (Alexa 647) at +18 on the template strand were made for FRET measurements during transcription. In the first set of experiments, FRET was measured in free DNA, RNAP-DNA complex, RNAP-DNA initiation complexes (ICN) making 2 to 7 nt maximum length RNA, and RNAP-DNA elongation complex making 10 nt RNA (Figure 2B). ICN complexes were generated by incubating T7 RNAP with a dye-labeled promoter DNA and walking complexes to a predefined position (N) using a limiting set of NTPs or a mixture of NTPs+3’-dNTP. The mean donor-acceptor (D-A) distances were calculated from the observed ensemble FRET (Figure 2C). The D-A distance of ~80 Å in the free DNA is consistent with calculated distance between dyes at −4 and +18 positions on a B-form DNA (Clegg, 1992). Upon formation of the RNAP-DNA complex, the (D-A) distance decreases somewhat consistent with DNA bending in the binary complex (Tang and Patel, 2006a; Tang and Patel, 2006b; Turingan et al., 2007a; Ujvari and Martin, 2000). Upon addition of 3’-dGTP, a further decrease in D-A distance is observed, which is consistent with sharper DNA bending in the IC2 complex (Tang and Patel, 2006a; Tang and Patel, 2006b). From 2 to 4 nt RNA synthesis, the D-A distance decreases by ~4 Å, which is consistent with initial DNA scrunching observed in crystal structures (Cheetham and Steitz, 1999). The distance decreases even further in complexes making 7 nt maximum length RNA. The same results were obtained when the experiments were carried out with the Cy3-Cy5 dye pair (Figure S1). These results are consistent with DNA scrunching from 4 to 7 nt RNA synthesis.
Figure 2. FRET between dyes at -4 and +18 supports DNA scrunching.

(A) The cartoons show T7 RNAP-DNA complexes from IC2 to IC7 and EC. The structures in the cartoons do not imply any mechanism of initiation. E.g., the structures of closed complex, IC7 and EC/IC10 are not known and speculative. The various transcriptional complexes were generated by mixing dye labeled promoter (100 nM, seq5 or seq16), T7 RNAP (120 nM) with 3’-dGTP (IC2), GTP (IC3), GTP + 3’-dATP (IC4, seq5 and 16), GTP + ATP + 3’-dCTP (IC7, seq16), or GTP + ATP +CTP (IC/EC10, seq16). The concentration of 3’-dGTP and GTP was 1 mM each and rest of the NTPs was 0.5 mM each. (B) FRET (y-axis) was measured between dyes at -4NT(TAMRA) and +18T (Alexa647) on the DNA at 25°C. (C) The D-A distances (Rda) were calculated from the FRET values using Ro (Figure S2) and Eq. 1.
To eliminate the presence of translational and/or rotational motions of the promoter, the observed D-A distance changes need to be compared to predicted distances from modeled structures. The DNA in the IC2 is sharply bent at several points and distorted (Figure 1A), and similar DNA conformation is expected for the ICN complexes. Therefore, modeling and distance predictions involve many assumptions making it an unreliable exercise. Accordingly, although the above results are consistent with DNA scrunching, they do not eliminate concomitant translation and/or rotational motions of the promoter DNA during transcription initiation. To distinguish between DNA scrunching and other possible mechanisms, we have designed a different scheme that allows us to measure relative distance changes between the upstream and the downstream edges of the transcriptional bubble as T7 RNAP is walked from +4 to +7. According to the scrunching model (Brieba and Sousa, 2001; Cheetham et al., 1998; Cheetham and Steitz, 1999; Kapanidis et al., 2006), the spatial distance between the upstream edge of the transcription bubble (-4NT) and a position close to the downstream edge (e.g., N+2, where N is the maximum length of RNA made) will remain constant during 4-7 nt synthesis (Figure 3A). On the other hand, the translation or the rotation model suggests movement of the upstream edge of the initial bubble (Tahirov et al., 2002; Theis et al., 2004; Turingan et al., 2007b) and predicts that the −4 position will progressively increase its distance from the downstream end during 4-7 nt synthesis (Figure 3A). Therefore, the models can be distinguished from a set of experiments that provide relative changes in D-A distances between the upstream and downstream edges of the transcription bubble as T7 RNAP is walked from +4 to +7, without relying on comparing D-A distances to predicted ones from modeled structures.
Figure 3. Ensemble FRET supports DNA scrunching during initial transcription.

(A) Predicted changes in distance between dyes at −4NT and N+m in the T7 RNAP-DNA according to the DNA scrunching mechanism (left) or the translation mechanism (right). The numbers within the spheres are schematic positions of the donor dye Cy3 (shaded sphere) and the 5’-end of the DNA (blank sphere) predicted by the translation model upon walking from +4 to +7. In the N/N+m walking experiments, complexes halted at position N contained the acceptor dye Cy5 at N+m position (black hexagon). The DNA scrunching model predicts that the D-A spatial distances (RDA) between dyes at −4NT and N+m will remain constant from 4 to 7 nt RNA synthesis whereas the translation model predicts that the distance will progressively increase. (B) Average D-A distances between Cy3 and Cy5 in ICN complexes in the N/N+2 and N/N+3 experiments calculated from FRET values (Table S2). (C) Average D-A distances in the N/N+4 and N/N+5 experiments. Data with error bars (standard deviation) were averaged from multiple measurements. In panels B and C, the D-A distances in EC halted at +14, +15 or +12 are also shown.
Internally labeled DNAs carrying a donor (Cy3) at position −4NT representing the upstream edge of transcription bubble and an acceptor (Cy5) at defined positions from +6 to +12 in the template strand (each defined position being close to the downstream edge of the transcription bubble in the initiation) were made for FRET measurements (Figure 3A). Gel based transcription assays demonstrated that the labeled DNAs served as specific promoters and dye-labeling did not affect transcription (Figure S2). Fluorescent quantum yield measurements indicated that the Förster radius (R0) of the Cy3-Cy5 dye pair was ~50 Å in free DNA and increased to 52 and 53-55 Å in T7 RNAP-promoter complex and transcription complexes (Figure S3). In the N/N+m walking experiments, T7 RNAP was incubated with dye-labeled promoter DNA, walked to a predefined position, N (where N is the maximum length of transcript made in the transcriptional complex), using a limiting set of NTPs or a mixture of NTPs+3’-dNTP, and FRET was measured between Cy3 at −4 and Cy5 at N+m position (m=2, 3, 4, or 5). In these N/N+2 experiments (m=2), the mean D-A distances remained nearly constant, around 43 Å, despite growth of the RNA:DNA hybrid from 4 to 7 bp (Figure 3B). On the other hand, when RNAP was walked to +15, when it is expected to have undergone transition from initiation to elongation, the D-A distance was considerably longer (~62 Å). The same result was obtained with dyes at −4 and N+3 (N/N+3 experiments); that is, the mean D-A distances in the N/N+3 experiments remained nearly constant in complexes making 4 to 7 nt RNA and changed to a longer one in complexes making 14 nt RNA (Figure 3B). Additional experiments with dyes at −4 and N+4 or N+5 showed a constant D-A distance from 4 to 7 nt RNA synthesis, but an increased distance in complex making 12 nt RNA (Figure 3C). These results provide a clear distinction between the models; the data are consistent with the DNA scrunching model, but are inconsistent with the translation or the rotation model without DNA scrunching.
The above experiments were next carried out under single molecule conditions. Single molecule FRET approaches have the ability to resolve multiple populations if present (Deniz et al., 1999; Ha et al., 1996; Ha et al., 1999), and hence can provide an accurate description of complexes present during transcription initiation (Kapanidis et al., 2006; Lee et al., 2005; Roy et al., 2007). Single molecule FRET experiments were carried out with promoters containing dyes at −4 NT and at N+3 positions on the T strand. The dye-labeled DNA with the promoter sequence was surface immobilized through a short linker with a biotin at the 3’end (strand B, Table S1) (Figure 4A). FRET efficiency was measured for each dually labeled DNA construct without T7 RNAP, and after walking T7 RNAP-DNA to predefined positions. FRET histograms were created with quantified fluorescence intensities of donor (ID) and acceptor (IA) for thousands of individual molecules. The histograms displayed a narrow distribution of FRET values and indicated the presence of a single population of transcribing complexes (Figure 4B). FRET between dyes at -4 and N+3 were measured after walking T7 RNAP-DNA to different positions from +3 to +7. The FRET values (Figure 4B) and D-A distances (Figure 4C) remained almost unchanged in these initiation complexes, and as expected FRET decreased in complex making 14 nt RNA (Figure 4B). These results are consistent with ensemble FRET and indicate that the spatial distance between upstream and downstream edges of the transcription bubble remains constant as RNA is elongated from 3 to 7 nt. The presence of a single population ensures that FRET values are indicative of D-A distance changes in transcriptional complexes with fully transcribed RNA and not an average D-A distance of several populations.
Figure 4. Single molecule FRET supports DNA scrunching.

(A) The diagram shows the single molecule FRET experimental scheme. (B) FRET histograms of single molecule T7 RNAP initial transcription. X axis represents the ratios of IA/(ID+IA) termed apparent FRET (FRETapp) and Y-axis represents the frequency of transcription complexes with respective FRET values. Peak FRET values as indicated by the dashed line was used for the estimation of D-A distances (RDA). (C) RDA plotted as a function of walking position (N) for DNA only and transcribing complexes calculated from the FRET values (Table S2). Data with error bars (standard deviation) are averaged from multiple measurements.
FRET studies indicate movement of the promoter region during initial transcription
The constant distance observed between the upstream and downstream edges of the transcription bubble in ICN eliminates translation or rotation of promoter without scrunching, but it does not necessarily exclude DNA scrunching plus rotation movements. To investigate if the promoter (-17 to −4) undergoes movement during transcription initiation, donor TAMRA was placed at −22 NT and acceptor Alexa 647 at various positions downstream in the template strand for N/N+2 or N/N+3 experiments (Figure 5A). The D-A pair has an R0 of 65-67 Å that remained unchanged in the transcriptional complexes (Figure S2) (Kapanidis et al., 2006; Lee et al., 2005). Transcription was halted at various positions between +4 and +7 using limiting sets of NTPs, and ensemble FRET efficiencies were measured between dyes at −22 and N/N+2 or N/N+3 (Figure 5B). FRET indicated a progressive increase in the mean D-A distances between −22 and downstream positions (N+2 or N+3) with the RNA lengths increasing from 4 to 7 nt. Similar results were obtained when dyes were placed at −22 and N/N+4 or N/N+5 (Figure 5C). The maximal increase in D-A distance during 4 to 7 nt synthesis was ~20Ǻ. These results suggest that the promoter region moves away from the downstream edge of the initiation bubble as transcription proceeds from +4 to +7. This is in clear contrast to the constant distance maintained between the upstream and downstream edge of the transcriptional bubble during 3 to 7 nt RNA synthesis.
Figure 5. Movement of the promoter during transcription initiation.

(A) D-A distance changes between TAMRA at -22NT and Alexa 647 at N+m downstream of +5 during 4 to 7 nt synthesis as predicted by DNA scrunching (top, constant distances) and scrunching+rotation (bottom, increased distances). The numbers in the spheres are schematic positions of TAMRA predicted by the scrunching and rotation mechanism as the downstream DNA moves toward the active center. (B) D-A distances in ICN in the N/N+2 and N/N+3 experiments (as in Figure 3) calculated from FRET values (Table S2). (C) D-A distances in ICN in the N+4 or N+5 experiments. Data with error bars (standard deviation) were averaged from multiple measurements.
To investigate if the -4 to −17 region of the promoter undergoes conformational changes such as bending/unbending during transcription initiation, acceptor Alexa 647 was placed at -22T and donor TAMRA at −4NT (Figure S4a). FRET measured in transcriptional complexes walked from +4 to +8 did not show any significant changes in the distance between −22 and −4 (mean distance of ~75-77 Å) (Figure S4b). These data exclude major global conformational changes within the promoter region upstream of the initiation site.
Based on the combined data presented above, we propose that the changes in the spatial distance between dyes at −22NT and the downstream edge of the transcription bubble originate from rotation of the promoter around a hinge close to the upstream edge of the transcription bubble. The observed distance changes indicate that this rotation or hinging of the promoter region occurs in a direction away from the downstream edge of the initiation bubble. Since the promoter remains bound to the N-terminal subdomain of T7 RNAP throughout initial transcription (Bandwar et al., 2006; Esposito and Martin, 2004; Guo et al., 2005; Ikeda and Richardson, 1986; Ikeda and Richardson, 1987), the results imply that the N-terminal subdomain rotates during initial transcription. The overall results support the model of concerted DNA scrunching and upstream promoter rotation of the transcription initiation by T7 RNAP.
D-A distances between −22/+18 during transcription initiation support promoter rotation
In the next set of experiments, FRET between dyes at the upstream and downstream ends of the DNA was measured. One dye was placed at −22NT and the other dye at +18 in the template strand (+18T), and FRET was measured in ICN complexes (where N is the length of RNA from 4 to 7 nt). These FRET values were compared to those in IC2 where dyes were placed at -22NT and at +(18-N) in the template strand (+(18-N)T). It is believed that the DNA downstream of the initiation site maintains the same configuration and orientation throughout initiation and elongation phases (Turingan et al., 2007a). Therefore, the pure DNA scrunching model predicts that the spatial distance between dyes (at −22NT and +18T) in ICN will be the same as the distance between dyes at −22NT and +(18-N)T in IC2 (Figure 6A). The translation model predicts that the distance will be greater in ICN than in IC2, whereas the scrunching/rotation model predicts a shorter distance in ICN relative to IC2 (Figure 6A). The results show that the D-A distances are shorter in ICN making 5 to 7 nt RNA compared to those in IC2 (Figure 6B). The results are not consistent with the translation model or the pure DNA scrunching model, and are best explained by rotation or hinging of the promoter in a direction that leads it away from the active center but toward the downstream DNA. These data provide further support for the scrunching and rotation model by T7 RNAP.
Figure 6. Additional FRET studies support DNA scrunching/promoter rotation mechanism.
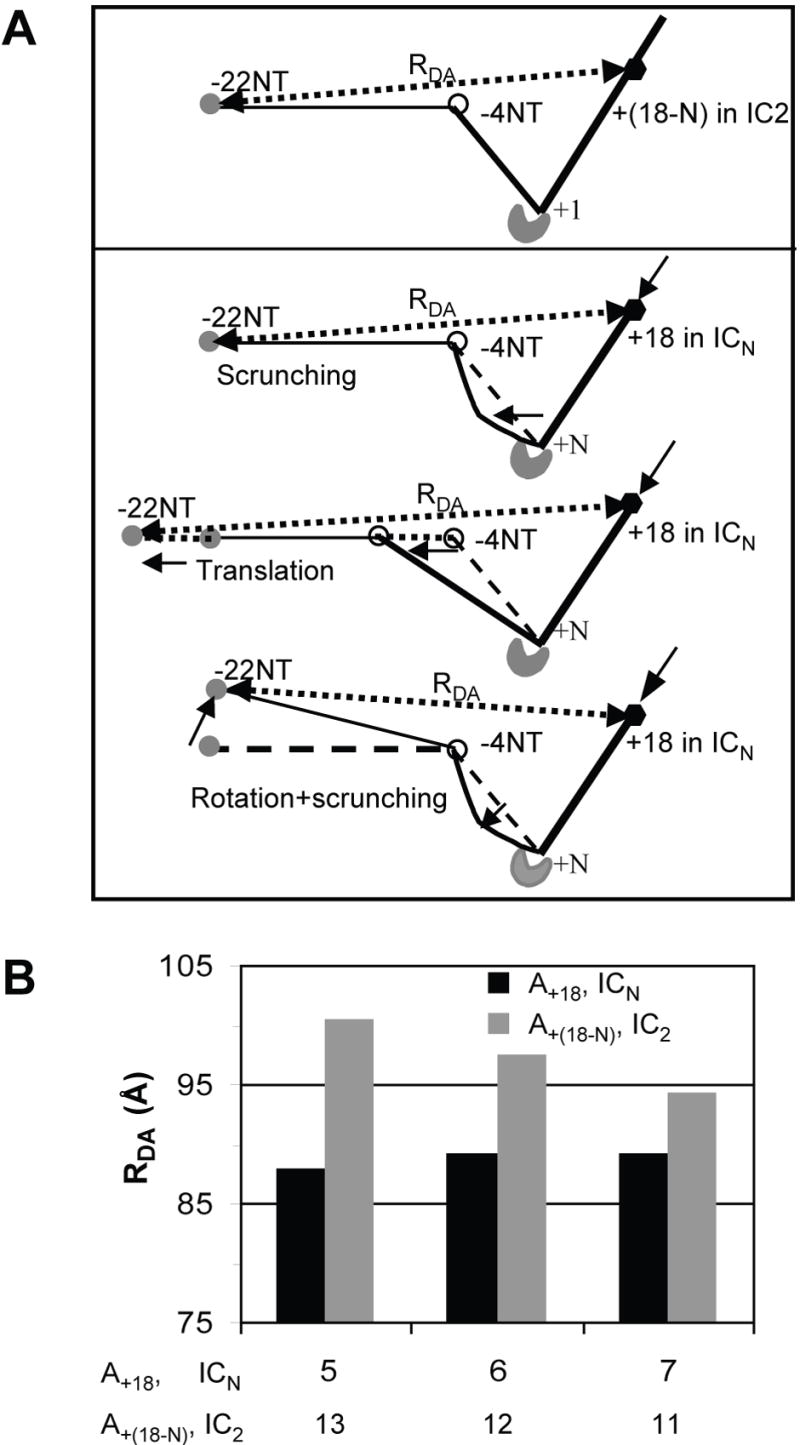
(A) Predicted D-A distances between TAMRA at −22 (shaded sphere) and Alexa 647 (black hexagon) at +18 in ICN and between TAMRA at −22 and Alexa 647 at +(18-N) in IC2 according to the pure DNA scrunching, translation, or scrunching/rotation model. The D-A distance in ICN is predicted to be equal (pure DNA scrunching model), greater (pure translation model), or shorter (scrunching/rotation model) than in the IC2. (B) Mean D-A distances between dyes at −22NT and +18 in ICN compared to those between dyes at −22 NT and +(18-N) in IC2.
Estimation of promoter rotation and its implication
We can estimate the extent of promoter rotation during transcription initiation using the D-A distance changes from the FRET studies above. The calculations were based on a simplified geometric scheme for the DNA (Figure 7A), and on the measured mean spatial distances between the upstream end of the promoter and the downstream edge of the transcription bubble as well as between the upstream and downstream edges of the transcription bubble. Structural studies are consistent with promoter being bent during initial transcription (Cheetham and Steitz, 1999; Tang and Patel, 2006b; Turingan et al., 2007a). In this bent DNA, RDA1 is the distance between upstream and downstream edges of the transcription bubble, RDA2 is the distance between the downstream edge of the transcription bubble and the upstream end of the promoter (-22), and RDA3 is the distance between the upstream edge of the transcription bubble (-4) and the upstream end of the promoter (-22). FRET results show the RDA1 and RDA3 remain essentially constant during initial transcription, but RDA2 increases progressively with increasing RNA length. The increase in RDA2 can be explained by promoter rotation toward the downstream DNA, which also leads to an increase in the angle between RDA1 and RDA2. Using this method, we calculated that the step-wise hinging motion of the promoter relative to RDA1 (-4 and N+m) would result in a total rotation of 18 ± 4° during 4 to 7 nt synthesis (Figure 7B).
Figure 7. Degree of rotation of the promoter during initial transcription.

(A) A simplified geometry of the promoter DNA bound to T7 RNAP. RDA1 is the D-A distance from the upstream edge of the transcription bubble (−4NT) (red sphere) to the downstream edge of the bubble, 2-5 nt (N+m) (blue hexagon) beyond the active site (green), RDA2 is the D-A distance from the promoter end (−22) to the downstream edge of the bubble, and RDA3 is the D-A distance from the upstream end (−22) to −4. FRET studies indicated that RDA1 and RDA3 remain constant from IC4 to IC7, whereas RDA2 increases to R*DA2. In a given ICN complex, RDA1 and the angle, α, between RDA1 and RDA3 may vary as m varies, and the increase in RDA2 to R*DA2 can be explained by the rotation of the promoter around a hinge point at −4 toward the downstream DNA. Based on the experimental D-A distances, the maximal rotation of promoter is estimated to be 15-22° by 7 nt synthesis. (B) Proposed rotation of the promoter around the hinge at −4 (discontinuous arrow) and scrunching of the downstream DNA in the active site pocket (dotted circle) during synthesis of 3-4 to 7 nt RNA. Corresponding rotary movements of the N-terminal subdomains and the specificity loop (colored as in Fig.1A, in the discontinuous rectangle) against the C-terminal subdomains (gray) are illustrated by the semi-transparent model as the RNA is extended from 3 to 7 nt the promoter.
Discussion
Crystal structures of T7 RNAP in the IC state have indicated that T7 RNAP can synthesize a 3 nt RNA without major structural changes in the protein but with some DNA scrunching (Cheetham et al., 1999; Cheetham and Steitz, 1999; Jeruzalmi and Steitz, 1998). The crystal structure, however, indicated that synthesis beyond 3 nt by T7 RNAP would require conformational changes in DNA and/or RNAP. Major protein structural changes are expected during the transition from initiation to elongation based on studies of initiation and elongation complexes (Ma et al., 2002; Mukherjee et al., 2002; Tahirov et al., 2002; Yin and Steitz, 2002). However, due to lack of any structural information on intermediate ICN complexes of T7 RNAP making 4-7 nt RNA, it is not known whether any of these changes occur during transcription initiation. Three general models have been proposed to explain the growth of RNA:DNA hybrid from 4 to 7 bp during initial transcription: DNA scrunching model, RNAP translation model and RNAP rotation model. The multisubunit E. coli RNAP has been shown to undergo DNA scrunching during transcription initiation, as supported by single molecule nanomanipulation and FRET studies (Kapanidis et al., 2006; Revyakin et al., 2006), and a recent FRET study of T7 RNAP favored the translation model (Theis et al., 2004; Turingan et al., 2007b) over the 140° /220° rotation model.
We have used single molecule and ensemble FRET to investigate the sequence of conformational changes in DNA during transcription initiation and to distinguish between DNA scrunching, RNAP translation, and rotation models. ICN complexes making 4 to 7 nt maximum length RNA were generated by using promoters with predefined coding sequences and providing limiting NTPs or a mixture of NTPs and 3’-dNTP in the transcription reactions. Since RNAP recycling is the rate limiting step during abortive synthesis (Jia and Patel, 1997; McClure, 1980); it is expected that initiation complexes with full length RNA bound will accumulate as the major species under steady state reaction conditions (Figure S1). The single molecule FRET experiments indeed indicated the presence of a homogenous population of complexes making 4 to 7 nt RNA. The single population of transcriptional complexes at each of the walking positions had a FRET value distinct from the free DNA and representative of the final translocated state. By placing donor and acceptor dyes at strategic positions including positions close to the upstream and downstream edges of the transcriptional bubble, we were able to distinguish between the various models simply by comparing relative D-A distances in ICN complexes. The FRET or the relative D-A distances between the upstream and downstream edges of the transcription bubble in IC4 to IC7 remained essentially unchanged and supported the DNA scrunching model, but not the translation or the rotation model.
In addition to DNA scrunching, FRET studies also indicated moderate rotation or hinging movement of the promoter during the synthesis of 4 to 7 nt RNA (Figure 7B). Since the promoter region remains bound to the N-terminal subdomain throughout transcription initiation, the results imply that the N-terminal subdomain rotates during initial transcription. Thus, T7 RNAP employs both DNA scrunching and rotation motions to accommodate the growing RNA/DNA hybrid during transcription initiation. Further studies such as FRET between dyes in the C-terminal domain and the N-terminal subdomain will be required to obtain direct evidence for the rotation of the N-terminal subdomain. Based on the D-A distances from FRET studies, we estimate that the total rotational movement of the promoter around a hinge at −4 during 4 to 7 nt synthesis is 18 ± 4°. This amount of rotation is fairly small compared to the 140°/220° rotation of the N-terminal subdomain proposed from crystal structures (Tahirov et al., 2002). The 140° left-handed rotation was proposed from crystal structures of IC and EC (Tahirov et al., 2002; Yin and Steitz, 2002), and the 220° right-handed rotation was proposed from modeling of the IC and EC crystal structures (Theis et al., 2004). This “rotation” model postulated that the N-terminal subdomain movement would begin at synthesis of 4 nt RNA and full rotation would be completed when the RNA:DNA hybrid length reaches 8-9 bp (Tahirov et al., 2002). This is in contrast to the concerted model that postulated major conformational changes occur when T7 RNAP makes the transition from IC to EC; that is between 9-12 nt synthesis (Guo et al., 2005). Our studies indicate that the promoter undergoes moderate hinging motion during 4 to 7 nt synthesis that moves the promoter closer to the downstream end of the DNA and away from the active site (Figure 7B). The FRET studies, however, cannot determine whether this rotation is a right- or a left-handed one, and further studies will be required to establish the direction of rotation.
A recent study had investigated the mechanism of T7 RNAP transcription initiation using FRET and had favored the translation model over the rotation model (Turingan et al., 2007b). Their FRET study differs from ours in many ways. In Turingan et al., DNA scrunching or the possibility of moderate rotation was not considered, and experiments were designed mainly to distinguish between translation and 220° rotation during initiation. In that study, ensemble FRET efficiencies were measured after T7 RNAP was walked to a single position of +8. To distinguish between rotation and translation model, predicted distances were compared to mean D-A distances between donor fluorescein labeled at various positions downstream of +5 on the T strand and acceptor at −17 or −5 on the NT strand. While the −17NT data were unable to distinguish between the two models, the study by Turingan et al. relied essentially on the −5NT data to argue for the translation model. Here we have used a large number of strategically placed FRET probes on the DNA and walked T7 RNAP to various positions to distinguish between possible models. Our experimental design does not rely on comparing measured D-A distances to those predicted from modeled intermediate structures as did by Turingan et al., and therefore does not depend on the choice of parameters such as DNA twisting and shifting, and the configurational freedom of dyes that can easily affect modeled distances. Although the two studies reached different conclusions, the FRET data from both studies agree and indicate that a 220° rotation of the core subdomain/promoter cannot occur prior to 8nt RNA synthesis.
Conformational changes in T7 RNAP during transcription initiation are supported by studies of several mutants of the N-terminal core subdomain. For example, E148A mutant of T7 RNAP in the core subdomain makes 2-5 nt RNA normally, but is blocked at ~5 nt synthesis (He et al., 1997). Engineered disulfide crosslinking of the core subdomain to the C-terminal domain of T7 RNAP restrains core subdomain movement and results in the blockage of RNA synthesis at 5 to 6 nt (Ma et al., 2005). On the other hand, crosslinking between A94C in the AT-region recognition loop with the −17T position of the promoter does not halt initial transcription (Esposito and Martin, 2004), supporting simultaneous rotation of the promoter and T7 RNAP. Interestingly, a single mutation P266L in the hinge region of the core subdomain results in efficient synthesis during initial transcription with reduced production of abortive RNAs, which may be ascribed to increased flexibility of the core subdomain (Guillerez et al., 2005). These studies indicate that T7 RNAP conformational changes such as core subdomain rotation and N subdomain refolding events (Bandwar et al., 2007), although minor in magnitude compared to the those that occur during IC to EC transition, are required to make RNA products >4 nt RNAs.
In summary, DNA scrunching appears to be a conserved mechanism used by both single-subunit and multi-subunit RNAPs during transcription initiation. Our studies support a mechanism of combined scrunching and rotation in the single subunit T7 RNAP and indicate that these changes occur incrementally coupled to each nucleotide addition during transcription initiation. Thus, initial transcription must go through a series of conformational intermediates before the final transition is made to the elongation phase. These intermediates must contain incrementally scrunched DNA and twisted subdomains. As argued in studies of E. coli RNAP (Kapanidis et al., 2006; Revyakin et al., 2006), it is possible that these are high energy and unstable intermediates. These high energy intermediates can release the buildup stress by reversal of the conformational changes to recycle back to the relatively stable initial open complex. The tendency to reverse DNA scrunching and N-terminal subdomain rotation during initial transcription provides a reasonable mechanism for peeling off the short RNA resulting in abortive RNA synthesis during transcription initiation. The same mechanism that results in abortive products can explain also the transition from IC to EC. When the length of the RNA:DNA hybrid reaches > 7 bp, the higher base-pairing energy of the longer hybrid would make the hybrid more stable; hence, the stress from DNA scrunching and core subdomain rotation at this stage would result in the breaking of the promoter-RNAP interactions. The rotary motion of the N-terminal core subdomain provides an additional mechanism to strain the specificity loop contacts (Tahirov et al., 2002), which are broken before the upstream promoter contacts are broken (Bandwar et al., 2007; Place et al., 1999). Complete promoter release would be required before the core subdomain can complete the rest of the rotation to assume the position found in the EC (Guo et al., 2005; Tahirov et al., 2002; Yin and Steitz, 2002). Therefore, unlike the transition in multisubunit RNAPs that can involve release of one or more initiation factors (Borukhov and Nudler, 2003; Mooney et al., 2005), the transition in the single subunit T7 RNAP involves multiple conformational changes of the RNAP (Ma et al., 2002; Mukherjee et al., 2002; Tahirov et al., 2002; Yin and Steitz, 2002).
Materials and Methods
Enzyme and oligonucleotides
Untagged WT T7 RNAP was expressed and purified as published previously (Davanloo et al., 1984; Jia et al., 1996). Fluorescent dye labeling, purification, and characterization of T7 RNAP promoter fragments (sequences listed in Table S1) were done as before (Tang et al., 2005). Control experiments indicated that labeled DNA was functional in RNA synthesis (Figure S2).
Steady-state FRET measurements during initial transcription
Ensemble FRET measurements at 25 °C on a FluoroMax-2 spectrofluorometer and data analysis were done essentially the same way as before (Tang and Patel, 2006b). Mean D-A distances (Rda) was calculated using Equation 1 that relates the FRET efficiency,E, and the Förster radius (R0) of the dye pair.
| (1) |
R0 values for the TAMRA-Alexa 647, and Cy3-Cy5 dye pairs (Figure S3) were determined according to walking positions of T7 RNAP in transcription.
Single molecule FRET measurements
Biotinylated DNA duplexes specifically bound to a PEG and ~2% biotinylated PEG coated surface with NeutrAvidin (Pierce, IL) treatment were imaged with 30 ms time resolution using an electron multiplying charge coupled device (CCD) camera (iXon DV 887-BI, Andor Technology, CT) and custom C++ (Myong et al., 2005) on a wide-field Total-Internal-Reflection (TIR) Microscopy with a 532nm diode laser (CrystaLaser, NV) for Cy3 excitation (Rasnik et al., 2004). The FRET efficiency E, was calculated using the Equation 2 from apparent donor, ID and acceptor, IA signals after appropriate removal of donor and acceptor leakage and the background.
| (2) |
where the most probable value of γ, the ratio of change in average acceptor intensity (ΔIA) to change in average donor intensity (ΔID) before and after acceptor photobleaching (Ha et al., 1999), was calculated from 25 molecules after their acceptor undergoes photobleaching for each walking position of the T7 RNAP-DNA complex. Data with error bars (standard deviation) were averaged from multiple independent measurements.
Supplementary Material
Footnotes
This work was supported by NIH grants to SSP (GM51966) and to TH (GM065367).
Publisher's Disclaimer: This is a PDF file of an unedited manuscript that has been accepted for publication. As a service to our customers we are providing this early version of the manuscript. The manuscript will undergo copyediting, typesetting, and review of the resulting proof before it is published in its final citable form. Please note that during the production process errors may be discovered which could affect the content, and all legal disclaimers that apply to the journal pertain.
References
- Bandwar RP, Ma N, Emanuel SA, Anikin M, Vassylyev DG, Patel SS, McAllister WT. The transition to an elongation complex by T7 RNA polymerase is a multistep process. J Biol Chem. 2007 doi: 10.1074/jbc.M702589200. [DOI] [PMC free article] [PubMed] [Google Scholar]
- Bandwar RP, Tang GQ, Patel SS. Sequential release of promoter contacts during transcription initiation to elongation transition. J Mol Biol. 2006;360:466–483. doi: 10.1016/j.jmb.2006.05.029. [DOI] [PubMed] [Google Scholar]
- Borukhov S, Nudler E. RNA polymerase holoenzyme: structure, function and biological implications. Curr Opin Microbiol. 2003;6:93–100. doi: 10.1016/s1369-5274(03)00036-5. [DOI] [PubMed] [Google Scholar]
- Brieba LG, Sousa R. T7 promoter release mediated by DNA scrunching. Embo J. 2001;20:6826–6835. doi: 10.1093/emboj/20.23.6826. [DOI] [PMC free article] [PubMed] [Google Scholar]
- Carpousis AJ, Gralla JD. Interaction of RNA polymerase with lacUV5 promoter DNA during mRNA initiation and elongation. Footprinting, methylation, and rifampicin-sensitivity changes accompanying transcription initiation. J Mol Biol. 1985;183:165–177. doi: 10.1016/0022-2836(85)90210-4. [DOI] [PubMed] [Google Scholar]
- Cheetham GM, Jeruzalmi D, Steitz TA. Transcription regulation, initiation, and “DNA scrunching” by T7 RNA polymerase. Cold Spring Harb Symp Quant Biol. 1998;63:263–267. doi: 10.1101/sqb.1998.63.263. [DOI] [PubMed] [Google Scholar]
- Cheetham GM, Jeruzalmi D, Steitz TA. Structural basis for initiation of transcription from an RNA polymerase-promoter complex. Nature. 1999;399:80–83. doi: 10.1038/19999. [DOI] [PubMed] [Google Scholar]
- Cheetham GM, Steitz TA. Structure of a transcribing T7 RNA polymerase initiation complex. Science. 1999;286:2305–2309. doi: 10.1126/science.286.5448.2305. [DOI] [PubMed] [Google Scholar]
- Clegg RM. Fluorescence resonance energy transfer and nucleic acids. Methods Enzymol. 1992;211:353–388. doi: 10.1016/0076-6879(92)11020-j. [DOI] [PubMed] [Google Scholar]
- Davanloo P, Rosenberg AH, Dunn JJ, Studier FW. Cloning and expression of the gene for bacteriophage T7 RNA polymerase. Proc Natl Acad Sci U S A. 1984;81:2035–2039. doi: 10.1073/pnas.81.7.2035. [DOI] [PMC free article] [PubMed] [Google Scholar]
- Deniz AA, Dahan M, Grunwell JR, Ha T, Faulhaber AE, Chemla DS, Weiss S, Schultz PG. Single-pair fluorescence resonance energy transfer on freely diffusing molecules: observation of Forster distance dependence and subpopulations. Proc Natl Acad Sci U S A. 1999;96:3670–3675. doi: 10.1073/pnas.96.7.3670. [DOI] [PMC free article] [PubMed] [Google Scholar]
- Esposito EA, Martin CT. Cross-linking of promoter DNA to T7 RNA polymerase does not prevent formation of a stable elongation complex. J Biol Chem. 2004;279:44270–44276. doi: 10.1074/jbc.M407688200. [DOI] [PubMed] [Google Scholar]
- Gong P, Esposito EA, Martin CT. Initial bubble collapse plays a key role in the transition to elongation in T7 RNA polymerase. J Biol Chem. 2004;279:44277–44285. doi: 10.1074/jbc.M409118200. [DOI] [PubMed] [Google Scholar]
- Guillerez J, Lopez PJ, Proux F, Launay H, Dreyfus M. A mutation in T7 RNA polymerase that facilitates promoter clearance. Proc Natl Acad Sci U S A. 2005;102:5958–5963. doi: 10.1073/pnas.0407141102. [DOI] [PMC free article] [PubMed] [Google Scholar]
- Guo Q, Nayak D, Brieba LG, Sousa R. Major conformational changes during T7RNAP transcription initiation coincide with, and are required for, promoter release. J Mol Biol. 2005;353:256–270. doi: 10.1016/j.jmb.2005.08.016. [DOI] [PubMed] [Google Scholar]
- Guo Q, Sousa R. Multiple roles for the T7 promoter nontemplate strand during transcription initiation and polymerase release. J Biol Chem. 2005;280:3474–3482. doi: 10.1074/jbc.M412287200. [DOI] [PubMed] [Google Scholar]
- Ha T, Enderle T, Ogletree DF, Chemla DS, Selvin PR, Weiss S. Probing the interaction between two single molecules: fluorescence resonance energy transfer between a single donor and a single acceptor. Proc Natl Acad Sci U S A. 1996;93:6264–6268. doi: 10.1073/pnas.93.13.6264. [DOI] [PMC free article] [PubMed] [Google Scholar]
- Ha T, Ting AY, Liang J, Caldwell WB, Deniz AA, Chemla DS, Schultz PG, Weiss S. Single-molecule fluorescence spectroscopy of enzyme conformational dynamics and cleavage mechanism. Proc Natl Acad Sci U S A. 1999;96:893–898. doi: 10.1073/pnas.96.3.893. [DOI] [PMC free article] [PubMed] [Google Scholar]
- He B, Rong M, Durbin RK, McAllister WT. A mutant T7 RNA polymerase that is defective in RNA binding and blocked in the early stages of transcription. J Mol Biol. 1997;265:275–288. doi: 10.1006/jmbi.1996.0741. [DOI] [PubMed] [Google Scholar]
- Hieb AR, Baran S, Goodrich JA, Kugel JF. An 8 nt RNA triggers a rate-limiting shift of RNA polymerase II complexes into elongation. Embo J. 2006;25:3100–3109. doi: 10.1038/sj.emboj.7601197. [DOI] [PMC free article] [PubMed] [Google Scholar]
- Hsu LM. Promoter clearance and escape in prokaryotes. Biochim Biophys Acta. 2002;1577:191–207. doi: 10.1016/s0167-4781(02)00452-9. [DOI] [PubMed] [Google Scholar]
- Ikeda RA, Richardson CC. Interactions of the RNA polymerase of bacteriophage T7 with its promoter during binding and initiation of transcription. Proc Natl Acad Sci U S A. 1986;83:3614–3618. doi: 10.1073/pnas.83.11.3614. [DOI] [PMC free article] [PubMed] [Google Scholar]
- Ikeda RA, Richardson CC. Interactions of a proteolytically nicked RNA polymerase of bacteriophage T7 with its promoter. J Biol Chem. 1987;262:3800–3808. [PubMed] [Google Scholar]
- Jeruzalmi D, Steitz TA. Structure of T7 RNA polymerase complexed to the transcriptional inhibitor T7 lysozyme. Embo J. 1998;17:4101–4113. doi: 10.1093/emboj/17.14.4101. [DOI] [PMC free article] [PubMed] [Google Scholar]
- Jia Y, Kumar A, Patel SS. Equilibrium and stopped-flow kinetic studies of interaction between T7 RNA polymerase and its promoters measured by protein and 2-aminopurine fluorescence changes. J Biol Chem. 1996;271:30451–30458. doi: 10.1074/jbc.271.48.30451. [DOI] [PubMed] [Google Scholar]
- Jia Y, Patel SS. Kinetic mechanism of transcription initiation by bacteriophage T7 RNA polymerase. Biochemistry. 1997;36:4223–4232. doi: 10.1021/bi9630467. [DOI] [PubMed] [Google Scholar]
- Kapanidis AN, Margeat E, Ho SO, Kortkhonjia E, Weiss S, Ebright RH. Initial transcription by RNA polymerase proceeds through a DNA-scrunching mechanism. Science. 2006;314:1144–1147. doi: 10.1126/science.1131399. [DOI] [PMC free article] [PubMed] [Google Scholar]
- Kinsella L, Hsu CY, Schulz W, Dennis D. RNA polymerase: correlation between transcript length, abortive product synthesis, and formation of a stable ternary complex. Biochemistry. 1982;21:2719–2723. doi: 10.1021/bi00540a022. [DOI] [PubMed] [Google Scholar]
- Krummel B, Chamberlin MJ. RNA chain initiation by Escherichia coli RNA polymerase. Structural transitions of the enzyme in early ternary complexes. Biochemistry. 1989;28:7829–7842. doi: 10.1021/bi00445a045. [DOI] [PubMed] [Google Scholar]
- Lee NK, Kapanidis AN, Wang Y, Michalet X, Mukhopadhyay J, Ebright RH, Weiss S. Accurate FRET measurements within single diffusing biomolecules using alternating-laser excitation. Biophys J. 2005;88:2939–2953. doi: 10.1529/biophysj.104.054114. [DOI] [PMC free article] [PubMed] [Google Scholar]
- Liu C, Martin CT. Promoter clearance by T7 RNA polymerase. Initial bubble collapse and transcript dissociation monitored by base analog fluorescence. J Biol Chem. 2002;277:2725–2731. doi: 10.1074/jbc.M108856200. [DOI] [PubMed] [Google Scholar]
- Ma K, Temiakov D, Anikin M, McAllister WT. Probing conformational changes in T7 RNA polymerase during initiation and termination by using engineered disulfide linkages. Proc Natl Acad Sci U S A. 2005;102:17612–17617. doi: 10.1073/pnas.0508865102. [DOI] [PMC free article] [PubMed] [Google Scholar]
- Ma K, Temiakov D, Jiang M, Anikin M, McAllister WT. Major conformational changes occur during the transition from an initiation complex to an elongation complex by T7 RNA polymerase. J Biol Chem. 2002;277:43206–43215. doi: 10.1074/jbc.M206658200. [DOI] [PubMed] [Google Scholar]
- McClure WR. Rate-limiting steps in RNA chain initiation. Proc Natl Acad Sci U S A. 1980;77:5634–5638. doi: 10.1073/pnas.77.10.5634. [DOI] [PMC free article] [PubMed] [Google Scholar]
- Mooney RA, Darst SA, Landick R. Sigma and RNA polymerase: an on-again, off-again relationship? Mol Cell. 2005;20:335–345. doi: 10.1016/j.molcel.2005.10.015. [DOI] [PubMed] [Google Scholar]
- Mukherjee S, Brieba LG, Sousa R. Structural transitions mediating transcription initiation by T7 RNA polymerase. Cell. 2002;110:81–91. doi: 10.1016/s0092-8674(02)00815-2. [DOI] [PubMed] [Google Scholar]
- Munteanu MG, Vlahovicek K, Parthasarathy S, Simon I, Pongor S. Rod models of DNA: sequence-dependent anisotropic elastic modelling of local bending phenomena. Trends Biochem Sci. 1998;23:341–347. doi: 10.1016/s0968-0004(98)01265-1. [DOI] [PubMed] [Google Scholar]
- Myong S, Rasnik I, Joo C, Lohman TM, Ha T. Repetitive shuttling of a motor protein on DNA. Nature. 2005;437:1321–1325. doi: 10.1038/nature04049. [DOI] [PubMed] [Google Scholar]
- Place C, Oddos J, Buc H, McAllister WT, Buckle M. Studies of contacts between T7 RNA polymerase and its promoter reveal features in common with multisubunit RNA polymerases. Biochemistry. 1999;38:4948–4957. doi: 10.1021/bi982689e. [DOI] [PubMed] [Google Scholar]
- Rasnik I, Myong S, Cheng W, Lohman TM, Ha T. DNA-binding orientation and domain conformation of the E. coli rep helicase monomer bound to a partial duplex junction: single-molecule studies of fluorescently labeled enzymes. J Mol Biol. 2004;336:395–408. doi: 10.1016/j.jmb.2003.12.031. [DOI] [PubMed] [Google Scholar]
- Revyakin A, Liu C, Ebright RH, Strick TR. Abortive initiation and productive initiation by RNA polymerase involve DNA scrunching. Science. 2006;314:1139–1143. doi: 10.1126/science.1131398. [DOI] [PMC free article] [PubMed] [Google Scholar]
- Roy R, Kozlov AG, Lohman TM, Ha T. Dynamic structural rearrangements between DNA binding modes of E. coli SSB protein. J Mol Biol. 2007;369:1244–1257. doi: 10.1016/j.jmb.2007.03.079. [DOI] [PMC free article] [PubMed] [Google Scholar]
- Steitz TA. Visualizing polynucleotide polymerase machines at work. Embo J. 2006;25:3458–3468. doi: 10.1038/sj.emboj.7601211. [DOI] [PMC free article] [PubMed] [Google Scholar]
- Straney DC, Crothers DM. A stressed intermediate in the formation of stably initiated RNA chains at the Escherichia coli lac UV5 promoter. J Mol Biol. 1987;193:267–278. doi: 10.1016/0022-2836(87)90218-x. [DOI] [PubMed] [Google Scholar]
- Tahirov TH, Temiakov D, Anikin M, Patlan V, McAllister WT, Vassylyev DG, Yokoyama S. Structure of a T7 RNA polymerase elongation complex at 2.9 A resolution. Nature. 2002;420:43–50. doi: 10.1038/nature01129. [DOI] [PubMed] [Google Scholar]
- Tang GQ, Bandwar RP, Patel SS. Extended upstream A-T sequence increases T7 promoter strength. J Biol Chem. 2005;280:40707–40713. doi: 10.1074/jbc.M508013200. [DOI] [PubMed] [Google Scholar]
- Tang GQ, Patel SS. Rapid binding of T7 RNA polymerase is followed by simultaneous bending and opening of the promoter DNA. Biochemistry. 2006a;45:4947–4956. doi: 10.1021/bi052292s. [DOI] [PubMed] [Google Scholar]
- Tang GQ, Patel SS. T7 RNA polymerase-induced bending of promoter DNA is coupled to DNA opening. Biochemistry. 2006b;45:4936–4946. doi: 10.1021/bi0522910. [DOI] [PubMed] [Google Scholar]
- Temiakov D, Mentesana PE, Ma K, Mustaev A, Borukhov S, McAllister WT. The specificity loop of T7 RNA polymerase interacts first with the promoter and then with the elongating transcript, suggesting a mechanism for promoter clearance. Proc Natl Acad Sci U S A. 2000;97:14109–14114. doi: 10.1073/pnas.250473197. [DOI] [PMC free article] [PubMed] [Google Scholar]
- Theis K, Gong P, Martin CT. Topological and conformational analysis of the initiation and elongation complex of t7 RNA polymerase suggests a new twist. Biochemistry. 2004;43:12709–12715. doi: 10.1021/bi0486987. [DOI] [PubMed] [Google Scholar]
- Turingan RS, Liu C, Hawkins ME, Martin CT. Structural confirmation of a bent and open model for the initiation complex of T7 RNA polymerase. Biochemistry. 2007a;46:1714–1723. doi: 10.1021/bi061905d. [DOI] [PMC free article] [PubMed] [Google Scholar]
- Turingan RS, Theis K, Martin CT. Twisted or shifted? Fluorescence measurements of late intermediates in transcription initiation by t7 RNA polymerase. Biochemistry. 2007b;46:6165–6168. doi: 10.1021/bi700058b. [DOI] [PMC free article] [PubMed] [Google Scholar]
- Ujvari A, Martin CT. Evidence for DNA bending at the T7 RNA polymerase promoter. J Mol Biol. 2000;295:1173–1184. doi: 10.1006/jmbi.1999.3418. [DOI] [PubMed] [Google Scholar]
- Yin YW, Steitz TA. Structural basis for the transition from initiation to elongation transcription in T7 RNA polymerase. Science. 2002;298:1387–1395. doi: 10.1126/science.1077464. [DOI] [PubMed] [Google Scholar]
- Young BA, Gruber TM, Gross CA. Views of transcription initiation. Cell. 2002;109:417–420. doi: 10.1016/s0092-8674(02)00752-3. [DOI] [PubMed] [Google Scholar]
Associated Data
This section collects any data citations, data availability statements, or supplementary materials included in this article.