

Abstract
Escherichia coli DNA adenine methyltransferase (EcoDam) methylates the N-6 position of the adenine in the sequence 5′-GATC-3′ and plays vital roles in gene regulation, mismatch repair, and DNA replication. It remains unclear how the small number of critical GATC sites involved in the regulation of replication and gene expression are differentially methylated, whereas the ∼20,000 GATCs important for mismatch repair and dispersed throughout the genome are extensively methylated. Our prior work, limited to the pap regulon, showed that methylation efficiency is controlled by sequences immediately flanking the GATC sites. We extend these studies to include GATC sites involved in diverse gene regulatory and DNA replication pathways as well as sites previously shown to undergo differential in vivo methylation but whose function remains to be assigned. EcoDam shows no change in affinity with variations in flanking sequences derived from these sources, but methylation kinetics varied 12-fold. A-tracts immediately adjacent to the GATC site contribute significantly to these differences in methylation kinetics. Interestingly, only when the poly(A) is located 5′ of the GATC are the changes in methylation kinetics revealed. Preferential methylation is obscured when two GATC sites are positioned on the same DNA molecule, unless both sites are surrounded by large amounts of nonspecific DNA. Thus, facilitated diffusion and sequences immediately flanking target sites contribute to higher order specificity for EcoDam; we suggest that the diverse biological roles of the enzyme are in part regulated by these two factors, which may be important for other enzymes that sequence-specifically modify DNA.
Bacterial DNA methyltransferases catalyze the transfer of a methyl group from the cofactor S-adenosylmethionine (AdoMet)2 to cytosines at the C-5 position or adenines at the N-4 or N-6 position (1–3). Most bacterial methyltransferases are involved in restriction modification systems that serve to protect the cell from invading DNA (4); others, like the orphan methyltransferase Escherichia coli DNA adenine methyltransferase (EcoDam), do not participate in such a system. EcoDam plays critical roles in many bacterial pathways, including gene regulation, mismatch repair, DNA replication, and nucleoid structure determination (5, 6). EcoDam homologues are found in many γ-proteobacteria, such as Salmonella typhimurium (7), Yersinia pseudotuberculosis (8), Vibrio cholerae (8), Actinobacillus actinomycetemcomitans (9) and Hemophilus influenzae (10). Further, a growing number of bacterial pathogens have been found to require methylation for virulence (11). The lack of adenine methylation in higher eukaryotes has sparked interest in targeting EcoDam for the development of new antibiotics (12), thus making a thorough understanding of both the structure and mechanism of this enzyme critical.
Monomeric EcoDam binds and methylates the N-6 position of the adenine in the DNA sequence 5′-GATC-3′ (13). Gene expression and proteomic studies of bacteria in which the EcoDam gene has been deleted show extreme and widespread changes in RNA and protein levels, in many cases involving well characterized virulence factors (14–17). Within the E. coli genome, ∼0.1–0.2% of the ∼20,000 GATC sites are undermethylated in vivo (18, 19). Most of these GATC sites are found in the 5′-noncoding region of various genes, indicating that they could be involved in gene regulation. Additionally, chromosome replication is regulated in part by the methylation state of the GATC sites within the origin (20, 21). The GATC sites located within the origin of replication and those differentially methylated in the E. coli genome are thought to be protected from methylation by the presence of a competing protein. For example, SeqA preferentially binds at least two hemimethylated GATC sites in the origin of replication, thereby contributing to the lag in methylation of these sites relative to those within the genome (22–24). Although other factors are thought to contribute to the slow remethylation of the origin (25–27), this sequestration of GATC sites is required for proper timing of chromosome replication. Characterized systems such as the bacterial origin of replication aid in the explanation of the lack of methylation at some genomic GATCs; however, the factors contributing to the lack of methylation at others are poorly understood.
EcoDam shows a dramatic preference for the in vitro methylation of certain GATC sequences in plasmids and PCR-derived DNA fragments. For example, Guschlbauer and co-workers detected no methylation of some GATC sites on pBR322, whereas other sites are nearly completely methylated (28). The linear or supercoiled nature of the plasmid had no affect on which GATC sites were preferentially methylated. Pili expression in E. coli is dependent upon the methylation state of two GATC sites located proximal (GATCprox) and distal (GATCdist) to the papAB gene within the pap promoter (29, 30). Our previous work on these regulatory GATCs within the pap operon showed a 23-fold decrease in methylation kinetics when compared with a site known to undergo rapid methylation (31). This preference is enhanced when poorly and rapidly methylated sites are positioned on the same DNA molecule. More recently, Zonoviev et al. (32) demonstrated that the EcoDam ortholog T4Dam also differentially methylates two GATC sites that are both located on a 40-base pair DNA molecule.
Here we extend our original investigation of the modulation of EcoDam methylation kinetics by flanking sequences (31) to include GATC sites involved in other pathways. Our results show that the flanking sequences immediately adjacent to the GATC are important for determining the efficiency of methylation for many of these GATC sites. This effect is further dependent on the surrounding nonspecific DNA involving hundreds of flanking base pairs. The higher order specificity observed may contribute to the multiple levels of regulation controlling the various biological pathways in which EcoDam participates.
EXPERIMENTAL PROCEDURES
Enzyme Expression and Purification—EcoDam was expressed and purified as previously described (33). In brief, EcoDam was overexpressed in XL2-Blue (Stratagene) E. coli cells grown at 37 °C in LB medium supplemented with 25 μg/ml kanamycin and 12.5 μg/ml tetracycline. Once an A600 of 0.4–0.6 was reached, cells were induced with 1 mm isopropyl 1-thio-β-d-galactopyranoside and 0.05% l-arabinose and grown for 2 h at 37 °C. Pelleted cells were resuspended in 40–60 ml of P-11 buffer (50 mm potassium phosphate buffer, pH 7.4, 10 mm β-mercaptoethanol, 1 mm EDTA, 1 mm phenylmethylsulfonyl fluoride, 0.2 m NaCl, 10% glycerol) and lysed by a French press. The lysate was centrifuged at 15,000 rpm for 60 min at 4 °C, and the supernatant was loaded onto a 60-ml phosphocellulose (Whatman) column. The protein was eluted with a salt gradient between 0.2 and 0.8 M NaCl, and those fractions containing EcoDam were pooled and dialyzed in BS buffer (20 mm potassium phosphate buffer, pH 7.0, 10 mm β-mercaptoethanol, 1 mm EDTA, 1 mm phenylmethylsulfonyl fluoride, 10% glycerol). The dialyzed protein was loaded onto a 20-ml Blue Sepharose 6 Fast Flow (GE Healthcare) column preequilibrated in BS buffer, and protein was eluted with a salt gradient between 0 and 1.5 m NaCl. Fractions containing EcoDam were flash-frozen and stored at –80 °C. Concentrations were determined using the extinction coefficient 1.16 ml mg–1 cm–1 at 280 nm.
DNA Substrates—All DNA oligonucleotides (Table 1 and Fig. 5) and their reverse complements were ordered from Operon or Midland and resuspended in TE (10 mm Tris, pH 7.5, 1 mm EDTA). The sequences corresponding to the GATC sites found in the pap operon (WTpapdist and WTpapprox; Table 1) were designed based on the native sequences found in the E. coli genome, including the 8–9 base pairs flanking the 5′- and 3′-end of the GATC (Table 1). The sequence for the mutated papdist oligonucleotide (MTpapdist; Table 1) was designed based on our previous work showing an increase in methylation efficiency when the WTpapdist flanks are changed to MTpapdist flanks (31). In vitro differentially methylated GATC sites on pBR322 were identified in previous work (28). Oligonucleotides were designed based on those GATC sites and the native flanking DNA (8–9 bp from either end) found in pBR322 (A–I; Table 1). The eight phylogenetically conserved GATC sites located in the bacterial origin of replication were previously identified (21). DNA oligonucleotides were designed based on these GATC sites and the actual flanking DNA found in the E. coli genome (Table 1; 1–8). GATC sites previously identified as undermethylated in vivo and located in the 5′-noncoding region of various genes within the E. coli genome were also used as templates for oligonucleotide design (18, 19). These substrates were designed based on the actual GATC and flanking DNA sequences found in the E. coli genome and named according to the gene identified to be possibly impacted by the methylation state of that GATC (Table 1, mtl-yihU/V). Oligonucleotides used for systematic testing of flanking DNA sequences were based on the WTpapdist substrate and varied in both the rigidity of base pairs close to the GATC (Fig. 5A, R1–R4) and the distance of an A-tract to the GATC (Fig. 5A, D1–D3). Additionally, the mirror image of WTpapdist (R-WT-papdist; Fig. 5A) was designed and tested. All oligonucleotides mentioned above were annealed to their reverse complement by heating the 1:1 molar mixture for 10 min at 95 °C, followed by slow cooling (∼5 h) to room temperature. Duplex formation was verified by PAGE.
TABLE 1.
Biologically derived DNA sequences used in this study
Oligonucleotides and their corresponding reverse complement were annealed and tested for methylation efficiency: GATC involved in gene regulation (WTpapdist, WTpapprox), highly conserved in the origin of replication (1–8), undermethylated in vivo (mtl-yihU/V), and differentially methylated in vitro (A–I).

FIGURE 5.

EcoDam is responsive to a directional A-tract flanking the target GATC site. A, sequence analysis of biologically derived GATC sites with a 7-fold or higher reduction in methyltransfer when compared with site H (WTpapdist, WTpapprox, car, and E). A-tracts directly adjacent to GATC site are highlighted in red. B, substrates were analyzed for methylation kinetics using the systematic movement of the A-tract away from the target GATC (D1, D2, and D3) and increasing amounts of rigidity close to the GATC (R1, R2, R3, and R4). The mirror image of WTpapdist (R-WTpapdist) was also tested. C, single-turnover analysis of control oligonucleotides seen in chart A reveal that an A-tract must be directly adjacent to the GATC site. Further, movement of the poly(A) portion of the A-tract to the 3′-end of the GATC showed a recovered rate of chemistry, indicating that the A-tract is directional.
KDDNA Determination—Anisotropy experiments were performed on a Fluoromax-2 fluorimeter (ISA SPEX) equipped with an L-format autopolarizer at 22 °C. The change in anisotropy of 20 nm singly labeled (fluorescein) duplex DNA in MRB (100 mm Tris, pH 8.0, 1 mm EDTA, 1 mm DTT, 0.2 mg/ml BSA) supplemented with 50 μm sinefungin was monitored as increasing enzyme was added. Data for each addition of enzyme were collected by monitoring the excitation at 494 nm and emission at 518 nm. Slit widths of 8 nm were used for all experiments. The resultant changes in anisotropy were plotted against enzyme concentration, and the dissociation constant was derived by fitting the data to the modified quadratic equation,
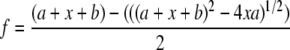 |
(Eq. 1) |
where b = KDDNA, x = [enzyme] × [DNA], and a = [enzyme-DNA]. All graphical analysis was done with Sigma Plot 6.1 (SSPS, Inc.).
KMDNA and kcat Determination—Incorporation of tritiated methyl groups onto DNA was monitored by a filter binding assay, as previously described (33). EcoDam was diluted in protein dilution buffer (20 mm potassium phosphate, pH 7.5, 200 mm NaCl, 0.2 mm EDTA, 0.2 mg/ml BSA, 2 mm DTT, 10% glycerol). Reactions were carried out at 22 °C and contained 2 nm EcoDam in MRB, 0.2 mg/ml BSA, 25 μm AdoMet, and DNA (0–500 nm) in a final volume of 20 μl. Mixtures were allowed to equilibrate at 22 °C prior to initiation with DNA. Reactions were quenched with 10 μl of 1% SDS at a single time point (30 min), and 25 μl was spotted onto 2.5-cm Whatman DE81 circular filter papers. Filter papers were washed three times in 50 mm KH2PO4, once in 80% ethanol, once in 100% ethanol, and once in diethyl ether for 5 min each. Papers were dried and submerged in BioSafeII scintillation fluid. Tritium levels were quantitated in a Beckman-Coulter LS6500 scintillation counter. Counts were converted to methylated product per unit time and plotted against the DNA concentration. Values for KMDNA and kcat were found by fitting the data to a rectangular hyperbola in Sigma Plot 6.1 (SSPS).
kchem Determination—Single-turnover assays were done at 4 °C with limiting DNA. Reactions were carried out in MRB with 0.2 mg/ml BSA, 288 nm DNA, 420 nm EcoDam, and 30 μm AdoMet in a total volume of 100 μl. All reactions were initiated with the addition of DNA. At 0, 15, 30, 60, 90, 120, 180, 300, and 600 s, 10-μl aliquots of the reaction were removed and quenched in 10 μl of 1% SDS. 15 μl of the resulting mixture was spotted on DE81 filter papers. Samples were washed, dried, and counted as described above. Counts were converted to nm methylated product and plotted against time. The kchem for each substrate was found by fitting the data to a single exponential in Sigma Plot 6.1.
Competition Assay—Two substrates were designed and used for the competition assay. Both constructs contain the E and H GATC sites and their native flanking DNA described above on the same DNA substrate. The first construct with the sequence 5′-TAGCTCTTGATCCGGCAAACAGCTGTTCGCATCCTTTGATCTTTTCTACGCCTATGCC-3′ and its reverse complement was ordered and annealed as described above. The second construct consisted of the sequences 5′-AATTCTAGCTCTTGATCCGGCAAACACGAGGTCTCGAGCATCCTTTGATCTTTTCTACGA-3′ and 5′-AGCTTCGTAGAAAAGATCAAAGGATGCTCGAGACCTCGTGTTTGCCGGATCAAGAGCTAG-3′. When annealed, this duplex has overhangs complementary to the EcoRI and HindIII restriction endonuclease sites. 5′-Phosphates were added to the duplex by incubating T4 polynucleotide kinase (New England Biolabs) and ATP with the duplex at 37 °C for 2 h. T4 kinase was inactivated by heating the mixture to 65 °C for 20 min. The resulting duplex was cloned into pBR322 that had been linearized by EcoRI and HindIII. The resulting construct (pBREH) was analyzed by both restriction analysis and sequencing. A 270-bp construct was generated by PCR of pBREH containing the competition insert using the primers 5′-GGTTCCGCGCACATTTCCCCG-3′ and 5′-GGTGACGGTGCCGAGGATGACG-3′, respectively. PCR amplicons were purified using the QIAquick PCR clean-up kit (Qiagen) followed by phenol/chloroform extraction and ethanol precipitation. Concentrations of all DNA constructs were determined by measuring the A260.
All competition assays were carried out at 22 °C with limiting enzyme. Methylation reactions were carried out in MRB supplemented with 0.2 mg/ml BSA and contained 10 nm EcoDam diluted into protein dilution buffer, 600 nm DNA, and 30 μm AdoMet. The reactions were quenched by removing aliquots from the reaction mixture into preheated TE at 75 °C and incubated for at least 15 min to ensure heat inactivation of EcoDam. After cooling to room temperature, samples were digested with DpnII for at least 12 h at 37 °C. A 10-bp ladder (Invitrogen), an uncut control, and the digested samples were run on a 12% (58-bp substrate) or 8% (270-bp substrate) native polyacrylamide gel for 4 h at 250 V. Gels were stained with Sybr Au (Invitrogen) and scanned on a Storm 840 PhosphorImager (Amersham Biosciences). Band density was determined using ImageQuant version 1.2 (Molecular Dynamics Inc.) and further analyzed in Microsoft Excel. Density changes with time were finally plotted in Sigma Plot 6.1. The slopes of the linear fit to the formation of products that were methylated at both positions (νABC), methylated at only the preferred site (νAB), and methylated at only the nonpreferred site (νBC) were compared as previously described (34, 35). The site preference for the preferred site (EP) over the nonpreferred site (EN-P) is described as follows.
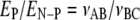 |
(Eq. 2) |
These rates (νABC and νAB) are the only indication of the DNA being methylated at an individual site.
Sequence Analysis—Multiple sequence alignment of substrates found to be preferentially methylated in single-turnover analyses (MTpapdist, A, B, C, D, G, H, I, 3, 4, 5, 6, 7, 8, mtl, cdd, flh, gut, yjdG, yidX, and yihU/V) was completed using ClustalX version 2.0 and the default parameters (36). Semipreferred sites (F, 1, 2, fep, psp, and rsp) methylated 3–5-fold more slowly than preferred sites and nonpreferred sites showing an 8-fold or greater decrease in methylation kinetics (WTpapdist, WTpapprox, E, and car) were also aligned using the same method. Results were visualized using WebLogo version 2.8.2 (37, 38), where the height of each base within a stack is proportional to its frequency at that position. The sequence conservation is measured in bits; one bit measures the choice between equally likely possibilities (39). The most frequent base at each position is located on the top of the stack.
Structural Analysis—Protein Data Bank file 2G1P containing the EcoDam/DNA co-crystal structure was downloaded from the RCSB data base and analyzed in PyMOL version 0.98 (DeLano Scientific). Residues within hydrogen bonding distance (≤3.0 Å) of the phosphate groups flanking the target GATC were displayed, and direct hydrogen bonds made from a side chain to the phosphate backbone were found by measuring the distances between atoms. Images were rendered and saved as .png files for use in Fig. 8.
FIGURE 8.

Conserved residues directly contact the DNA phosphate backbone of the flanking DNA. The crystal structure of EcoDam (center, light gray) bound to its cognate GATC site (light cyan) and interactions with the flanking DNA (red) are shown. Five direct hydrogen bonds are made to the DNA phosphate backbone from five conserved residues among EcoDam orthologs. EcoDam contacts five consecutive phosphates 5′ to the target adenine and four phosphates 3′ to the target adenine either by water-mediated or direct interactions. All direct interactions are made by residues that are conserved among EcoDam orthologs. A closer look at the 5′ direct contacts made by Lys139 and Arg116 is shown (left), and the 3′ direct interactions made by Arg95, Asn132, and Asn126 are shown (right). These contacts may contribute to the enzyme's processivity, orientation in relation to the target GATC, and site preference.
RESULTS
The pap System—Our original work on the importance of sequences flanking GATC sites was limited to the two poorly and nonprocessively methylated sites within the pap operon that control phase variation of pili expression in E. coli (31). Our interest was to extend these initial studies to include GATC sites implicated in other important biological pathways. We first extended our original studies of the pap-related GATC sites to include the steady-state efficiency constant (kcat/KmDNA) (Fig. 1A). Observation of steady-state kinetic constants with low enzyme/substrate ratios more accurately represents the relatively few EcoDam molecules per GATC site within the cell (≤100) (40).
FIGURE 1.

Steady-state and single-turnover kinetics on pap-derived GATC substrates. A, Michaelis-Menten plot of velocity (nm/min) versus DNA concentration (nm) on the WTpapdist substrate (▾) and MTpapdist substrate (▪). Reactions were carried out at 22 °C with limiting enzyme, varying DNA concentrations, and saturating AdoMet. B, single-turnover kinetics with limiting DNA, excess enzyme, and saturating AdoMet at 4 °C on the WTpapdist (▾) and MTpapdist (▪) substrates. C, table of rate constants from the steady-state (A) and single-turnover (B) assays. K DNAD for each substrate was determined by equilibrium anisotropy. EcoDam is equally efficient on each GATC site under steady-state conditions (WTpapdist kcat/Km(DNA)/MTpapdist kcat/Km(DNA) = 1:1). However, a 6-fold site preference reveals itself mainly in the single-turnover rate constants with no change in DNA affinity (WTpapdist kchem/KD(DNA)/MTpapdist kchem/KD(DNA) = 1:6).
Two 21-bp oligonucleotides containing the proximal and distal GATC sites, including the 8–9 base pairs naturally flanking the target sites (Table 1), were designed for these studies. Additionally, a 21-bp oligonucleotide was designed with flanks that were shown to increase EcoDam processivity on the WTpapdist substrate (MTpapdist; Table 1). The MTpapdist substrate varies from the WTpapdist substrate only in the three base pairs immediately adjacent to the GATC site. The similar kcat/KMDNA ratios for the WTpapdist and MTpapdist substrates result from a 3-fold increase in kcat for WTpapdist when compared with MTpapdist, which is compensated for by a 3-fold increase in the KMDNA (Fig. 1, B and C). Thus, under steady-state conditions, there seems to be no apparent preference for one GATC site over another.
EcoDam methylates GATC sites in a highly processive manner catalyzing multiple turnovers prior to dissociating from the DNA (41). Because product release is rate-limiting under steady-state conditions and is dominating kcat, we included the pre-steady-state efficiency constant (kchem/KDDNA) for both the preferred and nonpreferred pap substrates (Fig. 1B). kchem is more relevant than kcat in the case of EcoDam, since it is highly unlikely that the enzyme will dissociate from the DNA prior to processively translocating to another GATC site. Thus, monitoring the kcat or product dissociation may not accurately predict preferential or nonpreferential methylation events. KDDNA and kchem determinations for each substrate best address the ability of EcoDam to both bind and catalyze the transfer of the methyl group on a particular DNA substrate. As previously observed by gel shift analysis (31), the WTpapdist and MTpapdist substrates showed no perturbation in DNA affinity under our anisotropy conditions (Fig. 1C). However, single-turnover analyses revealed an approximate 10-fold decrease in the rate of methylation on WTpapdist when compared with MTpapdist. The experiments with the pap-derived GATC sites provide a basis for characterizing other GATC sites; in particular, this work shows that kchem and KDDNA are the most insightful kinetic parameters when defining what are preferred and nonpreferred sites.
In Vitro Differentially Methylated GATCs—Previous work by Bergerat et al. showed that unmethylated GATC sites on supercoiled and linear pBR322 were differentially methylated in vitro (28). Some GATC sites were rarely or never methylated (Fig. 2A, sites E and F), whereas other sites were nearly completely methylated (Fig. 2A, sites A and C). The authors proposed that this could be due to one or a combination of the following. First, under conditions limited to a small number of catalytic turnovers, a facilitated diffusion mechanism could favor isolated GATCs due to their large amount of flanking DNA and increased probability of EcoDam initially binding in these regions. Subsequent linear diffusion would favor methylation at isolated GATC sites, since they would be the first that EcoDam would reach. As seen in Fig. 2A, highly preferred sites A and C are flanked by a large amount of noncognate DNA. However, the lack of preference at other isolated GATC sites (e.g. Fig. 2A, site B) on plasmid DNA suggests that a facilitated diffusion-based explanation does not fully explain the reason for preferential methylation. This prompted a second hypothesis that the composition of the base pairs immediately surrounding a GATC site has an affect on the ability of EcoDam to methylate at that position.
FIGURE 2.

Single-turnover rates are reduced on GATC sites shown to be poorly methylated in vitro. A, all GATC sites on pBR322 are annotated; those with positional labeling represented by a letter were used in the design of synthetic oligonucleotides. EcoDam was previously shown to preferentially methylate the GATC sites at positions A and C in vitro, whereas sites E and F were poorly methylated (28). Other lettered sites showed small to no methylation preference. B, EcoDam single-turnover rates for synthetic duplexes corresponding to the indicated site on pBR322. The rate of chemistry for methylation preferred GATC sites (sites A and C) is not enhanced when compared with those GATCs shown to have no methylation preference (sites B, D, G, I, and H). The poorly methylated sites (sites E and F) show a decrease in the rate of chemistry of ∼8-fold. Notably, sites E and F are located upstream of the origin of replication.
To test whether or not this in vitro site preference can be attributed to slow methylation kinetics, we designed small synthetic oligonucleotides based on the actual sequences flanking the GATC sites in pBR322 (Table 1). These 21-bp oligonucleotides mimicked both the preferred (Fig. 2A, sites A and C) and nonpreferred sites (Fig. 2A, sites E and F). Additionally, GATCs that were considered neither preferred nor nonpreferred (neutral) based on Guschlbauer's analysis were designed (Fig. 2A, sites B, D, G, H, and I) to observe the possibility of multiple levels of higher order specificity. The rate of methylation (kchem) on site E, which was inefficiently methylated on plasmid DNA, is decreased ∼10-fold when compared with the fastest site, H for this set of substrates. Although this would indicate that slow methylation kinetics is contributing to plasmid site preference, the rate of methylation for site F, which is never methylated on plasmid DNA and is predicted to have methylation kinetics equally as slow as or slow than site E, is decreased only 5-fold (Fig. 2B). Based on our kinetic analysis, we designated site E as nonpreferred and site F as semipreferred. Interestingly, sites that where neutral for methylation on plasmid DNA (Fig. 2A, sites B, D, G, H, and I) were methylated at the same rate as preferred sites A and C on small synthetic substrates. Therefore, we designated the neutral sites as preferred based on their kchem values. Although slow methylation kinetics may make some GATC sites unfavorable for methylation, another variable must contribute to the favorable site preference observed with the preferred sites on plasmid DNA.
The Origin of Replication—Chromosome replication in E. coli is known to be highly dependent on the methylation state of the overpopulated number of GATC sites located within the origin of replication (20, 42). The perfect sequence and position conservation of eight GATC sites, including some of the flanking sequences within the origins of E. coli, S. typhimurium, Klebsiella pneumoniae, Enterobacter aerogenes, Erwin carotovora, and Vibrio harveyi (21), is evidence of the importance of EcoDam methylation in this region. After replication, these GATC sites remain hemimethylated for approximately one-third of the bacterial cell cycle until they are remethylated and another round of replication begins (26). The binding of SeqA to the origin blocks methylation at the origin GATCs (43, 44); however, the large number of GATCs in this region and other unknown DNA factors has been suggested to contribute to the slow remethylation of the origin (25–27). Further, the predictions of Guschlbauer and co-workers (28), corroborated by our own prior work (31), suggest that the flanking DNA sequences around the GATC sites within the origin of replication are unfavorable for methylation.
We sought to test whether slow methylation kinetics resulting from the DNA flanking the conserved GATC sites in the origin of replication contribute to the lag in remethylation of this region. Fig. 3 shows the eight phylogenetically conserved GATC sites located in the origin of replication in E. coli (21). Synthetic duplexes 21 bp in length were designed based on these sites and the 8–9 base pairs flanking them on either end (Table 1). Positions 1 and 2 of the origin-derived GATCs showed a ∼3–4-fold decrease in methylation kinetics compared with that of a site with preferred flanks (Fig. 3). We defined these substrates as semipreferred, since this decrease is highly reproducible but not as extreme as the nonpreferred substrates. Having two adjacent GATCs with semipreferred flanks may interfere with the processive nature of the enzyme in the origin, as was shown previously with the pap operon (31). Importantly, our demonstration that the other six sites show preferential methylation rates suggests that the differential methylation of the origin-derived GATCs is due to factors beyond the flanking sequence effects probed here.
FIGURE 3.

Conserved GATC sites in the minimal origin of replication in E. coli are methylated at variable rates. Initiation of DNA replication in E. coli is promoted by the complete methylation of the overpopulated GATC sites in the oriC region of the genome. Of the 12 GATC sites located in this region, 8 (shown above) are perfectly conserved in position and sequence for E. coli, S. typhimurium, K. pneumonia, E. aerogenes, E. carotovora, and V. harveyi. Synthetic 21-bp oligonucleotides were designed based on the sequences surrounding and including the eight conserved GATC sites in the E. coli origin. Fig. 2 shows the position and single-turnover rate constant for each site. Two of the neighboring GATC sites show a decrease in the rate of methylation of ∼4-fold, indicating that slow methylation at individual GATCs could contribute to the lag in complete methylation of the origin.
In Vivo Protected GATCs—Wang and Church (19) revealed seven GATC sites within the E. coli genome that were protected from methylation by EcoDam. These GATCs are located in the noncoding regions of seven genes; mtlA, cdd, flhD, gut, carAB, pspA, and fep. A subsequent PCR-based interrogation verified the undermethylation of the initial seven GATCs but also identified 16 additional undermethylated GATCs in the 5′-noncoding regions of genes (18). Some of these sites are suspected to be bound by another protein, whereas the causes for the lack of methylation at other sites remain unknown. To address the methylation preference for 15 of these 23 GATC sites (Table 1), we directly measured the methyltransfer step, using short DNA oligonucleotides.
As seen in Fig. 4, the GATCs found in the noncoding region of the fep, rsp, and psp genes all showed a 3–5-fold decrease in methylation kinetics and were designated as semipreferred. Only one nonpreferred site was found from the in vivo protected GATCs tested; the car GATC showed a ∼10-fold decrease in the rate of methylation similar to that seen with the pap substrates (Fig. 4). The car operon encodes for carbamoylphosphate synthetase (CPSase), which is required for the biosynthesis of arginine and pyrimide residues (45, 46). Methylation of the nonregulatory GATC site in this region is thought to be blocked by the presence of the CarP protein, which represses transcription of the CPSase. Our findings suggest that the lack of methylation at the GATC could also be attributed to slow methylation kinetics when the site is not occupied by a competing protein. Although other GATC sites in the E. coli genome have since been found to be undermethylated (6), the subset of sites investigated here provides some understanding of the higher order specificity involved in EcoDam methylation.
FIGURE 4.

EcoDam methylates in vivo protected GATC sites at varying rates. Under single-turnover conditions, two synthetic 21-bp duplexes mimicking the proximal and distal GATC sites located 5′ to the pap coding region (red) reveal ∼10-fold decreases in methylation rate by EcoDam. Other GATC sites that are located 5′ to genes undermethylated in vivo were tested for this affect. In some cases, a protein is known to bind to proximal sites and potentially block methylation of the GATC site (green, Crp; yellow, CarP; blue, IHF; pink, Fur). However, in other cases, no such protein has been identified (cyan). These results indicate that although a protein may be contributing to the lack of methylation at some GATC sites (green), other sites (red and yellow) could be undermethylated due to slow chemistry at that GATC site.
Dissection of the Flanks—To better understand how flanking sequences impact GATC methylation, we compared the single-turnover results from Figs. 3, 4, 5. Although there is evidence for multiple levels of flanking sequence effects due to the preferred, semipreferred, and nonpreferred sites that we found, we focused on sites with the most extreme decreases in methylation (∼10-fold) for dissection of the flanks. Interestingly, all of these nonpreferred sites are flanked by a repeat of adenines four or five bases long on the 5′-end (Fig. 5A). A:A steps in a DNA sequence are the most rigid of all nucleotide steps (47–49). Additionally, four or more adenines found sequentially in a DNA sequence introduce an 18° bend in the helix (50, 51).
To discern whether or not the rigidity associated with multiple A:A steps or the A-tract in its entirety is responsible for the decreased methylation kinetics, we designed seven substrates based on the WTpapdist substrate (Fig. 5A). First, we systematically interrupted the A-tract at different positions with the most flexible dinucleotide step C:A (47–49) (R1–R4; Fig. 5A). The R1 construct is predicted to have the most flexibility close to the GATC site due to the flexible and proximal A:C step. As the cytosine is systematically moved further from the GATC site (R2–R4) and the number of A:A steps adjacent to the GATC increases, the flexibility of the flanks is predicted to decrease. The position dependence of the A-tract in relation to the GATC site was determined by designing oligonucleotides that systematically increase the distance of the A-tract from the target site (D1–D3; Fig. 5A). We increased the number of flexible A:C steps between the GATC site and the A-tract so that the A-tract is initially one base pair (D1) to three base pairs (D3) away from the GATC site.
With the exception of the WTpapdist construct, all of the substrates described above showed methylation rates similar to that seen with preferred flanks (Fig. 5B). These results suggest that a direction-dependent A-tract immediately flanking the 5′-end of a GATC site decreases the rate at which EcoDam can methylate that substrate. This result was further verified by single-turnover analysis of the WTpapdist in which the A-tract is positioned on the opposite side of the GATC (R-WTpapdist; Fig. 5B). This substrate was methylated at a rate similar to that seen on a preferred substrate, verifying both the direction and position dependence of the A-tract (Fig. 5B). More than four adenines directly adjacent to the GATC have the same affect on methylation; the car substrate is flanked by a 5-bp A-tract, and the decrease in kinetics is still apparent.
Competition Assay—Although the synthetic oligonucleotides provide a basis for obtaining detailed kinetic and thermodynamic parameters, the enzyme is normally confronted with DNA in which multiple GATC sites are surrounded by hundreds of nonspecific base pairs. Further, the extreme methylation preference observed on plasmid DNA is not reflected in our ∼10-fold change in methylation kinetics. Because of this, we sought to determine the extent to which such nonspecific DNA alters our findings with the short oligonucleotides. Our initial experiments involved a direct competition assay in which one DNA molecule contained a preferred (H) and nonpreferred (E) GATC site. The methylation of a 58-bp duplex with 10 and 19 base pairs flanking sites H and E, respectively, revealed no site preference (supplemental materials). However, any site preference was obscured by the highly processive methylation of both sites. The selective radioactive labeling of each strand did not reveal the methylation preference (data not shown). We predict that the close proximity of the GATC sites in relation to each other aids in the rapid methylation of both sites.
A second substrate used in a competition assay contained a larger amount of nonspecific DNA flanking the H and E sites, 125 and 113 bp, respectively (Fig. 6), and the predicted site preference is clearly observed. The protection of site H from DpnII cleavage corresponds to the appearance of the AB (158-bp) fragment (Fig. 6B). The counterprotection at site E is not visible (BC; 146-bp fragment) from time 0 to ∼40% conversion to methylated DNA. By monitoring early methylation events and fitting the formation of all products to a linear curve, we were able to compare the rate of formation of single methylation events at the preferred and nonpreferred site. Because no formation of the BC band corresponding to methylation at the nonpreferred site is visible, we estimated a lower limit detection sensitivity of 0.17% conversion and derived the rate of formation from this number (see “Experimental Procedures”). The greater than 37-fold preference for the preferred site over the nonpreferred site is described as the ratio of the two rates (νAB/νBC) of formation (Fig. 6C). This preference exceeds the ∼10-fold effect revealed with small substrates (Fig. 2) and suggests that the increased flanking DNA contributes to the site preference observed both in this work and in previous work (28). Interestingly, the processive methylation of the two sites remains evident. Although site E is accessible to methylation via a processive mechanism, it is not susceptible to single methylation as is seen with site H. These results concur with previous observations of site preference on a pap system (31) and implicate the large amount of nonspecific DNA in the regulation of site preference.
FIGURE 6.

Nonspecific DNA reveals preferential methylation by EcoDam. A, construct design of the 270-bp substrate places the preferred site H (white) on the same DNA molecule as nonpreferred site E (black). We tested two constructs, a 58-bp duplex (supplemental materials) and the 270-bp duplex shown. The distances between the two GATC sites on the two substrates are virtually identical (29 versus 33 bp), and they differ only in the amount of nonspecific DNA flanking either GATC site. B, competition assay on the 270-bp substrate performed with limiting enzyme and DNA and AdoMet in excess. We monitored only early turnover events (≤30% conversion), since this would be the most informative when observing site preference. The preferred site undergoes methylation, since the AB fragment increases over time. Although processive methylation remains evident, there was no detection of the BC fragment in our assay that has the ability to detect 0.17 ± 0.71% conversion of a substrate of similar size. C, graphical analysis of the 270-bp competition experiment. Formation of the AB (•) and ABC (▾) bands are shown in relation to reaction time. Assays were completed in triplicate, and the error bars correspond to the S.D. of the three trials. Results were analyzed using densitometry, and the percentage conversion was calculated by dividing the density of the band of choice by the density of all bands at that time point. Product formation of the AB and ABC bands was fit to a linear curve. D, the slope of the linear fit of the appearance of bands AB, BC, and ABC (νAB, νBC, and νABC) were determined and used to define the site preference factor (EP/EN-P) for each substrate. The νBC was estimated based on the lower limit of our detection capabilities. The site preference factor is the ratio of methylation at the preferred site (EP) versus that of the nonpreferred site (EN-P). Although no site preference was observed on the small 58-bp substrate, the large substrate showed a site preference factor of 37, favoring site H over site E.
DISCUSSION
EcoDam provides a structurally characterized and biologically important enzyme to investigate the basis of processive catalysis and the mechanisms that regulate differential site methylation. We have used steady-state and pre-steady-state kinetic analysis in combination with DNA affinity studies to characterize how the sequence identity and length of sequences immediately flanking biologically relevant GATCs control the ability of EcoDam to efficiently methylate the target adenine. Our results have relevance to the complex biological pathways involving EcoDam. Here, the nonpreferred substrates were methylated ∼10-fold more slowly, and semipreferred substrates were methylated ∼4-fold more slowly than preferred substrates (Figs. 2, 3, 4, 5, 6). Systematic modulation of the flanks surrounding the WTpapdist substrate revealed that a direction-dependent A-tract is responsible for the largest decrease in methylation kinetics (Fig. 5). These proximal effects are dramatically enhanced when the sites are placed into large DNA substrates. For EcoDam, these effects provide a basis for the differential methylation of GATC sites within the E. coli genome.
To better understand the trends associated with a preferred and a nonpreferred GATC site, we analyzed the substrates described in this study using multiple sequence alignment (Fig. 7). The preferred sites show little to no conservation of the bases within 5 bp on either side of the target GATC site (Fig. 7A). However, A:T-rich flanks are conserved (Fig. 7B) for substrates with a 3-fold or greater decrease in methylation kinetics. Finally, substrates with an 8-fold or higher decrease in methylation kinetics reveal a position-conserved A-tract immediately flanking the GATC site (Fig. 7C). Our results are consistent with the previous suggestion that GATC sites surrounded by multiple repeats of the same base pair are poorly methylated, whereas nonrepetitive flanking C:G base pairs are preferentially methylated (28). Although there is no clear evidence for C:G base pairs enhancing the preference of a GATC site, this analysis shows that A:T-rich flanks, especially repetitive runs of either, can do the contrary.
FIGURE 7.

Flanking sequence conservation of preferred, semipreferred, and nonpreferred GATCs. A, multiple sequence alignment of biologically derived GATC sites used in this study with fast methylation kinetics (<2-fold variation in kchem). Little to no sequence conservation of the flanks is observed for these preferentially methylated sites. B, multiple sequence alignment of biologically derived GATCs with 3–5-fold reductions in methylation rates. Conservation of A:T-rich flanks may be contributing to the decrease in methylation kinetics for semipreferred substrates. C, multiple sequence alignment of substrates showing an 8-fold or greater decrease in methylation kinetics reveals high conservation of a 5′ A-tract in relation to the GATC site. Nonpreferred sites retain an A:T-rich 3′-flank similar to that seen with the semipreferred substrates.
The pap GATC sites show only slight changes in kcat and KMDNA relative to the preferred GATC sites, resulting in minor changes in kcat/KMDNA. The KDDNA for each substrate was virtually identical, whereas the rate of methyltransfer (kchem) shows significant changes in response to flanking DNA differences. Thus, unlike regulatory proteins which also show flanking sequence effects, EcoDam is altered at the level of catalysis, not binding. For example, DNA affinity for TATA-binding protein and integration host factor vary 10- and 20-fold, respectively, in response to the nucleotides flanking their consensus sequences (52, 53). The response of EcoDam at the level of methylation kinetics may serve to ensure that the enzyme remains bound to the DNA during its methylation of GATC sites flanked by nonpreferred sequences, since such processive methylation is essential for the extensive and important labeling of the parent strand for mismatch repair. As such, EcoDam has evolved to discriminate at the catalytic step of its reaction cycle in a manner similar to the discrimination observed with well characterized restriction endonucleases EcoRI and EcoRV (35, 54, 54–57).
Comparison of the co-crystal structures of restriction endonuclease EcoRV and EcoDam reveals extensive direct hydrogen bond interactions with the phosphate backbone of the DNA flanking the cognate site for each enzyme (25, 58, 59) (Fig. 8). Similar to EcoDam, the affinity of EcoRV for substrates varying in the DNA sequences flanking its target site 5′-GATATC-3′ is not altered, whereas the rate of cleavage for the same substrates does vary (54, 57). The contacts made by EcoRV to the flanking DNA phosphate backbone contribute to the indirect recognition mechanism (54). An EcoRV mutant deficient in one of these flanking interactions is altered ∼90-fold in kcat/KMDNA in response to substrates with varying flanking sequences; thus, this interaction is important for enabling the efficient cleavage of cognate sites regardless of the flanking sequence. Within the 10-base pair region of DNA that interacts with EcoDam, direct contacts or water-mediated contacts occur to five sequential phosphates 5′ of the target adenine. Additionally, four phosphates located on the nontarget strand 3′ to the target adenine are directly contacted. Five of the direct contacts outside the GATC site involving Asn126, Arg95, Asn132, Arg116, and Lys139 are conserved within EcoDam orthologs (60). A subset of these residues (Asn126, Arg95, and Asn132) may be important for positioning EcoDam properly onto its target so that methylation can occur (58) and may contribute to the high level of processivity observed with this enzyme (31). Our results suggest that these conserved phosphate interactions may be mediating higher order specificity similar to that seen with EcoRV (54, 57). Mutagenic studies to determine the contribution of these residues to site preference and processivity are under way.
Our kinetic and thermodynamic analysis of discrimination provides a basis for understanding the methylation specificity of individual GATC sites by the enzyme (Table 1 and Figs. 2, 3, 4, 5, 6). However, the original observations by Guschlbauer and co-workers (28) suggest a more dramatic variation in preferential methylation on GATC sites within large plasmid substrates. We have observed differential kinetics between small and large substrates with other DNA-modifying enzymes (34, 61–63) and therefore sought to determine if a more biologically relevant substrate involving multiple sites and larger DNA would enhance the site preference we observed with kinetics. Our initial competition experiment placed preferred and nonpreferred GATCs sites 10 and 19 base pairs from either end of the DNA and 29 bp from each other, respectively. This substrate did not reveal any site preference under the conditions tested because of the highly level of processivity (supplemental materials). This is consistent with previous studies indicating that EcoDam methylates multiple GATC sites in a highly processive reaction (41). However, when the same preferred and nonpreferred GATC site were placed 125 and 113 bp from either end and 33 bp from each other, respectively, site preference is easily observed (Fig. 6).
Like most DNA-binding enzymes, EcoDam uses a facilitated diffusion mechanism by which the enzyme initially binds nonspecifically to the DNA and then translocates by various processes to find its target site (64, 65). Importantly, the search process is extremely efficient and contributes to the efficiency of an enzyme binding its target site (34, 63, 66, 67). DNA methylation by M.EcoRI, for example, is approximately 4 times more efficient (kcat/KMDNA) when its target site is flanked by a large amount of nonspecific DNA. This increase in efficiency is mainly due to a decrease in KMDNA attributed to a faster association rate via facilitated diffusion (66–68). EcoDam also uses linear diffusion (41); however, preliminary kcat/KMDNA analysis of preferred and nonpreferred GATC sites centrally located on unique 270-bp substrates shows minimal preference (data not shown), similar to what we observed with small synthetic substrates (Fig. 1).
The preferential methylation reported here and previous work revealing preferential methylation of isolated GATCs within plasmid DNA implicate the motion of EcoDam on DNA as a contributing factor in its methylation efficiency. Although more analysis is needed to understand this phenomenon, it appears that GATC sites found in clusters flanked by a large amount of nonspecific DNA are more poorly methylated than isolated sites. This may be of particular importance in the origin of replication involving the methylation of a high density cluster of 11 GATC sites. Previous studies on the remethylation of the origin suggest that the delay of methylation is partially due to factors beyond the presence of SeqA (25–27). We present evidence that the high concentration of GATCs in this region, in conjunction with the A:T-rich flanks surrounding them, decrease the rate at which the origin is methylated. The close proximity of the GATC sites could also enhance site discrimination and further reduce the rate of remethylation of the origin.
The response of EcoDam to variations in the DNA flanking its target GATC site may have biological implications beyond what is revealed in this study. Our results suggest that EcoDam responds negatively to DNA that is bent by an A-tract. Regulatory proteins, such as CAP (69) or IHF (70), often bend DNA upon binding in the same region in which EcoDam methylates a regulatory GATC. Notably, SeqA has been implicated in bending the DNA in the origin of replication upon binding hemimethylated GATCs (71). Perhaps the protein-induced DNA bending serves in part to regulate the efficiency of GATC methylation, when the GATC sites occur in close proximity. Furthermore, GATC sites themselves introduce a slight bend into the DNA helix and could affect the regulatory proteins known to bind in the same region (72). This bending may also regulate EcoDam itself, since our results suggest that EcoDam has evolved to efficiently read out the DNA structure surrounding its cognate site.
In summary, EcoDam preferentially methylates GATC sites within the genome in response to the DNA flanking them. The base pairs immediately flanking the GATC and the length of nonspecific DNA surrounding the GATC site contribute to this response. The indirect read-out that EcoDam uses appears to be modulated by the conserved residues in direct contact with the DNA phosphate backbone in the flanking regions.
Supplementary Material
This work was supported, in whole or in part, by National Institutes of Health Grant GM53763. The costs of publication of this article were defrayed in part by the payment of page charges. This article must therefore be hereby marked “advertisement” in accordance with 18 U.S.C. Section 1734 solely to indicate this fact.
The on-line version of this article (available at http://www.jbc.org) contains supplemental Fig. 1.
Footnotes
The abbreviations used are: AdoMet, S-adenosylmethionine; EcoDam, E. coli DNA adenine methyltransferase; BSA, bovine serum albumin.
References
- 1.Bestor, T. H., and Verdine, G. L. (1994) Curr. Opin. Cell Biol. 6 380–389 [DOI] [PubMed] [Google Scholar]
- 2.Bheemanaik, S., Reddy, Y. V. R., and Rao, D. N. (2006) Biochem. J. 399 177–190 [DOI] [PMC free article] [PubMed] [Google Scholar]
- 3.Cheng, X. D., and Roberts, R. J. (2001) Nucleic Acids Res. 29 3784–3795 [DOI] [PMC free article] [PubMed] [Google Scholar]
- 4.Wilson, G. G., and Murray, N. E. (1991) Annu. Rev. Genet. 25 585–627 [DOI] [PubMed] [Google Scholar]
- 5.Lobner-Olesen, A., Skovgaard, O., and Marinus, M. G. (2005) Curr. Opin. Microbiol. 8 154–160 [DOI] [PubMed] [Google Scholar]
- 6.Casadesus, J., and Low, D. (2006) Microbiol. Mol. Biol. Rev. 70 830–856 [DOI] [PMC free article] [PubMed] [Google Scholar]
- 7.Heithoff, D. M., Sinsheimer, R. L., Low, D. A., and Mahan, M. J. (1999) Science 284 967–970 [DOI] [PubMed] [Google Scholar]
- 8.Julio, S. M., Heithoff, D. M., Provenzano, D., Klose, K. E., Sinsheimer, R. L., Low, D. A., and Mahan, M. J. (2001) Infect. Immun. 69 7610–7615 [DOI] [PMC free article] [PubMed] [Google Scholar]
- 9.Eberhard, J., Oza, J., and Reich, N. O. (2001) FEMS Microbiol. Lett. 195 223–229 [DOI] [PubMed] [Google Scholar]
- 10.Piekarowicz, A., Brzezinski, R., and Kauc, L. (1975) Acta Microbiol. Pol. Ser. A Microbiol. Gen. 7 51–65 [PubMed] [Google Scholar]
- 11.Heusipp, G., Falker, S., and Schmidt, M. A. (2007) Int. J. Med. Microbiology 297 1–7 [DOI] [PubMed] [Google Scholar]
- 12.Mashhoon, N., Pruss, C., Carroll, M., Johnson, P. H., and Reich, N. O. (2006) J. Biomol. Screening 11 497–510 [DOI] [PubMed] [Google Scholar]
- 13.Herman, G. E., and Modrich, P. (1982) J. Biol. Chem. 257 2605–2612 [PubMed] [Google Scholar]
- 14.Oshima, T., Wada, C., Kawagoe, Y., Ara, T., Maeda, M., Masuda, Y., Hiraga, S., and Mori, H. (2002) Mol. Microbiol. 45 673–695 [DOI] [PubMed] [Google Scholar]
- 15.Watson, M. E., Jarisch, J., and Smith, A. L. (2004) Mol. Microbiol. 53 651–664 [DOI] [PubMed] [Google Scholar]
- 16.Wu, H., Lippmann, J. E., Oza, J. P., Zeng, M., Fives-Taylor, P., and Reich, N. O. (2006) Oral Microbiol. Immunol. 21 238–244 [DOI] [PubMed] [Google Scholar]
- 17.Alonso, A., Pucciarelli, M. G., Figueroa-Bossi, N., and Garcia-del Portillo, F. (2005) J. Bacteriol. 187 7901–7911 [DOI] [PMC free article] [PubMed] [Google Scholar]
- 18.Tavazoie, S., and Church, G. M. (1998) Nat. Biotechnol. 16 566–571 [DOI] [PubMed] [Google Scholar]
- 19.Wang, M. X., and Church, G. M. (1992) Nature 360 606–610 [DOI] [PubMed] [Google Scholar]
- 20.Smith, D. W., Garland, A. M., Herman, G., Enns, R. E., Baker, T. A., and Zyskind, J. W. (1985) EMBO J. 4 1319–1326 [DOI] [PMC free article] [PubMed] [Google Scholar]
- 21.Zyskind, J. W., and Smith, D. W. (1986) Cell 46 489–490 [DOI] [PubMed] [Google Scholar]
- 22.Brendler, T., and Austin, S. (1999) EMBO J. 18 2304–2310 [DOI] [PMC free article] [PubMed] [Google Scholar]
- 23.Skarstad, K., Lueder, G., Lurz, R., Speck, C., and Messer, W. (2000) Mol. Microbiol. 36 1319–1326 [DOI] [PubMed] [Google Scholar]
- 24.Slater, S., Wold, S., Lu, M., Boye, E., Skarstad, K., and Kleckner, N. (1995) Cell 82 927–936 [DOI] [PubMed] [Google Scholar]
- 25.Bach, T., and Skarstad, K. (2005) J. Mol. Biol. 350 7–11 [DOI] [PubMed] [Google Scholar]
- 26.Campbell, J. L., and Kleckner, N. (1990) Cell 62 967–979 [DOI] [PubMed] [Google Scholar]
- 27.Lu, M., Campbell, J. L., Boye, E., and Kleckner, N. (1994) Cell 77 413–426 [DOI] [PubMed] [Google Scholar]
- 28.Bergerat, A., Kriebardis, A., and Guschlbauer, W. (1989) J. Biol. Chem. 264 4064–4070 [PubMed] [Google Scholar]
- 29.Blyn, L. B., Braaten, B. A., and Low, D. A. (1990) EMBO J. 9 4045–4054 [DOI] [PMC free article] [PubMed] [Google Scholar]
- 30.Hernday, A. D., Braaten, B. A., and Low, D. A. (2003) Mol. Cell 12 947–957 [DOI] [PubMed] [Google Scholar]
- 31.Peterson, S. N., and Reich, N. O. (2006) J. Mol. Biol. 355 459–472 [DOI] [PubMed] [Google Scholar]
- 32.Zinoviev, V. V., Evdokimov, A. A., Malygin, E. G., Sclavi, B., Buckle, M., and Hattman, S. (2007) Biol. Chem. 388 1199–1207 [DOI] [PubMed] [Google Scholar]
- 33.Mashhoon, N., Carroll, M., Pruss, C., Eberhard, J., Ishikawa, S., Estabrook, R. A., and Reich, N. (2004) J. Biol. Chem. 279 52075–52081 [DOI] [PubMed] [Google Scholar]
- 34.Jack, W. E., Terry, B. J., and Modrich, P. (1982) Proc. Natl. Acad. Sci. U. S. A. 79 4010–4014 [DOI] [PMC free article] [PubMed] [Google Scholar]
- 35.Stanford, N. P., Szczelkun, M. D., Marko, J. F., and Halford, S. E. (2000) EMBO J. 19 6546–6557 [DOI] [PMC free article] [PubMed] [Google Scholar]
- 36.Thompson, J. D., Gibson, T. J., Plewniak, F., Jeanmougin, F., and Higgins, D. G. (1997) Nucleic Acids Res. 25 4876–4882 [DOI] [PMC free article] [PubMed] [Google Scholar]
- 37.Schneider, T. D., and Stephens, R. M. (1990) Nucleic Acids Res. 18 6097–6100 [DOI] [PMC free article] [PubMed] [Google Scholar]
- 38.Crooks, G. E., Hon, G., Chandonia, J. M., and Brenner, S. E. (2004) Genome Res. 14 1188–1190 [DOI] [PMC free article] [PubMed] [Google Scholar]
- 39.Shannon, C. E. (1948) Bell Syst. Tech. J. 27 379–423 [Google Scholar]
- 40.Lobnerolesen, A., Boye, E., and Marinus, M. G. (1992) Mol. Microbiol. 6 1841–1851 [DOI] [PubMed] [Google Scholar]
- 41.Urig, S., Gowher, H., Hermann, A., Beck, C., Fatemi, M., Humeny, A., and Jeltsch, A. (2002) J. Mol. Biol. 319 1085–1096 [DOI] [PubMed] [Google Scholar]
- 42.Russell, D. W., and Zinder, N. D. (1987) Cell 50 1071–1079 [DOI] [PubMed] [Google Scholar]
- 43.Lobner-Olesen, A., Marinus, M. G., and Hansen, F. G. (2003) Proc. Natl. Acad. Sci. U. S. A. 100 4672–4677 [DOI] [PMC free article] [PubMed] [Google Scholar]
- 44.Kang, S., Lee, H., Han, J. S., and Hwang, D. S. (1999) J. Biol. Chem. 274 11463–11468 [DOI] [PubMed] [Google Scholar]
- 45.Charlier, D., Gigot, D., Huysveld, N., Roovers, M., Pierard, A., and Glansdorff, N. (1995) J. Mol. Biol. 250 383–391 [DOI] [PubMed] [Google Scholar]
- 46.Charlier, D., Hassanzadeh, G., Kholti, A., Gigot, D., Pierard, A., and Glansdorff, N. (1995) J. Mol. Biol. 250 392–406 [DOI] [PubMed] [Google Scholar]
- 47.Packer, M. J., Dauncey, M. P., and Hunter, C. A. (2000) J. Mol. Biol. 295 85–103 [DOI] [PubMed] [Google Scholar]
- 48.Travers, A. A. (2004) Philos. Trans. R. Soc. London Ser. A Math. Phys. Eng. Sci. 362 1423–1438 [DOI] [PubMed] [Google Scholar]
- 49.Packer, M. J., Dauncey, M. P., and Hunter, C. A. (2000) J. Mol. Biol. 295 71–83 [DOI] [PubMed] [Google Scholar]
- 50.Nelson, H. C. M., Finch, J. T., Luisi, B. F., and Klug, A. (1987) Nature 330 221–226 [DOI] [PubMed] [Google Scholar]
- 51.MacDonald, D., Herbert, K., Zhang, X. L., Polgruto, T., and Lu, P. (2001) J. Mol. Biol. 306 1081–1098 [DOI] [PubMed] [Google Scholar]
- 52.Faiger, H., Ivanchenko, M., Cohen, I., and Haran, T. E. (2006) Nucleic Acids Res. 34 104–119 [DOI] [PMC free article] [PubMed] [Google Scholar]
- 53.Hales, L. M., Gumport, R. I., and Gardner, J. F. (1996) Nucleic Acids Res. 24 1780–1786 [DOI] [PMC free article] [PubMed] [Google Scholar]
- 54.Wenz, C., Hahn, M., and Pingoud, A. (1998) Biochemistry 37 2234–2242 [DOI] [PubMed] [Google Scholar]
- 55.Vancleve, M. D., and Gumport, R. I. (1992) Biochemistry 31 334–339 [DOI] [PubMed] [Google Scholar]
- 56.Halford, S. E., Johnson, N. P., and Grinsted, J. (1980) Biochem. J. 191 581–592 [DOI] [PMC free article] [PubMed] [Google Scholar]
- 57.Taylor, J. D., and Halford, S. E. (1992) Biochemistry 31 90–97 [DOI] [PubMed] [Google Scholar]
- 58.Horton, J. R., Liebert, K., Bekes, M., Jeltsch, A., and Cheng, X. D. (2006) J. Mol. Biol. 358 559–570 [DOI] [PMC free article] [PubMed] [Google Scholar]
- 59.Winkler, F. K., Banner, D. W., Oefner, C., Tsernoglou, D., Brown, R. S., Heathman, S. P., Bryan, R. K., Martin, P. D., Petratos, K., and Wilson, K. S. (1993) EMBO J. 12 1781–1795 [DOI] [PMC free article] [PubMed] [Google Scholar]
- 60.Yang, Z., Horton, J. R., Zhou, L., Zhang, X. J., Dong, A. P., Zhang, X., Schlagman, S. L., Kossykh, V., Hattman, S., and Cheng, X. D. (2003) Nat. Struct. Biol. 10 849–855 [DOI] [PMC free article] [PubMed] [Google Scholar]
- 61.Allan, B. W., Garcia, R., Maegley, K., Mort, J., Wong, D., Lindstrom, W., Beechem, J. M., and Reich, N. O. (1999) J. Biol. Chem. 274 19269–19275 [DOI] [PubMed] [Google Scholar]
- 62.Youngblood, B., and Reich, N. O. (2006) J. Biol. Chem. 281 26821–26831 [DOI] [PubMed] [Google Scholar]
- 63.Jeltsch, A., Wenz, C., Stahl, F., and Pingoud, A. (1996) EMBO J. 15 5104–5111 [PMC free article] [PubMed] [Google Scholar]
- 64.Vonhippel, P. H., and Berg, O. G. (1989) J. Biol. Chem. 264 675–678 [PubMed] [Google Scholar]
- 65.Halford, S. E., and Marko, J. F. (2004) Nucleic Acids Res. 32 3040–3052 [DOI] [PMC free article] [PubMed] [Google Scholar]
- 66.Surby, M. A., and Reich, N. O. (1996) Biochemistry 35 2201–2208 [DOI] [PubMed] [Google Scholar]
- 67.Surby, M. A., and Reich, N. O. (1996) Biochemistry 35 2209–2217 [DOI] [PubMed] [Google Scholar]
- 68.Surby, M. A., and Reich, N. O. (1992) Abstracts of Papers of the American Chemical Society 203 110-BIOL [Google Scholar]
- 69.Schultz, S. C., Shields, G. C., and Steitz, T. A. (1991) Science 253 1001–1007 [DOI] [PubMed] [Google Scholar]
- 70.Ellenberger, T., and Landy, A. (1997) Structure 5 153–157 [DOI] [PubMed] [Google Scholar]
- 71.Han, J. S., Kang, S. Y., Kim, S. H., Ko, M. J., and Hwang, D. S. (2004) J. Biol. Chem. 279 30236–30243 [DOI] [PubMed] [Google Scholar]
- 72.Polaczek, P., Kwan, K., and Campbell, J. L. (1998) Mol. Gen. Genet. 258 488–493 [DOI] [PubMed] [Google Scholar]
Associated Data
This section collects any data citations, data availability statements, or supplementary materials included in this article.