Abstract
We use an off-lattice minimalist model to describe the effects of pressure in slowing down the folding/unfolding kinetics of proteins when subjected to increasingly larger pressures. The potential energy function used to describe the interactions between beads in the model includes the effects of pressure on the pairwise interaction of hydrophobic groups in water. We show that pressure affects the participation of contacts in the transition state. More significantly, pressure exponentially decreases the chain reconfigurational diffusion coefficient. These results are consistent with experimental results on the kinetics of pressure-denaturation of staphylococcal nuclease.
Keywords: pressure denaturation, hydrophobic effect, activation volumes, water penetration, energy landscape
Proteins are responsible for most of the functions that occur in living organisms. Their activity, however, depends on their three-dimensional structure and dynamics, and for this reason protein folding has been a central problem in molecular biology. Energy landscapes and the funnel concept have provided the theoretical framework for a quantitative understanding of the folding problem. To firmly establish the connection between this theoretical framework and reality, a generation of experiments have been devised to probe the details of the early folding events and to explore the topography of the folding landscape. A powerful technique that has received recent attention is the pressure dependence of protein-folding kinetics (1–6). Developing the theoretical tools to interpret these pressure experiments on light of landscape theory is the focus of this paper.
Proteins undergo reversible folding/unfolding transitions when subjected to hydrostatic pressures of 2–10 kilobars (kbar) (1). Despite the fact that folded proteins are highly incompressible (7, 8), pressure induces conformational changes that reduce the overall volume of the system. This decrease in volume results from the exposure of hydrophobic groups in the interior of the protein to solvent. The effects of pressure on the dynamic structure of water interacting with proteins and polymers are complex but well studied (4, 9–11). Water will balance the tendency of forming an open structure resulting from directional hydrogen bond interactions, with the tendency to pack as Lennard–Jones particles to reduce its volume. This balance is shifted with the application of pressure. The dynamic fluctuations of a protein in aqueous solvent will, as a consequence, be affected by pressure. Equilibrium solvation properties are also affected by pressure.
Kauzmann (12) pointed out that the pressure dependence of protein unfolding is in disagreement with the hydrophobic core model. His objections were based on the observation that change in volume (ΔV) upon unfolding is positive at low P, but negative for P = 1–2 kbar. The transfer of hydrocarbons into water shows exactly the opposite behavior. A solution to this puzzle was recently suggested by Hummer et al. (4) by focusing on the pressure-dependent transfer of water into the protein interior, in contrast to the transfer of nonpolar residues into water. That is, pressure denaturation corresponds to the transfer of nonpolar groups into water.
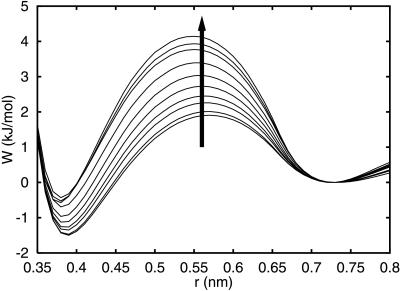
Fig. 1 shows the potential of mean force (PMF) between two methane-like particles in water for pressures up to 7 kbar, calculated using the Information Theory Model for hydrophobic interactions (4, 13, 14). The PMF exhibit two minima—a contact minimum at 0.4 nm distance and a solvent-separated minimum at a distance of about 0.7 nm. The two minima are separated by a desolvation barrier with a width of approximately one water molecule diameter. The PMFs are normalized at the solvent-separated minimum to illustrate that the contact minimum is shallow relative to the energy of the solvent-separated minimum. Meanwhile, the desolvation barrier between these two minima increases with pressure. Physically, these phenomena can be justified with a simple model: At low pressures, the interstitial space between two large nonpolar solutes is energetically unfavorable for water molecules. As the pressure increases, the space between nonpolar solutes is more likely to be occupied by water molecules, thus increasing the sampling of the solvent-separated configurations. The increase of the desolvation barrier between contact and solvent-separated minima can be quantified by calculating the barrier heights ΔWf‡ and ΔWu‡ from the solvent-separated and contact minima, respectively. ΔWf‡ and ΔWu‡ are the barriers for forming and breaking hydrophobic contact configurations, corresponding to the contact-formation and contact-breaking reactions, respectively. The activation volumes, which can be defined as Δvf/u‡ = ∂ΔWf/u‡/∂p, are both positive, with Δvf‡ = 3.8 ml/mol and Δvu‡ = 1.6 ml/mol. Δvu/f‡ are constant for pressures below 5 kbar (4). Increasing pressure is expected to slow down the kinetics of hydrophobic pair formation and breaking. Experimental studies of pressure dependence of folding and unfolding kinetics on staphylococcal nuclease (Snase) and trp repressor showed a reduction of both rates with increasing pressure (1–3, 5).
Figure 1.
Pressure dependence of the PMF between two methane-like solutes in water. The arrow indicates changes with increasing pressures from −.16 to 7.25 kbar.
The present model for pressure-induced denaturation of proteins is based on the properties of pairwise interactions of simple solutes in pure water and does not consider large-scale effects (15). Molecular dynamics (MD) simulations of water/methane solutions are in qualitative agreement with this model (16). However, a protein contains both polar and hydrophobic groups distributed along the chain, and competition between polar and hydrophobic interactions plays a crucial role in the equilibrium properties of proteins. Much insight can be gained by describing how pressure affects protein dynamics and folding, accounting for competing polar and ionic solvation, and correlated multiparticle interactions. All-atom MD studies are limited, however, by the extremely slow relaxation of proteins at high pressures. Experimental studies of pressure-induced unfolding of Snase show that the transition takes hours (1, 3). Minimalist models for proteins can capture the correct physics for describing the role of the hydrophobic core formation in proteins by mimicking the role of pressure on pairwise side-chain interactions. In this manuscript, we present an off-lattice minimalist model that captures the combined role of the folding transition state and changes in the chain configurational diffusion in describing the activation volume changes in pressure-induced protein folding/unfolding. The increase with pressure in the desolvation barrier for an individual pair contact formation leads to a reduction in the chain reconfigurational diffusion coefficient, thus increasing the folding and unfolding times.
Minimalist Model For Describing Pressure Effects on Protein-Folding Kinetics
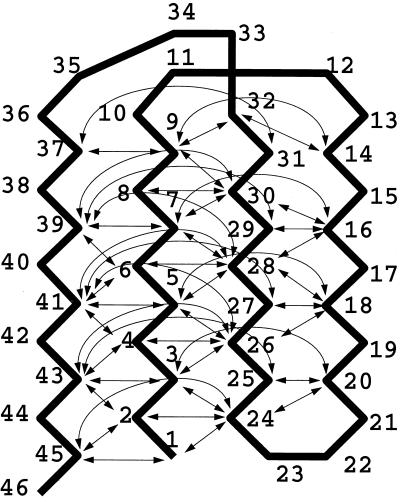
We incorporate pressure effects into a minimalist model by using a simple square-well potential with an infinite repulsive core to represent the PMF of hydrophobic groups' aggregation in aqueous solution (shown in Fig. 1). A model for the widely studied (17–19) β-barrel protein that has a funnel-like energy landscape is constructed. This system is minimally frustrated in the sense that all native interactions favor folding, only one structure is favored at the bottom of the funnel, and all native interactions are equally distributed throughout the structure. For this model, we can clearly use the number of native contacts, Q, as an approximate-reaction coordinate. The simplest off-lattice representation of this model is known as a Gō model (18). Here, we use the Gō model studied by Nymeyer et al. (18), but the potential interaction energy is changed to the square-well pair potential described below. The ground-state structure and the attractive interactions included in the Gō model are shown in Fig. 2.
Figure 2.
An illustration of the ground state of the Gō model. Each arrow represents an attractive interaction that exists between two monomers; there are 47 interactions. The nonbonded interaction between two monomers without a connecting arrow is a hard core repulsion term responsible for excluded volume.
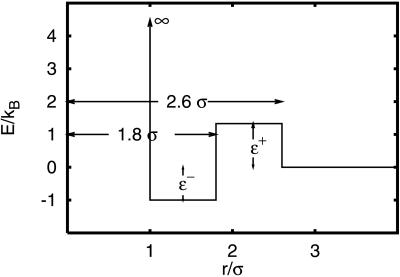
The potential energy function used is shown in Fig. 3, where ɛ+ and ɛ− represent the barriers from the solvent-separated minimum to the desolvation barrier and the well depth of the contact minimum. In this model, the basic kinetic step in the pairwise interaction is getting water in/out of hydrophobic contacts. This contrasts with the lattice HP (20, 21), off-lattice Lennard–Jones (17, 18), Morse (22), and square-well (23) potential energy models where there is no desolvation barrier, and, as a consequence, the basic kinetic step is the amino acids (beads) contact formation by finding each other through free diffusion. The pairwise desolvation barrier is a source of local roughness in the protein energy landscape. Following the pressure dependence of ΔWf/u‡ described above, we parameterize the pressure dependence of the model potential by tuning the energies ɛ+ = 1.333 + .2778P, and ɛ− = −1.00 + .1667P, where P is in kbar. At P = 0, the contact-well depth is −1, and the desolvation barrier from the solvent separated configuration is 1.333. Units of energy have been chosen for convenience so that the relevant temperatures are of order one. Energies are shown in units of temperature. The temperature dependence of the hydrophobic PMF is not taken into account. As a consequence, we do not expect our model to describe cold denaturation (24).
Figure 3.
Square-well potential with a desolvation barrier representing the hydrophobic-pair potential between pairs of beads participating in native contacts in the Gō model. We parameterize the pressure dependence of the model potential by ɛ+ = 1.333 + .2778P, and ɛ− = −1.00 + .1667P, where P is in kbar. At P = 0, the contact-well depth is −1, and the desolvation barrier from the solvent-separated configuration is 1.333. Here the units of energy have been chosen for convenience so that the relevant temperatures are of order one. Energies are shown in units of temperature.
The dynamics are studied with the Metropolis Monte Carlo (MC) simulations with a move set including chain ends and crankshaft moves. Multiple simulations are done at various temperatures and pressures. Histograms are collected to reconstruct the density of states Ω(E, Q, P), where Q is an order parameter, taken here as the degree of similarity between a state and the native state (i.e., number of contacts in common). To compare our results with the calculations by Nymeyer et al. (18), we obtained the free-energy surface for a system with a square-well potential of ɛ+ = 0, and ɛ− = −1, i.e., with no desolvation barrier.
Results and Discussion
Free-Energy Profiles.
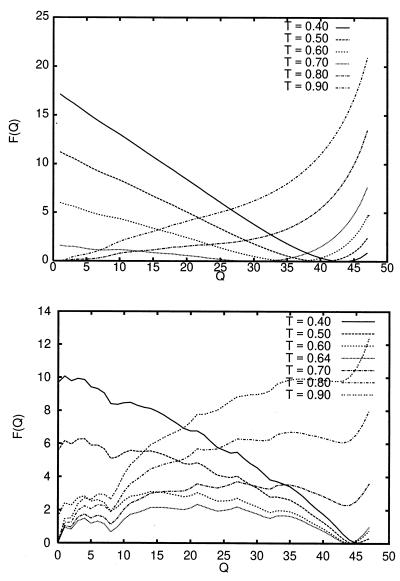
Fig. 4 shows the free energy of the system with (Lower) and without (Upper) a desolvation barrier in the potential, as a function of Q at various temperatures. These curves are similar to those in figure 7 of Nymeyer et al. (18). The free-energy curve at T ∼ Tf for the system without a desolvation barrier exhibits a very small transition-state free-energy barrier of approximately 0.2 energy units separating the folded and unfolded states. The free-energy curve at T ∼ Tf for the system with a desolvation barrier exhibits a significantly larger free-energy barrier of about 1.8 energy units. The free-energy profile of the model with a desolvation barrier is rougher than the corresponding curves for the model with no desolvation barrier. The roughness in the free-energy profiles can be attributed to the local roughness introduced by the pairwise desolvation barrier, where the formation of a native pair may force chain-constrained neighboring beads to form pairs within the desolvation-barrier region.
Figure 4.
Free-energy curves as a function of the folding order parameter Q, at various temperatures for the square-well potential-energy function with no desolvation barrier (Upper), and with a desolvation barrier corresponding to P = 0 kbar (Lower). Tf for the no desolvation and desolvation models are Tf ∼ 0.74 and Tf ∼ 0.64, respectively.
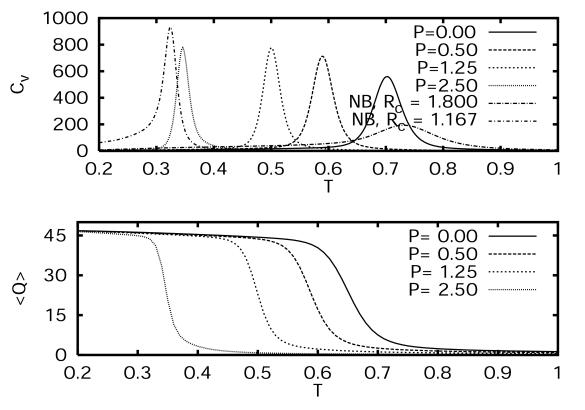
Fig. 5 shows the specific heat as a function of temperature of the Gō model with a potential energy function with and without desolvation barriers. The width and height of the specific heat peak at T ∼ Tf are narrower and higher when the desolvation barrier is present. This suggests that the folding transition becomes more cooperative with a pairwise desolvation barrier. The peak heights also increase with pressure at lower pressures (P ≤ 0.5 kbar) and saturate for higher pressures. The transition temperature and the width and height of the Cv curve depend on the width of the contact minimum attractive potential well. For narrower square-well width, the transition temperature is lower (Tf ∼ 0.3 for Rc = 1.167; Tf ∼ 0.74 for Rc = 1.8), the specific heat peaks are higher, and the specific heat width is narrower. In all of our calculations, unless otherwise specified, we used Rc = 1.8. Fig. 5 also shows 〈Q〉 as a function of T for various pressures. The apparent latent heat described at T ∼ Tf by a peak in Cv coincides with the sharp change in 〈Q〉.
Figure 5.
The specific heat, Cv, of the Gō model vs. temperature for various pressures, and for the potential-energy function without a desolvation barrier (Upper) is contrasted with the folding denaturation curves (Lower). The specific heat for the model with no desolvation barrier is labeled NB, with Rc = 1.8 and Rc = 1.167, where Rc is the width of the attractive square-well potential.
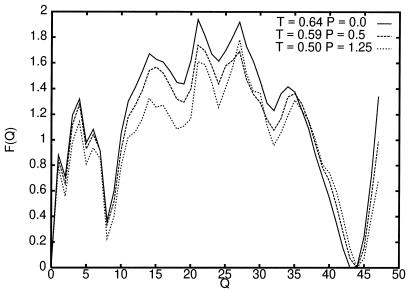
Fig. 6 shows the free-energy profiles as a function of the folding-order parameter Q at the folding temperature Tf for each of the various pressures (in kbar). Here, the transition-state energy is much larger (≈1.8), the folding temperatures are lower, and the free-energy profile is more rugged than for the model with no desolvation barrier. Several local free-energy minima are observed, yet, energy barriers smaller than 0.5 separate these local minima so they would be averaged over in most kinetic experiments. The transition-state value of the number of contacts order parameter, Q = Q‡, corresponding to the largest free-energy barrier (measured from the folded state) changes with pressure. The barrier at Q = 22 is the largest at P = 0, and decreases with P at all pressures. However, at higher P, the barrier at Q = 27 is the largest. This barrier first decreases with P, but at higher P, later increases. If we neglect chain-diffusion effects on the folding rate, this free-energy curve will suggest that the free-energy barrier decreases with pressure at low pressures, but it increases at higher pressures. However, chain diffusion cannot be discarded. In the next section, we study the folding kinetics for this model.
Figure 6.
Free-energy curves as a function of the folding order parameter Q at the folding temperature Tf and various pressures (in kbar). Notice that as the pressure is increased, ɛ− decreases, and therefore Tf also decreases.
Folding Kinetics.
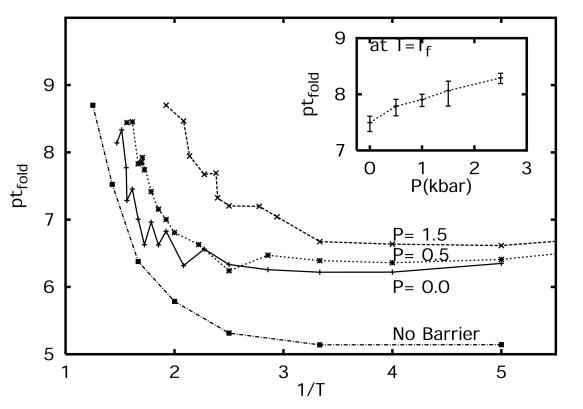
To study the kinetics of folding, a series of simulations were performed over a range of temperatures and pressures. On the order of 10–300 simulations were performed at each temperature and pressure. The simulations were stopped whenever the folded state (Q = 47) was reached. The length of the simulation was then used to calculate the median first passage time (MFPT) of folding. MC runs that did not reach the folded state within 5 × 10⁹ steps where assigned a folding time of 5 × 10⁹. Fig. 7 shows the MFPT at P = 0, 0.5, and 1.5 kbar, as a function of 1/T. The MFPT increases as 1/T is decreased (T increased). However, given the designed minimal frustration in the model, the MFPT does not increase significantly for large 1/T (low T), in contrast to the results described by Socci et al. (21) for the 3LC lattice polymer with Tf/Tg = 1.6. For a wide range of temperatures around Tf, the MFPT at constant T increases as P is increased. This suggests that the apparent activation volume, calculated from the change in folding rate with pressure, is positive. However, given the decrease of the contact minimum in the potential with pressure, the folding temperature also decreases with P. The Inset in Fig. 7 shows the MFPT at Tf(P). Fig. 6 shows that the transition-state energy (ΔG‡) and the transition-state coordinate (Q‡) change with pressure. Different combinations of contacts in the transition state are affected differently at various pressures. As a result, the transition-state energy can both decrease as a function of P (e.g., Q ∼ 22) or increase (e.g., Q ∼ 27) at P between 1.25 and 2.5 kbar. However, the folding-time trend goes opposite to what is suggested by the free-energy curves alone. The increase in roughness in the energy landscape resulting from the desolvation barrier height increases with pressure, resulting in an increase in the folding times, even though the intrinsic thermodynamic free-energy barriers are lower. This apparent discrepancy in folding times can be explained by an analytic energy landscape calculation using the Kramer's kinetics, to be a consequence of the decrease in reconfigurational diffusion of the system. The variation in the chain-reconfigurational diffusion coefficient with pressure is described next.
Figure 7.
MFPT (τf) as a function of 1/T. Time is measured in number of MC steps. (Inset) The MFPT as a function of P at T = Tf. Error bars reflect one SD from block averages.
Reconfigurational Diffusion Coefficient.
We apply Bryngelson–Wolynes (25) diffusive theory of folding for a system with a reasonably unfrustrated energy surface to determine the role of pressure on the chain-reconfigurational diffusion. This follows the applications of this theory to lattice models by Socci et al. (21). Within the quasiharmonic approximation for the free-energy well around the unfolded state, the diffusion coefficient can be approximated by DQ = δQ2/τcorr, where δQ2 is the variance of the reaction coordinate about the unfolded state, and the τcorr is the reaction-coordinate autocorrelation time, defined by limt→∞C(t) ∼ exp(−t/τcorr), where the Q autocorrelation function C(t) is defined by Socci et al. (21).
In our model, the variance of the reaction coordinate about the unfolded state, 〈δQ2〉 and the C(t) are calculated from simulations at T = Tf, and for trajectory segments that only involve the unfolded state (Q ≤ 29). These simulations exhibit multiple folding/unfolding transitions. Block averages over various segments were performed to assess the errors in 〈δQ2〉 and τcorr. The reconfigurational-diffusion coefficient characterizes the average rate of local motion on the landscape and is a function of the native-protein motif and the roughness of the landscape. When the folding landscape is funnel-like and the native state can be reached by a large number of “quasi-equivalent” pathways, the diffusion picture provides a good description of the folding mechanism (21, 26). In this regime, the folding process is exponential in time and the folding bottleneck is to overcome the free-energy barrier. Folding therefore can be described as a diffusive process in an effective potential-energy surface as a function of Q and/or other appropriate reaction coordinates. However, if glassy dynamics are reached and folding becomes controlled by long-lived traps, the folding event becomes nonexponential in time and the diffusive description fails (26).
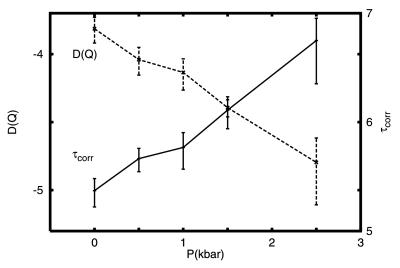
Fig. 8 shows the chain reconfigurational correlation time, and the reconfigurational-diffusion coefficient as functions of pressure. τcorr increases over one order of magnitude over pressure changes in the range of 0–2.5 kbar, indicating that pressure slows the rate of configurational changes. (The slope of this curve cannot be taken as an activation volume because the temperatures are changed to T = Tf for each P.) The variance of the order parameter, 〈δQ2〉 (not shown), increases by a factor of 2 over the same pressure range. The reconfigurational-diffusion coefficient, given by DQ = δQ2/τcorr, decreases by nearly an order of magnitude over the same pressure range, with a slope of 0.8/kbar. The expected slope resulting from a single-pair formation is 0.06/kbar, suggesting that reconfigurational diffusion involves 13 contacts. In experiments on Snase, the slope of the reconfigurational-diffusion coefficient with pressure is 1.7/kbar (2), which is about a factor of 2 larger than the value for our minimalist model of a β-barrel, and a factor of 28 larger than for a single-pair formation (4). The slopes for our model and Snase are in qualitative agreement. The differences in slope may result from different number of contacts in the transition state that are affected by pressure. The largest protein shows the larger slope in the pressure dependence of the reconfigurational-diffusion coefficient. Our results suggest that the slope of the reconfigurational-diffusion coefficient depends on the degree of cooperativity imposed by the presence of the desolvation barrier. Therefore, it is expected that different proteins may show variations for the change of reconfigurational-diffusion coefficient with pressure.
Figure 8.
Pressure dependence of the chain-reconfigurational correlation time, τcorr (right side axis); and the reconfigurational-diffusion coefficient, D(Q) (left side axis), for the β-barrel minimalist model.
Within the diffusive theory of folding (25), the folding time is given by:
 |
1 |
where F(Q) is the PMF shown in Fig. 4. In this equation, we included the possibility of the reconfigurational-diffusion coefficient varying with Q. However, in our calculations, we use a constant value for the reconfigurational-diffusion coefficient. Therefore, the equation above can be written in the following discrete form:
 |
2 |
The MFPT calculated from the MC simulations are compared with the folding times calculated from the discrete double integral in Table 1. The agreement between the Kramer-like model and the simulation results is outstanding. From Table 1, we observe that Dτf shows a decrease, followed by an increase with increasing pressure, as expected from F(Q) curves. However, it is clear that the major effect of pressure is in changing the roughness of the landscape and not the free-energy profile. For this reason, the effects of pressure can be mostly described in terms of variations of the reconfigurational-diffusion coefficient. It is clear that τf, obtained after accounting for the changes in reconfigurational-diffusion coefficient, increases with pressure. The values of the MFPT obtained from the MC and the discrete integral form in Eq. 2 differ by at most a factor of 4, perhaps reflecting topological restriction, thus justifying the use of the native-contact number as an order parameter for the folding reaction. From this calculation, we show that the main effect of pressure on the folding rates is to decrease the chain-reconfigurational diffusion, when temperatures are maintained equal to the chain-folding temperatures (i.e., at equal folded-state stabilities).
Table 1.
Folding MFPT From MC and from the energy landscape theory folding times
| P = 0 | P = 0.5 | P = 1.25 | P = 2.5 | |
|---|---|---|---|---|
| Dτf | 1824 | 1774 | 2128 | ND |
| D | 15 × 10−5 | 9 × 10⁻⁵ | 6 × 10⁻⁵ | 1.6 × 10⁻⁵ |
| τf | 1.2 × 10⁷ | 2 × 10⁷ | 3.5 × 10⁷ | ND |
| τMC | 6 × 10⁷ | 8 × 10⁷ | 9 × 10⁷ | 1.7 × 10⁸ |
ND, not determined.
Conclusions
We have presented a minimalist model of a β-barrel protein that describes the effect of pressure on the transition state and kinetics of proteins. In agreement with observed experimental data on Snase (2), we observe that pressure increases the roughness of the energy landscape, thus increasing the pressure-unfolding transition times. We can trace the slow-down of the reaction as a consequence of the increase in desolvation barrier shown in the pair PMF of hydrophobic groups in water as a function of pressure. Although we cannot map our results to the time scale or the physical system (i.e., Snase vs. a β-barrel), our results suggest that water penetration into the hydrophobic core of a protein is involved in pressure-induced protein denaturation. Nevertheless, the process is well described by a protein configuration-dependent reaction coordinate.
Pressure perturbs the equilibrium distribution of states contributing to the transition state. As a result, pressure may increase or decrease the folding rates of proteins. Our results show a lowering of the transition-state energy with pressure, but, in our minimalist model, the decrease in the reconfigurational diffusion dominate easily a reduction in the transition-state free energy.
Acknowledgments
We thank Shekhar Garde, Gerhard Hummer, Hugh Nymeyer, Cathy Royer, Nick Socci, and Peter G. Wolynes for helpful discussions. This work was supported by the Los Alamos/University of California Directed Research and Development funds, and by the National Science Foundation (Grant MCB-9603839). N.H. is an Undergraduate Research Student at Los Alamos National Laboratory.
Abbreviations
- PMF
potential of mean force
- Snase
staphylococcal nuclease
- MFPT
median first passage time
- MC
Monte Carlo
Footnotes
This paper was submitted directly (Track II) to the PNAS office.
References
- 1.Vidugiris G J A, Markley J L, Royer C A. Biochemistry. 1995;34:4909–4912. doi: 10.1021/bi00015a001. [DOI] [PubMed] [Google Scholar]
- 2.Frye K J, Royer C A. Protein Sci. 1997;6:789–793. doi: 10.1002/pro.5560060405. [DOI] [PMC free article] [PubMed] [Google Scholar]
- 3.Panick G, Malessa R, Winter R, Rapp G, Frye K J, Royer C A. J Mol Biol. 1998;275:389–402. doi: 10.1006/jmbi.1997.1454. [DOI] [PubMed] [Google Scholar]
- 4.Hummer G, Garde S, García A E, Paulaitis M E, Pratt L R. Proc Natl Acad Sci USA. 1998;95:1552–1555. doi: 10.1073/pnas.95.4.1552. [DOI] [PMC free article] [PubMed] [Google Scholar]
- 5.Desai G, Panick G, Zein M, Winter R, Royer C A. J Mol Biol. 1999;288:461–475. doi: 10.1006/jmbi.1999.2692. [DOI] [PubMed] [Google Scholar]
- 6.Mohana-Borges R, Silva J, Ruiz-Sanz J, de Prat-Gay G. Proc Natl Acad Sci USA. 1999;96:7888–7893. doi: 10.1073/pnas.96.14.7888. [DOI] [PMC free article] [PubMed] [Google Scholar]
- 7.Kundrot C E, Richards F M. J Mol Biol. 1987;193:157–170. doi: 10.1016/0022-2836(87)90634-6. [DOI] [PubMed] [Google Scholar]
- 8.Kundrot C E, Richards F M. J Mol Biol. 1988;200:401–410. doi: 10.1016/0022-2836(88)90249-5. [DOI] [PubMed] [Google Scholar]
- 9.Kitchen D B, Reed L H, Levy R M. Biochemistry. 1992;31:10083–10093. doi: 10.1021/bi00156a031. [DOI] [PubMed] [Google Scholar]
- 10.Cook R L, King H, Jr, Peiffer D G. Phys Rev Lett. 1992;69:3072–3075. doi: 10.1103/PhysRevLett.69.3072. [DOI] [PubMed] [Google Scholar]
- 11.Root L, Berne B. J Chem Phys. 1997;107:4350–4357. [Google Scholar]
- 12.Kauzmann W. Nature (London) 1987;325:763–764. [Google Scholar]
- 13.Hummer G, Garde S, García A E, Pohorille A, Pratt L R. Proc Natl Acad Sci USA. 1996;93:8951–8955. doi: 10.1073/pnas.93.17.8951. [DOI] [PMC free article] [PubMed] [Google Scholar]
- 14.Hummer G, Garde S, García A E, Paulaitis M E, Pratt L R. J Phys Chem B. 1998;102:10469–10482. [Google Scholar]
- 15.Lum K, Chandler D, Weeks J. J Phys Chem B. 1999;103:4570–4577. [Google Scholar]
- 16.Wallqvist A. Chem Phys Lett. 1991;182:237–241. [Google Scholar]
- 17.Guo Z, Thirumalai D, Honeycutt J D. J Chem Phys. 1992;97:525–535. [Google Scholar]
- 18.Nymeyer H, García A E, Onuchic J N. Proc Natl Acad Sci USA. 1998;95:5921–5928. doi: 10.1073/pnas.95.11.5921. [DOI] [PMC free article] [PubMed] [Google Scholar]
- 19.Guo Z Y, Brooks C L., III Biopolymers. 1997;42:745–757. doi: 10.1002/(sici)1097-0282(199712)42:7<745::aid-bip1>3.0.co;2-t. [DOI] [PubMed] [Google Scholar]
- 20.Chan H C, Dill K A. Macromolecules. 1989;22:4559–4573. [Google Scholar]
- 21.Socci N D, Onuchic J N, Wolynes P G. J Chem Phys. 1996;104:5860–5868. [Google Scholar]
- 22.Nelson E D, Onuchic J N. Proc Natl Acad Sci USA. 1998;95:10682–10686. doi: 10.1073/pnas.95.18.10682. [DOI] [PMC free article] [PubMed] [Google Scholar]
- 23.Zhou Y, Hall C, Karplus M. Phys Rev Lett. 1996;77:2822–2825. doi: 10.1103/PhysRevLett.77.2822. [DOI] [PubMed] [Google Scholar]
- 24.Privalov P L. Crit Rev Biochem Mol Biol. 1990;25:281–305. doi: 10.3109/10409239009090612. [DOI] [PubMed] [Google Scholar]
- 25.Bryngelson J D, Wolynes P G. J Phys Chem. 1989;93:6902–6915. [Google Scholar]
- 26.Socci N D, Onuchic J N, Wolynes P G. Proteins Struct Funct Genet. 1998;32:136–158. [PubMed] [Google Scholar]


