

Abstract
To assess the condition of the retina in children with retinal degeneration due to Bardet-Biedl Syndrome (BBS, n= 41), Leber congenital amaurosis (LCA, n= 31), or Usher syndrome (USH, n=13), the dark adapted visual threshold (DAT) and arteriolar diameters were measured. Compared to controls, the initial DATs of nearly all (83/85) were significantly elevated, and in 26/62 with serial DATs, significant progressive elevation occurred. Arteriolar diameters were significantly attenuated and narrowed with age in BBS and USH, but not LCA. Higher DATs were associated with narrower arterioles. Such non-invasive procedures can document the natural history of these retinal diseases and have the potential to assess response to future treatment.
The retinal degenerations of Bardet-Biedl syndrome (BBS), Leber congenital amaurosis (LCA), and Usher syndrome (USH) present to the clinician in infancy and early childhood because of conspicuous visual deficits or systemic features. Marked visual impairment at an early age is the hallmark of disorders within the spectrum of LCA. In Bardet-Biedl syndrome, polydactyly, obesity, and genitourinary anomalies are non-ocular features that may bring the child to the physician even if the retinal degeneration has not yet caused visual symptoms. Deafness, problems with balance, and delayed walking call attention to the more common forms of Usher syndrome. With realistic possibilities for novel treatments of these blinding conditions on the horizon (http://www.visionresearch-conference.elsevier.com/index.htm), measurements that can be used to quantify the natural course of these retinal degenerations during childhood and measure outcome of treatments are needed.
In the retina, the mutations causing BBS, LCA, and USH, primarily effect the photoreceptors, pigment epithelial cells, or both (Katsanis, 2004; Koenekoop, 2004; Kremer, van Wijk, Marker, Wolfrum & Roepman, 2006; Lotery, Jacobson, Fishman, Weleber, Fulton, Namperumalsamy, Heon, Levin, Grover, Rosenow, Kopp, Sheffield & Stone, 2001; Morimura, Fishman, Grover, Fulton, Berson & Dryja, 1998; Mykytyn, Nishimura, Searby, Shastri, Yen, Beck, Braun, Streb, Cornier, Cox, Fulton, Carmi, Luleci, Chandrasekharappa, Collins, Jacobson, Heckenlively, Weleber, Stone & Sheffield, 2002; Nishimura, Searby, Carmi, Elbedour, Van Maldergem, Fulton, Lam, Powell, Swiderski, Bugge, Haider, Kwitek-Black, Ying, Duhl, Gorman, Heon, Iannaccone, Bonneau, Biesecker, Jacobson, Stone & Sheffield, 2001; Reiners, Nagel-Wolfrum, Jurgens, Marker & Wolfrum, 2006). Electroretinographic (ERG) activity, which is very sensitive to dysfunction of photoreceptors, is often used to diagnose retinal degeneration, and has a place as an outcome measure in trials of experimental therapies (Fishman, Jacobson, Alexander, Cideciyan, Birch, Weleber & Hood, 2005). However, at the time of diagnosis, ERG activity in some of the early onset retinal degenerations is markedly compromised and may even be non-detectable. This is typical in LCA and not uncommon in BBS and USH. Thus, ERG monitoring of the natural course of these degenerations may be problematic. Furthermore, other outcome measures such as perimetry and tests of dark adapted visual thresholds usually depend on the performance of instructable subjects (Roman, Schwartz, Aleman, Cideciyan, Chico, Windsor, Gardner, Ying, Smilko, Maguire & Jacobson, 2005).
Measurement of the dark adapted visual threshold (DAT) using a preferential looking procedure has been used for several decades to obtain reliable and valid measurements in infants and young children with retinal degeneration (Fulton & Hansen, 1983a; Fulton & Hansen, 1983b; Fulton, Hansen & Glynn, 1993; Fulton, Hansen & Mayer, 1996). The DAT depends primarily on photon capture by the photoreceptors as well as post-receptor processes, and often DATs are readily measurable even if ERG responses are markedly attenuated (Fulton & Hansen, 1983a; Fulton & Hansen, 1983b).
The caliber of the retinal arterioles is an indicator of the overall metabolic status of the retina (Grunwald, Maguire & Dupont, 1996; Penn, Li & Naash, 2000). In advanced retinal degeneration, the metabolic activity of the retina is low and the retinal arterioles are very thin. Herein, we have used image analysis (Martinez-Perez, 2001; Martinez-Perez, Hughes, Stanton, Thom, Chapman, Bharath & Parker, 2002; Martinez-Perez, Hughes, Thom, Bharath & Parker, 2007) to measure the diameter of the retinal arterioles in the fundus photographs of children with BBS, LCA, and USH. Our purpose is to demonstrate the feasibility of monitoring the natural course of retinal degenerative conditions even during early childhood.
METHODS
Subjects
Eighty-five subjects were studied. Across all groups (BBS, LCA, USH) the median age at the first DAT was 5 years (range: 2 months to 26 years). Of the 85 subjects, 23 had only one DAT (BBS, 7; LCA, 9; USH, 7). In the LCA group, 3 had no light perception (NLP) at the first visit (Fulton et al., 1996). The other 62 had, on average, 4 (range: 2 to 15) DATs spanning one to 18 years. Among those with two or more measures, 42/62 had DATs followed for at least 4 years (BBS 26/34, LCA 14/22 USH 2/6).
As the molecular bases for each of these conditions were discovered, DNA testing was offered; mutations were identified in 25 subjects. In subjects without mutations, the diagnosis was secured by clinical criteria. In addition to retinal degeneration, those children with BBS displayed at least two of the other four cardinal features of the syndrome: polydactyly, obesity, genitourinary anomalies, and cognitive disability. Children with LCA but without molecular diagnosis were included only if there was a documented history of visual impairment in infancy, marked attenuation of ERG responses, and the absence of systemic abnormalities; each was free of developmental issues beyond early delays that were judged attributable to marked visual impairment. In addition to signs of retinal degeneration, children with USH had hearing impairment documented in infancy, and most reported clumsiness and delayed walking. This study was approved by the Children’s Hospital Committee on Clinical Investigation and adhered to the tenets of the Declaration of Helsinki.
Dark adapted threshold
Stimuli
Two 500 Watt tungsten sources (Sylvania DAY/DAK, 3200 K) were used to present 50 ms duration, short wavelength (Wratten 47B, λ < 510 nm), 10° diameter spots on a rear projection screen. Stimuli were presented either 20° to the right or left of a central, 30 min arc diameter red fixation light flickering at approximately 1 Hz (Fulton & Hansen, 2000; Hansen, Fulton & Harris, 1986). Stimulus intensity was controlled by calibrated neutral density filters. Calculation of the scotopic troland value of the stimuli was based on the subject’s measured pupillary diameter and luminance measurements made with a calibrated photodiode and scotopic filter (IL 1700, International Light, Newburyport, MA) placed at the position of the subject’s eyes.
Procedure
Thresholds were determined using a two-alternative, forced-choice method. A “fix and then flash” procedure, which allowed stimulus location on the retina to be specified, was used (Fulton & Hansen, 2000; Hansen et al., 1986; Schneck, Hamer, Packer & Teller, 1984). The results of control experiments in adults indicated that the observer could reliably detect a horizontal deviation of 2° or more from the fixation target (Hansen & Fulton, 1995). After 30 minutes of dark adaptation, the subject sat, or was held by a parent, 50 cm from the rear projection screen and viewed the screen binocularly. In these subjects, the retinal disease was symmetrical; ophthalmoscopic appearance of the retinas and ERG results were similar for right and left eye.
The fixation target attracted the subject’s gaze to the center of the screen. A second adult, the observer, used an infrared viewer to watch the subject. When the observer reported that the subject was alert and looking at the center, the experimenter extinguished the fixation light and presented a test flash. The observer was unaware of the right-left position of the test flash. Based on the subject’s head and eye movements, the observer reported stimulus location, right or left, and received feedback from the experimenter after each response. Older children pointed to the stimulus, right or left, and received feedback after each response. Thresholds were determined using a transformed up-down staircase that estimated the 70.7% correct point on the psychometric function (Wetherill & Levitt, 1965). In normal subjects (n = 26; median 21 years; range 18 to 43 years) the mean threshold is −3.9 (SD = 0.12) log scotopic troland seconds (Fulton & Hansen, 2000). Thresholds obtained using the rapid staircase procedure agree well with those obtained using the more rigorous method of constant stimuli (Fulton & Hansen, 1991).
Arteriolar diameter
Thirty-seven of the 85 subjects had fundus photographs taken using the IMAGEnet 2000 LITE R-2.09 Digital Imaging System (Topcon Corporation, Tokyo, Japan) at a resolution of 3008 × 2000 pixels. Peripapillary arteriolar diameter was calculated using Retinal Image multiScale Analysis 4 (RISA) (Gelman, Martinez-Perez, Vanderveen, Moskowitz & Fulton, 2005; Martinez-Perez et al., 2002; Martinez-Perez et al., 2007). Photographs of 20 healthy control subjects (median age 24 years; range 7 to 66 years) were also obtained and analyzed.
The fundus images of each subject were reviewed and the best quality image showing the optic nerve head and peripapillary retinal vasculature was selected for analysis (Figure 1A). Radial venules and arterioles were identified, and an arteriole adjacent to the optic nerve head was prepared for analysis. A length of arteriole approximately equal to the diameter of the optic nerve head was cropped (Figure 1B). The following steps of RISA were performed: segmentation, skeleton extraction, selection of vessel root, and tracking (Gelman et al., 2005; Martinez-Perez et al., 2002; Martinez-Perez et al., 2007). Diameter is the total area of the cropped vessel divided by its length. One to 3 (median 2) arterioles were analyzed for each image, and the average diameter (pixels) was determined.
Figure 1.
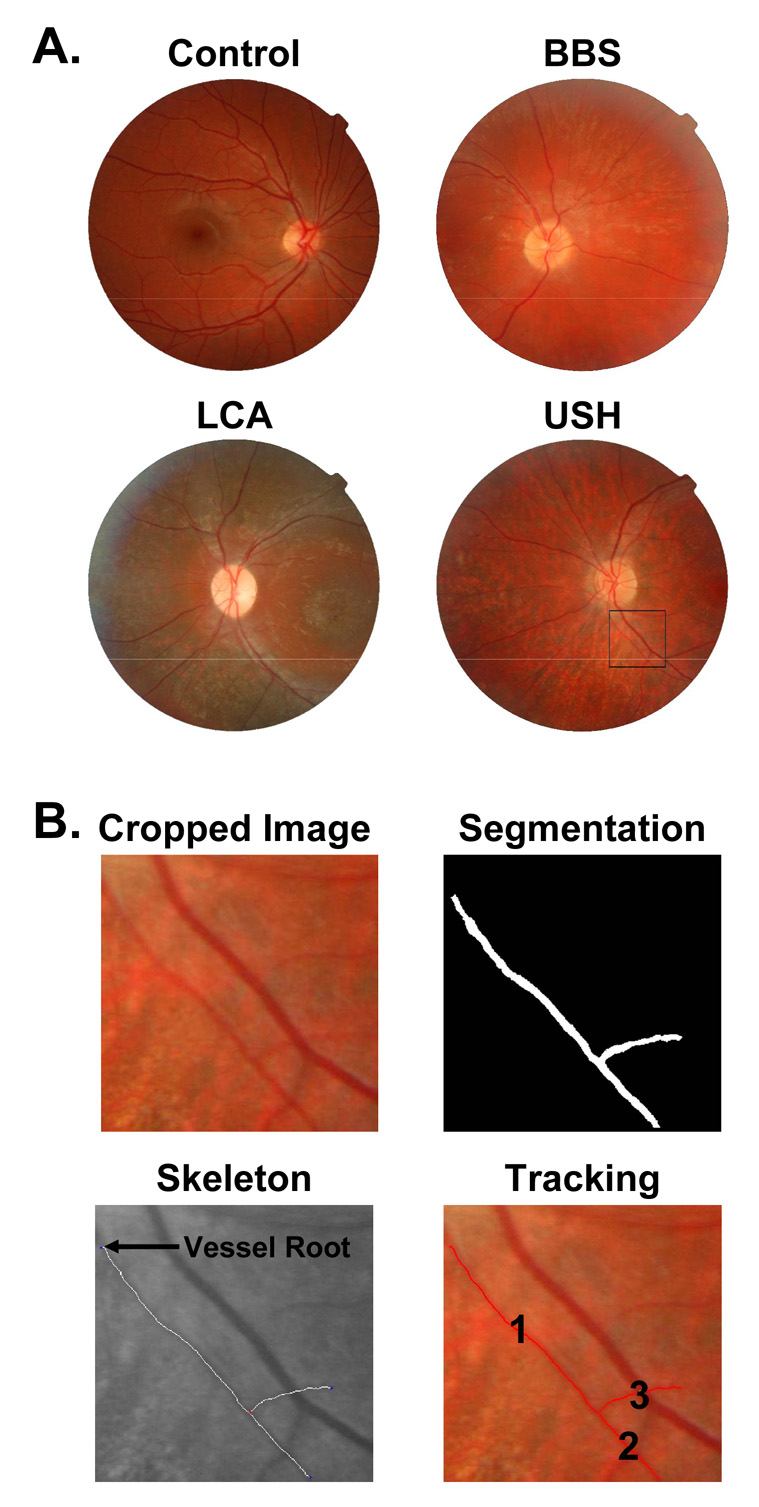
Sample digital fundus photographs and steps in RISA. A. Sample images from a control subject and subjects with BBS, LCA, and USH are shown. An arteriole from the USH image is selected for analysis (square). B. The cropped image is segmented, skeleton extracted, vessel root identified (arrow), and the vessel tracked and measured. The diameter of the measured segments 1 and 2 is 41% of the control mean.
On these images, the horizontal and vertical diameter (pixels) of the optic nerve head were measured and averaged. Arteriolar diameter was expressed as a proportion of diameter of the optic nerve head and converted to microns assuming that the average diameter of the optic nerve is 1800 µm (Cheung, Islam, Saw, Shankar, de Haseth, Mitchell & Wong, 2007; Hellstrom & Svensson, 1998).
Statistical analysis
The initial thresholds of the BBS, LCA, and USH subjects were compared to the prediction interval derived from previously reported thresholds in healthy controls (Fulton & Hansen, 2000). The prediction interval gives the values expected in the normal population (Whitmore, 1986). Threshold elevation and arteriolar diameter of BBS, LCA, USH, and control groups were compared using analysis of variance.
To determine whether an individual’s thresholds changed, we calculated the variability of thresholds following the method of Berson et al. (Berson, Sandberg, Rosner, Birch & Hanson, 1985). In this sample, nineteen subjects with BBS had thresholds measured within a 1 year interval (median 10 months; range: 0.04 to 12 months). The difference between the threshold at first and second visit was calculated. The standard deviation of these difference scores was 0.27 log unit. Thus, the 0.5 and 99.5 percentiles of the distribution of difference scores are (Berson et al., 1985)
Accordingly, if threshold elevation increased by 0.98 log unit or more, the patient’s disease was said to be progressing (Fulton et al., 1993).
Test-retest reliability for the DAT was evaluated for 23 subjects in the present sample. The intraclass correlation coefficient was 0.96. Eight healthy controls (median age 28 years; range 17 to 66 years) had TopCon photographs taken and a second TopCon photograph taken within a week of the first. Test-retest reliability for the arteriolar diameters derived from TopCon photographs was 0.97 (intraclass correlation).
The data were analyzed using SPSS 14.0 for Windows (SPSS Inc., Chicago, Illinois).
RESULTS
The initial thresholds in nearly all subjects with BBS, LCA, and USH were elevated above the normal mean (Figure 2); only two subjects with retinal degenerations had initial thresholds within the 99% prediction interval for normal. The thresholds of the subjects with retinal degenerations differed significantly from those in normal controls (F = 32.7; df 3,104; p<0.001). The initial threshold elevation did not vary significantly with category of retinal degeneration (Tukey HSD). The greater the age the greater the threshold elevation in BBS subjects (r=0.56; p<0.01); the BBS subjects had the largest span of age at the first DAT. Among the LCA and USH groups, initial threshold elevation did not vary significantly with age.
Figure 2.
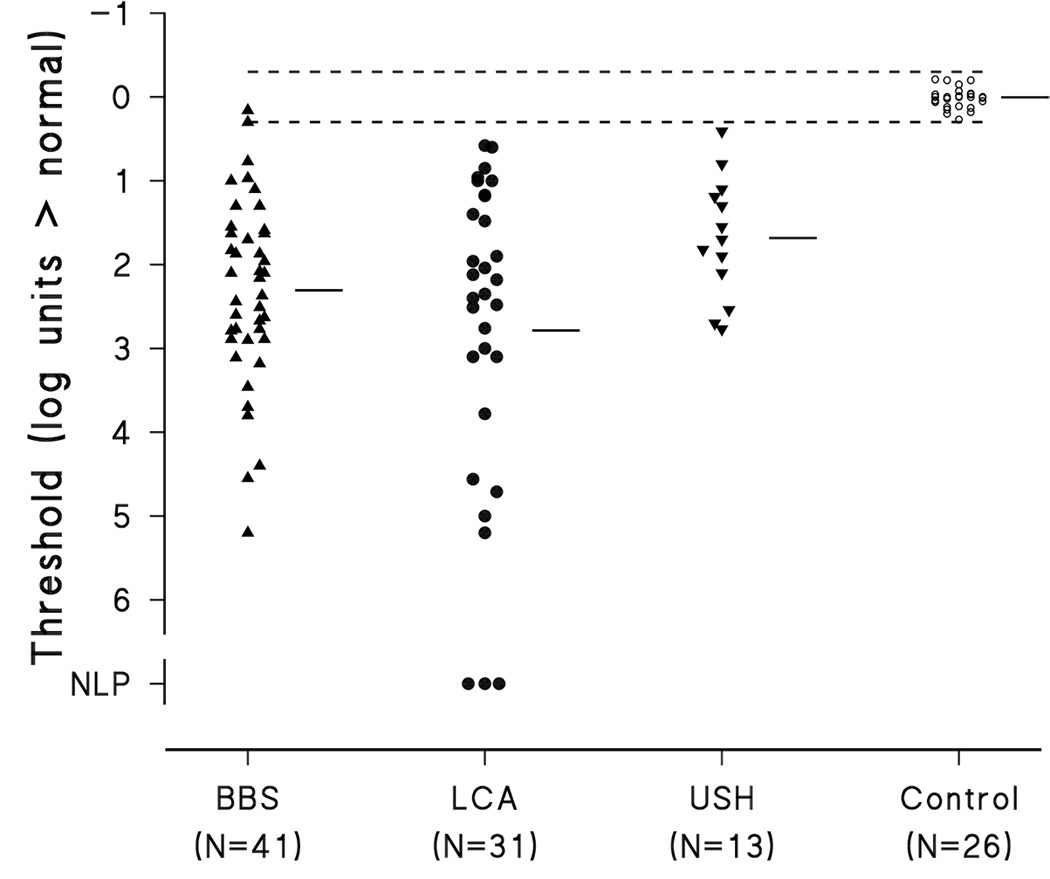
Elevation of the initial dark adapted threshold above the normal mean threshold for subjects with BBS, LCA, and USH. Each patient’s DAT is represented by the closed symbols. The short horizontal bars are the mean for each group. The small open circles represent the thresholds of 26 normal control subjects. The normal mean threshold at zero corresponds to −3.9 log scotopic troland seconds (Fulton & Hansen, 2000). The dashed lines represent the upper and lower limits of the 99% prediction interval for normal DAT.
Figure 3 shows dark adapted thresholds for each diagnostic group as a function of age. Some subjects with BBS and LCA had progressive elevation of threshold; that is, threshold elevation increased by more than 0.98 log unit. Among all BBS subjects with longitudinal DATs (n = 34), 18 had progressive elevation of the DAT during the period of observation. In most, the progression occurred within a period of four years. Although all subjects with LCA had thresholds outside the normal interval at the first test, only 8 of 22 with longitudinal data showed significant progression. With the exception of one subject who was unavailable for testing between ages 4 and 11 years, LCA progression occurred within a period of 4 years. All of the USH subjects (n = 13) had significant threshold elevation at the first test, but none had significant worsening of threshold.
Figure 3.
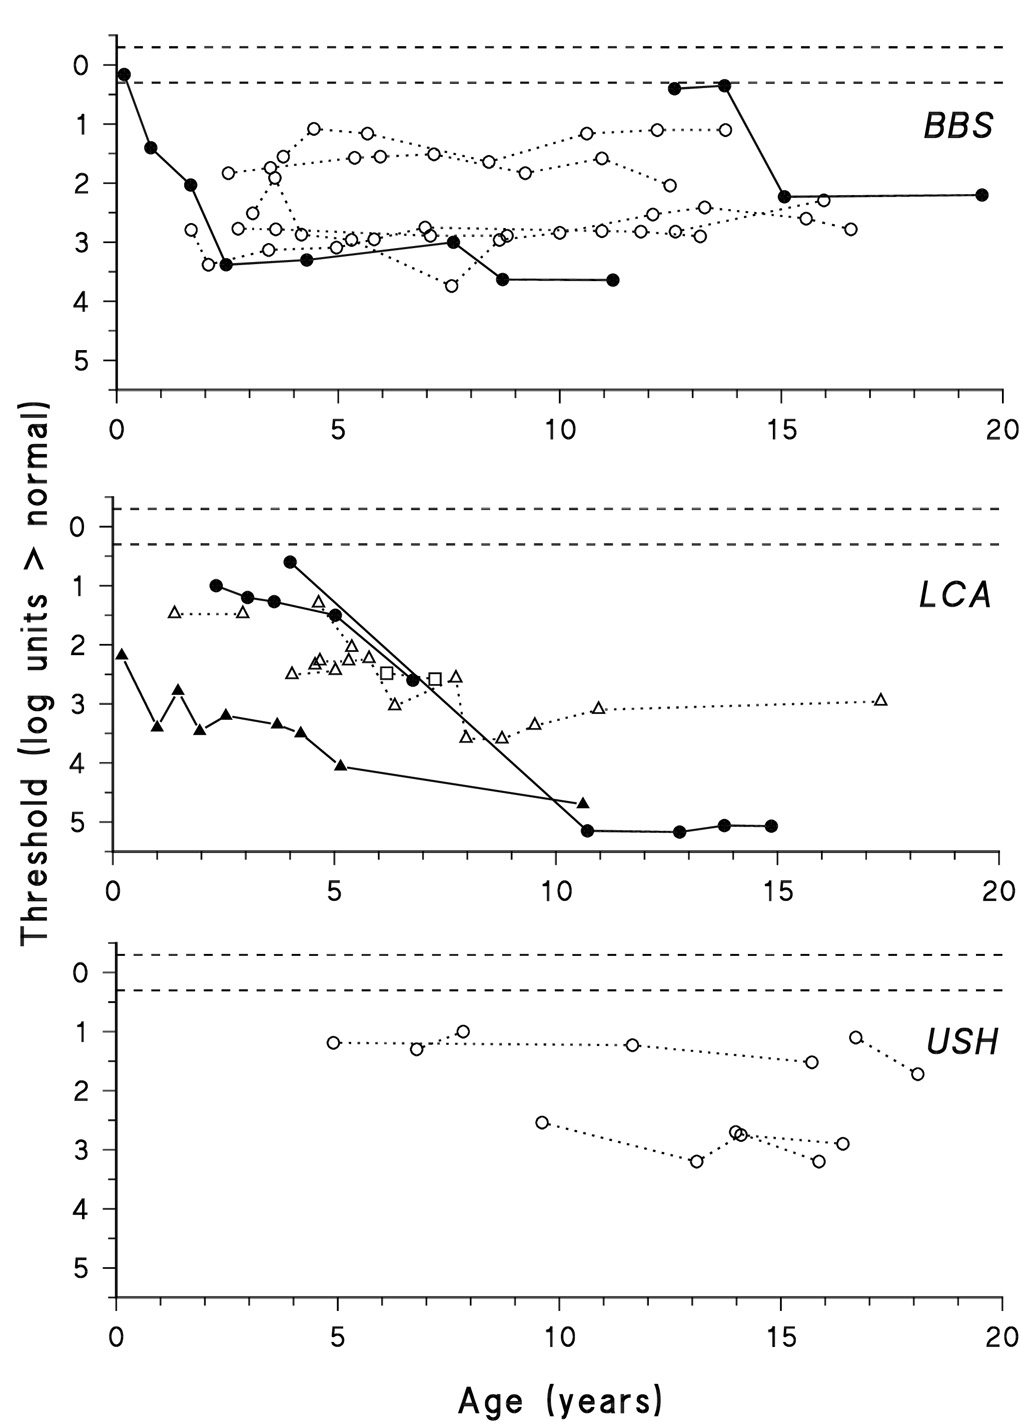
Dark adapted threshold as a function of age for subjects with BBS (upper panel), LCA (middle panel), and USH (lower panel). Thresholds from individuals are connected by line segments. Subjects who progressed, that is had significant worsening of retinal function, are represented by filled symbols and solid line segments. Subjects who did not progress are represented by open symbols and dotted lines. Three early thresholds, up to age 2 years, in a patient with LCA were reported previously (Fulton et al., 1996). The mutations of LCA subjects are indicated: CRB1 (triangles), RPE65 (circles), and RPGRIP (squares). The horizontal dashed lines represent the upper and lower limits of the 99% prediction interval for normal dark adapted thresholds. Zero on the Y-axis corresponds to the average dark adapted threshold of 26 normal control subjects (−3.9 log scotopic troland seconds).
Arteriolar diameters of the diagnostic groups (BBS, LCA, USH) and controls are compared in Figure 4. All but two subjects with retinal degenerations have arteriolar diameter less than the normal mean. Six have diameters below the 99% prediction interval for normal (Figure 4).
Figure 4.
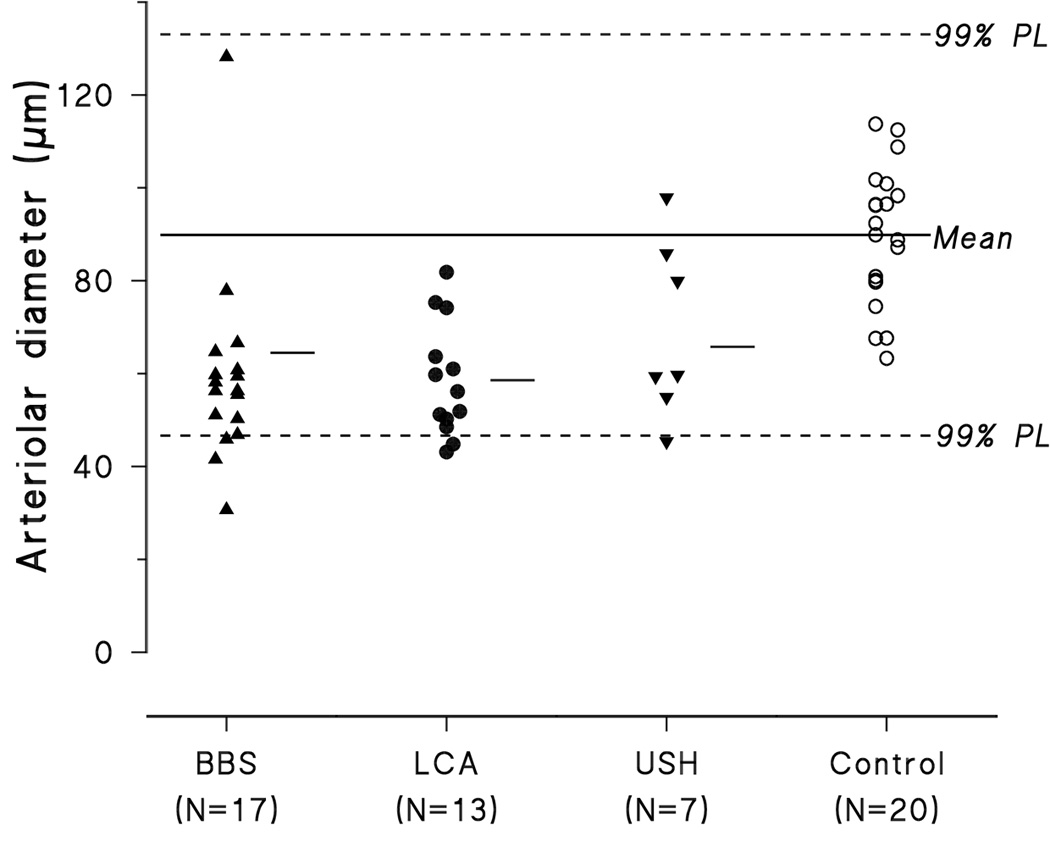
Arteriolar diameter of subjects with BBS, LCA, USH, and normal control subjects. Mean arteriolar diameter of each group is represented by the short horizontal line. The solid line is the mean value for the 20 control subjects; the horizontal dashed lines represent the upper and lower limits of the 99% prediction limit of normal. Assuming that the average diameter of the optic nerve is 1800 µm (Cheung et al., 2007; Hellstrom & Svensson, 1998), the mean arteriolar diameter of controls is 90 µm.
Analysis of variance showed arteriolar diameter in subjects with retinal degeneration is significantly narrower than in controls (F=16.1; df 3, 59; p<0.001), but does not vary with patient group, BBS, LCA, or USH (Tukey HSD). The greater the age, the narrower the arteriolar diameter in subjects with USH (r=0.91; df 5; p<0.01) and in subjects with BBS (r=0.45; df 16; p<0.05). Among subjects with LCA arteriolar diameter did not vary significantly with age.
Thirty-six subjects with retinal degeneration had DAT and fundus images recorded within a year of each other. As shown in Figure 5, higher threshold elevations were significantly associated with narrower arterioles (r = −0.404, df 35, p<0.05).
Figure 5.
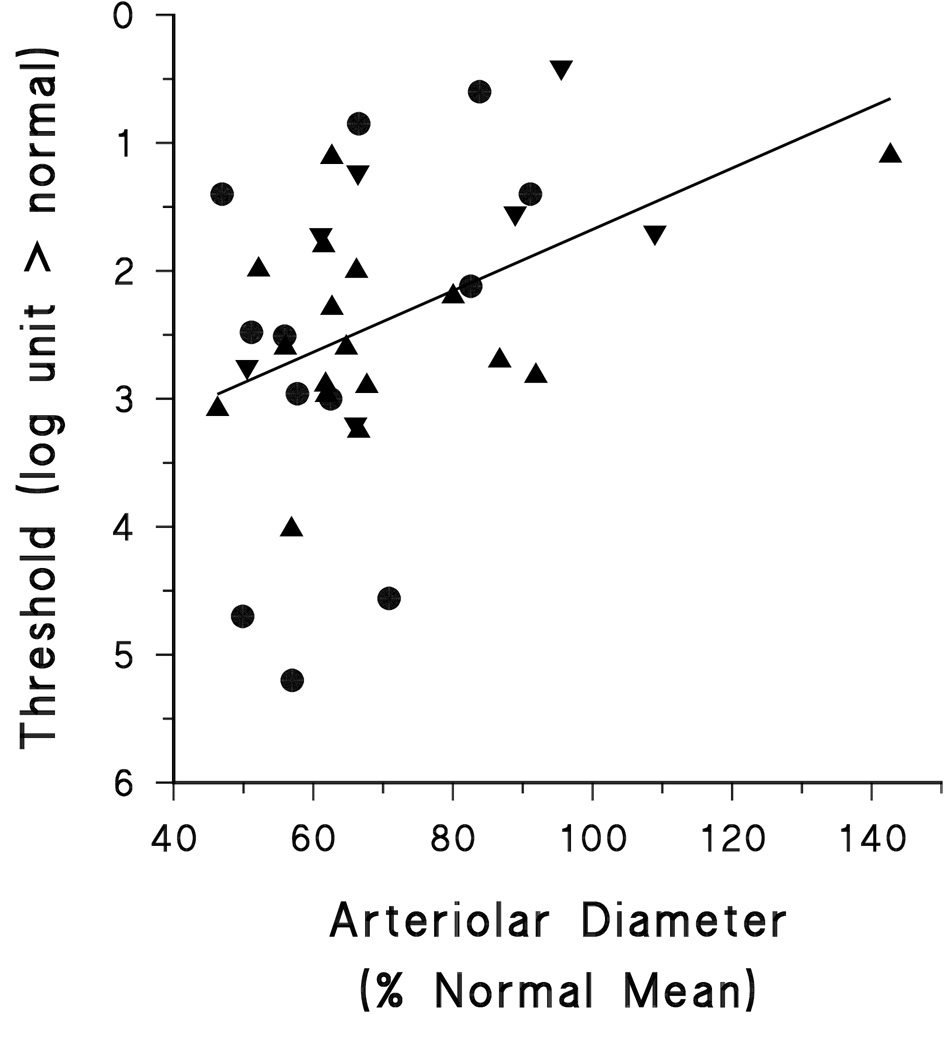
Threshold as a function of arteriolar diameter. Arteriolar diameter is expressed as percent normal. Subjects with BBS, LCA, and USH are represented by different symbols.
DISCUSSION
In these children with retinal degeneration, the dark adapted visual thresholds and arteriolar diameters differed significantly from those in healthy controls, but the magnitude of the abnormality did not vary with diagnosis, Bardet-Biedl syndrome, Leber Congenital Amaurosis, or Usher Syndrome (Figure 2, Figure 4). In BBS, the threshold elevation increased with age. In BBS and USH, arteriolar diameter decreased with age. Across all three groups (BBS, LCA, USH) threshold elevation and arteriolar diameter were significantly associated. In BBS and LCA, significant progression was demonstrated in a substantial portion of the subjects who had longitudinal threshold data. Thus, the dark adapted threshold and arteriolar diameter should be considered feasible and valid for assessment of the status of the retina in children with retinal degeneration.
The determination of progression, or lack of progression, was limited by the paucity of observations in infancy and lack of follow up into adulthood. As illustrated by the examples in Figure 3, progressive threshold elevation occured in infancy and early childhood in some individuals with BBS and LCA (Fulton et al., 1993; Fulton et al., 1996). It could not be determined from the data whether those with BBS and USH who were stable from childhood into adolescence (Figure 3) had experienced rapid, unobserved progression in infancy, or if they would suffer further decline as they approached adulthood, as has been reported in other patients with these diagnoses (Fulton et al., 1993; Fulton et al., 1996; Galvin, Fishman, Stone & Koenekoop, 2005). Rapid progression in infancy would motivate early treatment in an attempt to preserve as much retinal function as possible. The period of relative stability (Figure 3) of 1 to 3 log unit threshold elevation could be viewed as a “window of opportunity” before further worsening of retinal function. It is also important to note that the period of stability (Figure 3) was naturally occurring, without any intervention, and thus is important to distinguish from therapy induced stabilization of a disease process.
The thresholds register function of photoreceptor and post-receptor retinal cells in selected, small patches of retina. All conditions under study, BBS, LCA, USH, cause degeneration of the photoreceptors. Thus, as the photoreceptor disease progresses one might presume that photon capture is reduced, which contributes to the observed elevation of the thresholds. Additionally, when the photoreceptors’ inputs to the post-receptor cells are altered, consequent reorganization of the post-receptoral retina will occur (Jones & Marc, 2005). Based on observations of acute desferoxamine toxicity on rods and post-receptor retina, the reorganizing response of the inner retina takes place over months (Lu, Hansen, Cunningham, Eklund & Fulton, In press.). This reorganization may temper the progressive elevation of the dark adapted threshold, as it did in the patient with acute toxicity. Further psychophysical studies of the functional organization of the retinas in these subjects with markedly attenuated ERG responses could be informative as they have been in the common forms of retinitis pigmentosa (Alexander, Derlacki, Fishman & Peachey, 1991; Hood & Greenstein, 1990; Jacobson, Cideciyan, Iannaccone, Weleber, Fishman, Maguire, Affatigato, Bennett, Pierce, Danciger, Farber & Stone, 2000).
Mechanisms that may lead to attenuation of the retinal vasculature include thickening of the extra-cellular matrix around the retinal vessels, waning oxygen demands of degenerating photoreceptors, and decreasing distance of the retinal vasculature from the swift-flowing choroidal circulation. The latter would result in relative hyperoxia of residual retinal tissue which, through auto-regulation, would lead to decreases in the caliber of the retinal vessels (Grunwald et al., 1996; Penn et al., 2000). These mechanisms are not mutually exclusive. Our data do not distinguish which of these mechanisms, if any, were operative in the children with retinal degeneration. It may well be that each mechanism has some role in determining the diameter of the retinal arterioles. It has been demonstrated that the retinal vasculature of patients with retinitis pigmentosa auto-regulates, at least in response to ambient hyperoxia (Grunwald et al., 1996). In a mouse model of dominant retinitis pigmentosa, the vascular attenuation was reversed by exposure to ambient hypoxia (Penn et al., 2000). We comment that abnormal pigmentation was sparse in many of the children’s retinas and thus a cuff of pigmented extracellular matrix around the retinal vessels, as seen in a mouse model of dominant retinitis pigmentosa (Penn et al., 2000), may not be an important mechanism for narrowing of the children’s retinal vasculature.
Because arteriolar narrowing increased with age in BBS and USH, mechanisms that involve progressive compromise of neural structure and function, both receptor and post-receptor, appear plausible. Arteriolar diameters of the subjects with LCA had no significant decrease with age, but the age range over which these observations were made was shorter than in those with BBS and USH.
To our knowledge, the present study is the first quantitative analysis of retinal vasculature in children with retinal degenerations. The prediction interval for normal arteriolar diameter is large (Figure 4), and will limit the accuracy of arteriolar diameter as a diagnostic tool. However, as higher resolution images and enhanced software become available, more precise specification of vascular characteristics, even in infants and young children, is anticipated.
The two measures, dark adapted visual threshold, which can be done by a preferential looking method, and arteriolar diameter, are readily obtained in pediatric subjects and thus allow assessment of retinal status even in those instances in which ERG responses are markedly attenuated. For “diagnosis” of progression, or in the future, response to treatment, a combination of tests can improve accuracy of diagnosis (Harper & Reeves, 1999). Perimetry, qualitative appraisal of fundus photographs, and the various psychophysical assessments of visual sensitivity that are possible in instructable subjects may all have their place in some older children with BBS, LCA, and USH. Specialized measurements, such as autofluorescence (Scholl, Chong, Robson, Holder, Moore & Bird, 2004) and OCT (optical coherence tomography), which may be difficult in youngsters with poor vision, have provided important information about the status of the retina in subjects with LCA, and thus may also have their place in the assessment of childhood retinal degenerations.
The dark adapted threshold and arteriolar diameter are two tests that show promise for tracking children’s retinal diseases, and as we look toward the future, monitoring the efficacy of treatment of these diseases.
Footnotes
Publisher's Disclaimer: This is a PDF file of an unedited manuscript that has been accepted for publication. As a service to our customers we are providing this early version of the manuscript. The manuscript will undergo copyediting, typesetting, and review of the resulting proof before it is published in its final citable form. Please note that during the production process errors may be discovered which could affect the content, and all legal disclaimers that apply to the journal pertain.
References
- Alexander KR, Derlacki DJ, Fishman GA, Peachey NS. Acuity-luminance and foveal increment threshold functions in retinitis pigmentosa. Investigative Ophthalmology and Visual Science. 1991;32(5):1446–1454. [PubMed] [Google Scholar]
- Berson EL, Sandberg MA, Rosner B, Birch DG, Hanson AH. Natural course of retinitis pigmentosa over a three-year interval. American Journal of Ophthalmology. 1985;99(3):240–251. doi: 10.1016/0002-9394(85)90351-4. [DOI] [PubMed] [Google Scholar]
- Cheung N, Islam FM, Saw SM, Shankar A, de Haseth K, Mitchell P, Wong TY. Distribution and associations of retinal vascular caliber with ethnicity, gender, and birth parameters in young children. Investigative Ophthalmology and Visual Science. 2007;48(3):1018–1024. doi: 10.1167/iovs.06-0978. [DOI] [PubMed] [Google Scholar]
- Fishman GA, Jacobson SG, Alexander KR, Cideciyan AV, Birch DG, Weleber RG, Hood DC. Outcome measures and their application in clinical trials for retinal degenerative diseases: outline, review, and perspective. Retina. 2005;25(6):772–777. doi: 10.1097/00006982-200509000-00014. [DOI] [PubMed] [Google Scholar]
- Fulton AB, Hansen RM. Retinal adaptation in infants and children with retinal degenerations. Ophthalmic Paediatrics and Genetics. 1983a;2:69. doi: 10.3109/13816818509007855. [DOI] [PubMed] [Google Scholar]
- Fulton AB, Hansen RM. Retinal sensitivity and adaptation in pediatric patients. Behavioural Brain Research. 1983b;10(1):59–70. doi: 10.1016/0166-4328(83)90151-1. [DOI] [PubMed] [Google Scholar]
- Fulton AB, Hansen RM. Testing pediatric patients. In: Heckenlively JR, Arden GB, editors. Principles and practice of clinical electrophysiology of vision. St. Louis: Mosby Year Book, Inc; 1991. pp. 281–282. [Google Scholar]
- Fulton AB, Hansen RM. The development of scotopic sensitivity. Investigative Ophthalmology and Visual Science. 2000;41(6):1588–1596. [PubMed] [Google Scholar]
- Fulton AB, Hansen RM, Glynn RJ. Natural course of visual functions in the Bardet-Biedl syndrome. Archives of Ophthalmology. 1993;111(11):1500–1506. doi: 10.1001/archopht.1993.01090110066026. [DOI] [PubMed] [Google Scholar]
- Fulton AB, Hansen RM, Mayer DL. Vision in Leber congenital amaurosis. Archives of Ophthalmology. 1996;114(6):698–703. doi: 10.1001/archopht.1996.01100130690009. [DOI] [PubMed] [Google Scholar]
- Galvin JA, Fishman GA, Stone EM, Koenekoop RK. Evaluation of genotype-phenotype associations in leber congenital amaurosis. Retina. 2005;25(7):919–929. doi: 10.1097/00006982-200510000-00016. [DOI] [PubMed] [Google Scholar]
- Gelman R, Martinez-Perez ME, Vanderveen DK, Moskowitz A, Fulton AB. Diagnosis of plus disease in retinopathy of prematurity using Retinal Image multiScale Analysis. Investigative Ophthalmology and Visual Science. 2005;46(12):4734–4738. doi: 10.1167/iovs.05-0646. [DOI] [PMC free article] [PubMed] [Google Scholar]
- Grunwald JE, Maguire AM, Dupont J. Retinal hemodynamics in retinitis pigmentosa. American Journal of Ophthalmology. 1996;122(4):502–508. doi: 10.1016/s0002-9394(14)72109-9. [DOI] [PubMed] [Google Scholar]
- Hansen RM, Fulton AB. Dark-adapted thresholds at 10- and 30-deg eccentricities in 10-week-old infants. Visual Neuroscience. 1995;12(3):509–512. doi: 10.1017/s0952523800008415. [DOI] [PubMed] [Google Scholar]
- Hansen RM, Fulton AB, Harris SJ. Background adaptation in human infants. Vision Research. 1986;26(5):771–779. doi: 10.1016/0042-6989(86)90092-1. [DOI] [PubMed] [Google Scholar]
- Harper RA, Reeves BC. Glaucoma screening: the importance of combining test data. Optometry and Vision Science. 1999;76(8):537–543. doi: 10.1097/00006324-199908000-00022. [DOI] [PubMed] [Google Scholar]
- Hellstrom A, Svensson E. Optic disc size and retinal vessel characteristics in healthy children. Acta Ophthalmologica Scandinavica. 1998;76(3):260–267. doi: 10.1034/j.1600-0420.1998.760302.x. [DOI] [PubMed] [Google Scholar]
- Hood DC, Greenstein V. Models of the normal and abnormal rod system. Vision Research. 1990;30(1):51–68. doi: 10.1016/0042-6989(90)90127-7. [DOI] [PubMed] [Google Scholar]
- Jacobson SG, Cideciyan AV, Iannaccone A, Weleber RG, Fishman GA, Maguire AM, Affatigato LM, Bennett J, Pierce EA, Danciger M, Farber DB, Stone EM. Disease expression of RP1 mutations causing autosomal dominant retinitis pigmentosa. Investigative Ophthalmology and Visual Science. 2000;41(7):1898–1908. [PubMed] [Google Scholar]
- Jones BW, Marc RE. Retinal remodeling during retinal degeneration. Experimental Eye Research. 2005;81(2):123–137. doi: 10.1016/j.exer.2005.03.006. [DOI] [PubMed] [Google Scholar]
- Katsanis N. The oligogenic properties of Bardet-Biedl syndrome. Human Molecular Genetics. 2004;13(Spec No 1):R65–R71. doi: 10.1093/hmg/ddh092. [DOI] [PubMed] [Google Scholar]
- Koenekoop RK. An overview of Leber congenital amaurosis: a model to understand human retinal development. Survey of Ophthalmology. 2004;49(4):379–398. doi: 10.1016/j.survophthal.2004.04.003. [DOI] [PubMed] [Google Scholar]
- Kremer H, van Wijk E, Marker T, Wolfrum U, Roepman R. Usher syndrome: molecular links of pathogenesis, proteins and pathways. Human Molecular Genetics. 2006;15(Spec No 2):R262–R270. doi: 10.1093/hmg/ddl205. [DOI] [PubMed] [Google Scholar]
- Lotery AJ, Jacobson SG, Fishman GA, Weleber RG, Fulton AB, Namperumalsamy P, Heon E, Levin AV, Grover S, Rosenow JR, Kopp KK, Sheffield VC, Stone EM. Mutations in the CRB1 gene cause Leber congenital amaurosis. Archives of Ophthalmology. 2001;119(3):415–420. doi: 10.1001/archopht.119.3.415. [DOI] [PubMed] [Google Scholar]
- Lu M, Hansen RM, Cunningham MJ, Eklund SE, Fulton AB. Effects of Desferoxamine (DFO) on Retinal and Visual Function. Archives of Ophthalmology. doi: 10.1001/archopht.125.11.1581. In press. [DOI] [PubMed] [Google Scholar]
- Martinez-Perez ME. Department of Biological and Medical Systems. London: Imperial College; 2001. Computer analysis of the geometry of the retinal vasculature; p. 195. [Google Scholar]
- Martinez-Perez ME, Hughes AD, Stanton AV, Thom SA, Chapman N, Bharath AA, Parker KH. Retinal vascular tree morphology: a semi-automatic quantification. IEEE Transactions on Biomedical Engineering. 2002;49(8):912–917. doi: 10.1109/TBME.2002.800789. [DOI] [PubMed] [Google Scholar]
- Martinez-Perez ME, Hughes AD, Thom SA, Bharath AA, Parker KH. Segmentation of blood vessels from red-free and fluorescein retinal images. Medical Image Analysis. 2007;11(1):47–61. doi: 10.1016/j.media.2006.11.004. [DOI] [PubMed] [Google Scholar]
- Morimura H, Fishman GA, Grover SA, Fulton AB, Berson EL, Dryja TP. Mutations in the RPE65 gene in patients with autosomal recessive retinitis pigmentosa or leber congenital amaurosis. Proceedings of the National Academy of Sciences of the United States of America. 1998;95(6):3088–3093. doi: 10.1073/pnas.95.6.3088. [DOI] [PMC free article] [PubMed] [Google Scholar]
- Mykytyn K, Nishimura DY, Searby CC, Shastri M, Yen HJ, Beck JS, Braun T, Streb LM, Cornier AS, Cox GF, Fulton AB, Carmi R, Luleci G, Chandrasekharappa SC, Collins FS, Jacobson SG, Heckenlively JR, Weleber RG, Stone EM, Sheffield VC. Identification of the gene (BBS1) most commonly involved in Bardet-Biedl syndrome, a complex human obesity syndrome. Nature Genetics. 2002;31(4):435–438. doi: 10.1038/ng935. [DOI] [PubMed] [Google Scholar]
- Nishimura DY, Searby CC, Carmi R, Elbedour K, Van Maldergem L, Fulton AB, Lam BL, Powell BR, Swiderski RE, Bugge KE, Haider NB, Kwitek-Black AE, Ying L, Duhl DM, Gorman SW, Heon E, Iannaccone A, Bonneau D, Biesecker LG, Jacobson SG, Stone EM, Sheffield VC. Positional cloning of a novel gene on chromosome 16q causing Bardet-Biedl syndrome (BBS2) Human Molecular Genetics. 2001;10(8):865–874. doi: 10.1093/hmg/10.8.865. [DOI] [PubMed] [Google Scholar]
- Penn JS, Li S, Naash MI. Ambient hypoxia reverses retinal vascular attenuation in a transgenic mouse model of autosomal dominant retinitis pigmentosa. Investigative Ophthalmology and Visual Science. 2000;41(12):4007–4013. [PubMed] [Google Scholar]
- Reiners J, Nagel-Wolfrum K, Jurgens K, Marker T, Wolfrum U. Molecular basis of human Usher syndrome: deciphering the meshes of the Usher protein network provides insights into the pathomechanisms of the Usher disease. Experimental Eye Research. 2006;83(1):97–119. doi: 10.1016/j.exer.2005.11.010. [DOI] [PubMed] [Google Scholar]
- Roman AJ, Schwartz SB, Aleman TS, Cideciyan AV, Chico JD, Windsor EA, Gardner LM, Ying GS, Smilko EE, Maguire MG, Jacobson SG. Quantifying rod photoreceptor-mediated vision in retinal degenerations: dark-adapted thresholds as outcome measures. Experimental Eye Research. 2005;80(2):259–272. doi: 10.1016/j.exer.2004.09.008. [DOI] [PubMed] [Google Scholar]
- Schneck ME, Hamer RD, Packer OS, Teller DY. Area-threshold relations at controlled retinal locations in 1-month-old infants. Vision Research. 1984;24(12):1753–1763. doi: 10.1016/0042-6989(84)90006-3. [DOI] [PubMed] [Google Scholar]
- Scholl HP, Chong NH, Robson AG, Holder GE, Moore AT, Bird AC. Fundus autofluorescence in patients with leber congenital amaurosis. Investigative Ophthalmology and Visual Science. 2004;45(8):2747–2752. doi: 10.1167/iovs.03-1208. [DOI] [PubMed] [Google Scholar]
- Wetherill GB, Levitt H. Sequential Estimation of Points on a Psychometric Function. British Journal of Mathematical and Statistical Psychology. 1965;18:1–10. doi: 10.1111/j.2044-8317.1965.tb00689.x. [DOI] [PubMed] [Google Scholar]
- Whitmore GA. Prediction limits for a univariate normal observation. The American Statistician. 1986;40:141–143. [Google Scholar]