Summary
E. coliNikR is a homotetrameric Ni2+- and DNA-binding protein that functions as a transcriptional repressor of the NikABCDE nickel permease. The protein is composed of 2 distinct domains. The N-terminal fifty amino acids of each chain forms part of the dimeric ribbon-helix-helix (RHH) domains, a well-studied DNA-binding fold. The eighty-three residue C-terminal nickel-binding domain forms an ACT-fold and contains the tetrameric interface. In this study, we have utilized an equilibrium molecular dynamics (MD) simulation in order to explore the conformational dynamics of the NikR tetramer and determine important residue interactions within and between the RHH and ACT domains to gain insight into the effects of Ni on DNA-binding activity. The molecular simulation data was analyzed using two different correlation measures based on fluctuations in atomic position and non-covalent contacts, together with a clustering algorithm to define groups of residues with similar correlation patterns for both types of correlation measure. Based on these analyses, we have defined a series of residue interrelationships that describe an allosteric communication pathway between the Ni2+ and DNA binding sites, which are separated by 40 Å. Several of the residues identified by our analyses have been previously shown experimentally to be important for NikR function. An additional subset of the identified residues structurally connects the experimentally implicated residues and may help coordinate the allosteric communication between the ACT and RHH domains.
Keywords: allostery, NikR, molecular dynamics, correlations, fluctuations
Introduction
E. coli uses nickel ions under anaerobic conditions for the activity of its Ni-Fe hydrogenase enzymes, where the metal assists in the reversible oxidation of diatomic hydrogen1. The bacterium acquires nickel via the NikABCDE nickel permease2. Excess Ni2+ accumulation by this pathway is controlled in part via transcriptional repression of nikABCDE expression by the nickel-dependent NikR repressor protein3; 4. NikR is one of two nickel-responsive repressors in E. coli. The other is RcnR, which is structurally unrelated to NikR, and controls expression of the RcnA nickel and cobalt efflux protein5.
Structural characteristics
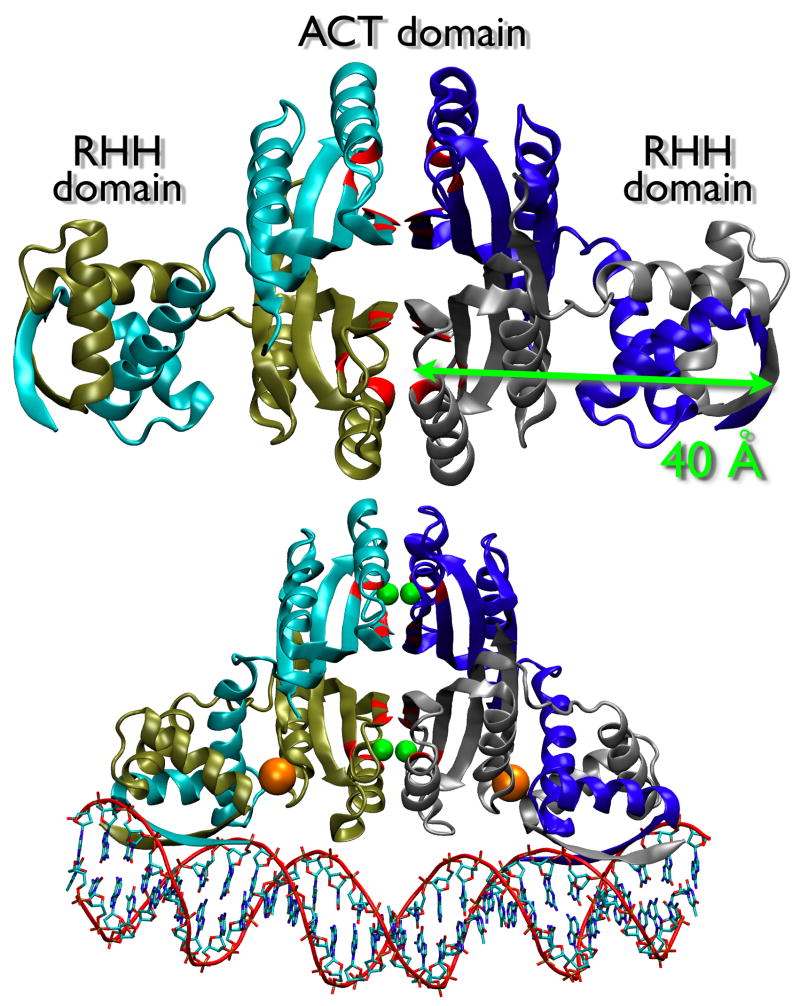
NikR is a homotetramer composed of 2 distinct domains6 (see Figure 1). The N-terminal 50 amino acids of each chain contribute to two dimeric domains of the ribbon-helix-helix (RHH) family7, a known and well-studied DNA-binding fold 8. The C-terminal 83 amino acids of each chain form a tetramer composed of four βαββαβ domains that together contain the high affinity nickel binding sites (Kd ~1pM)6; 9; 10. This domain is structurally homologous to the ACT-fold (aspartokinase, chorismate mutase, TyrA) family, which is a structural motif that typically binds small molecules that allosterically control enzymatic activity11. The NikR protein forms an interesting union of the DNA-binding RHH and the regulatory ACT domains to provide allosteric control of DNA binding through Ni2+ binding and thereby allowing NikR to act as a transcriptional repressor that responds to elevated intracellular Ni2+ concentrations4; 6; 12. A number of residues for NikR activity have been identified through structural and functional studies (Table 2).
Figure 1.
Comparison of apo and Ni2+DNA-bound NikR x-ray crystal structures. Apo structure was generated from PDB ID 1Q5V with missing atoms built in and energy minimized. Ni2+DNA-bound NikR is from PDB ID 2HZV. Protein chains are in “new cartoon” rendering and colored cyan, blue, tan, and silver. Ni2+ binding site residue positions (His76, His87, His89, Cys95) are colored red. DNA double helix backbone is outlined in “tube” rendering and colored red while nucleotides are in “bond” rendering and colored by atom name. Ni2+ atoms are shown as green spheres. K+ atoms are shown as orange spheres. All molecular images generated using VMD 1.8.6 (Humphrey et al., 1996).
Table 2.
NikR residues selected from computational analyses. Computational significance denoted by: A, contact correlation clusters that include Ni2+ and DNA binding site residues; B, domain-spanning correlation matrix clusters;
| Residue | Experimental Significance (references) | Computational Significance | Sequence Conservation |
|---|---|---|---|
| Arg3 | Specific DNA binding (1) | A,B | High (0.83) |
| Thr5 | Specific DNA binding (2) | B | High (0.62) |
| Thr7 | Specific DNA binding (2) | A,B, * | High (0.81) |
| Asp9 | Unknown | A,B, # | Moderate (0.58) |
| Arg22 | Unknown | A,B,* | Moderate (0.45) |
| Asn27 | Non-specific DNA contact (2) | A,B | Moderate (0.64) |
| Arg28 | Non-specific DNA contact (2) | A,B | High (1.00) |
| Ser29 | Non-specific DNA contact (2) | A,B, * | High (1.00) |
| Glu30 | Low-affinity metal site (2,3) | A,B | High (0.81) |
| Arg33 | Non-specific DNA contact (2) | A,B | High (0.87) |
| Asp34 | Low-affinity metal site (2,3) | A,B | Moderate (0.71) |
| Arg37 | Unknown | A,B, # | High (0.85) |
| Gln42 | Unknown | A,B,* | Low (0.41) |
| Tyr58 | Ni2+ site H-bond network (4) | B | High (0.60) |
| Tyr60 | Close proximity to Ni2+ site (4) | A,B | High (0.86) |
| His62 | Close proximity to Ni2+ site (4) | A,B, *, # | High (0.83) |
| Lys64 | Non-specific DNA contact (2) | A,B | Low (0.38) |
| Arg65 | Non-specific DNA contact (2) | A,B,* | Moderate (0.52) |
| Ser69 | Unknown | A,B,* | Moderate (0.51) |
| Gln75 | Ni2+ site H-bond network (4) | A,B | High (0.74) |
| His76 | High-affinity Ni2+ binding site (4) | A,B, * | High (1.00) |
| His87 | High-affinity Ni2+ binding site (4) | A,B | High (1.00) |
| His89 | High-affinity Ni2+ binding site (4) | B | High (1.00) |
| Cys95 | High-affinity Ni2+ binding site (4) | A,B | High (1.00) |
| Glu97 | Reduced Ni2+ and DNA binding upon mutation (5) | A,B | High (0.98) |
| Gln109 | Unknown | A,B,* | Moderate (0.49) |
| Asp114 | Unknown | A,B,* | Moderate (0.47) |
| Ile116 | Low-affinity metal site (2,3) | B | Low (0.39) |
| Gln118 | Low-affinity metal site (2,3) | A,B, # | Moderate (0.45) |
| Arg119 | Non-specific DNA contact (2) | A,B | High (0.62) |
| Val121 | Low-affinity metal site (2,3) | A,B | High (0.82) |
, top 10 residues in number of contact correlations within the selected clusters;
top 4 residues in total number of significant contact correlations. Sequence conservation is denoted by position conservation scores from the Scorecons given in parentheses (see Methods section). Experimental references in table are: (1) Chivers and Sauer, 1999; (2) Schreiter et. al. 2006; (3) Chivers and Tahirov, 2005; (4) Schreiter et. al. 2003; (5) Carrington et. al. 2003. Those residues with “unknown” experimental significance have not yet been tested and represent positions for which mutation is predicted to alter NikR function.
Functional sites
Ni2+ binding sites
Metal binding is required for measurable association of E. coli NikR to nik operator DNA in vitro6; 9; 13. Metal binding stabilizes E. coli NikR against both heat and chemical denaturation9; 10, as well as proteolytic cleavage14. This stabilization is likely related to a nickel-specific conformational change of the protein. Changes in backbone amide hydrogen/deuterium exchange15 show the largest effect with nickel, which binds with square-planar coordination geometry6; 16; 17. Other first-row transition metals bind with different coordination geometries and exhibit H/D exchange different from the Ni2+-bound protein15.
The X-ray structure of the E. coli NikR C-domain6 first identified the high affinity nickel-binding sites, located at the interface between two NikR dimers (see Figure 1). The Ni2+ sites are roughly ~40 Å distant from the β sheet in the N-terminus that forms sequence-specific DNA contacts (see Figure 1). This structure confirmed the square planar geometry first reported by X-ray absorption spectroscopy16. The nickel-ligands come from the sidechains of His87, His89, Cys95, and His76 bound directly to the metal. These residues are conserved in alignments of NikR sequences from over 82 bacteria and archaeal species (Figure 8). Mutation of Cys95 to Ala eliminates the nickel-responsive DNA-binding activity of NikR16 and is functionally inactive in vivo12, equivalent to deletion of the nikR gene. The X-ray structure also revealed that additional conserved residues (Tyr60, His62, Gln75, Glu97). Mutation of Glu97 also eliminates the Ni-responive DNA-binding activity of NikR16. The square planar Ni-site has also been identified in structures of the H. pylori18 and P. horikoshii19 NikR orthologs.
Figure 8.
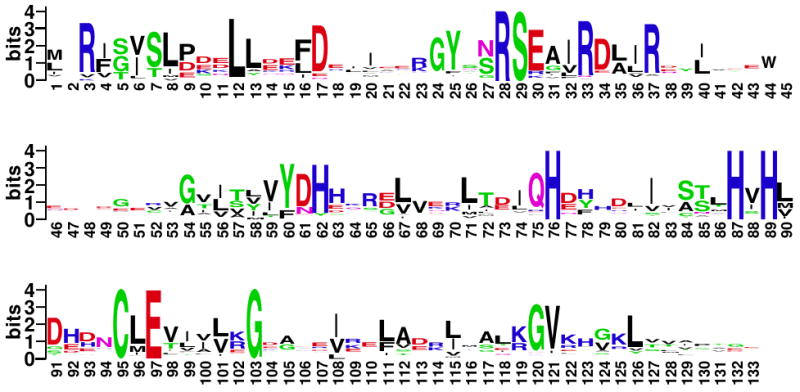
Sequence logo for the NikR family. This logo represents a multiple sequence alignment containing 82 sequences, numbered according to the E. coli NikR sequence. For each position, the total height (in bits) of the residue letters indicates the degree of conservation at that position83. Note that this sequence entropy measure of conservation is different from the method used for Table 2, which takes into account substitution matrices. This figure was generated using WebLogo84.
DNA binding sites
NikR was identified7 because of its sequence homology to the Arc repressor, the archetypical RHH DNA-binding protein20–22. The isolated N-terminal domain of NikR retains weak, nickel-independent DNA-binding activity7. Mutation of a β-sheet residue in also abrogates DNA-binding. Schreiter et al.17 have determined the co-crystal structure of EcNikR with an operator DNA fragment. This structure confirms the expected specific RHH-DNA interactions via the β-sheet. This structure also identified non-specific contacts between the ACT-domain and the DNA.
Low-affinity metal binding site
There is evidence for a functional second nickel-binding site in E. coli NikR that results in increased DNA-binding affinity4; 9; 13 and increased repression of NikABCDE expression5; 12 than is observed with just high-affinity Ni-binding site occupancy. The structural location of this site is ambiguous. An X-ray structure of NikR from Pyrococcus horikoshii19 reported a second Ni2+ site at the N- and C-terminal domain interface (COO- of Glu30 and Asp34 and main chain C=O of Ile116, Gln118, Val121). In contrast, the E. coli NikR-DNA co-crystal structure reported a K+ ion bound using the same residues. Mutation of either Glu 3019 or Asp3417 eliminates the increased DNA-affinity with increased Ni2+.
Allostery and structural changes
Despite the available structural and biochemical data for NikR, it is not clear how Ni2+-binding activates the protein for DNA-binding. Recent crystal structures of full-length E. coli NikR with Ni2+ and with both Ni2+ and DNA bound17 suggest that Ni2+ binding is not correlated with a single conformational state of the protein; i.e., Ni2+ binding does not appear to “pre-arrange” the protein into a conformation similar to the DNA-bound state. As such, it is not obvious from crystal structure comparisons how nickel binding activates the protein for DNA binding. Conformational heterogeneity has also been observed in crystal structures of the H. pylori and P. horikoshii NikR orthologs18; 19. Solution studies suggest that at least a small change in the average conformation of NikR must accompany Ni2+ binding14; 15, indicating that perturbations of the protein’s conformational flexibility and dynamics may play an important role in activation of DNA binding. Recently, Cui and Merz used coarse-grained elastic network models to probe the range of conformational motions available to the NikR tetramer 23. They concluded that large-scale conformation changes were essential to transform apoNikR into a DNA-binding state but were unable to identify the specific residue-level changes needed to effect this change.
A series of both experimental and simulation studies support the notion of a pre-existing equilibrium of protein conformational states in the absence of bound ligands24–29. Additionally, recent work using coarse-grained modeling of several enzymes supports a connection between the conformational fluctuations of the apo protein and the motions involved in functionally important conformational changes30; 31. A helpful framework for this idea is provided by the fluctuation-dissipation theorem, which states that the response of a system to small perturbations involves fluctuation pathways that are present at equilibrium prior to the perturbation32.
We have utilized an equilibrium molecular dynamics (MD) simulation in order to explore the conformational dynamics of the E. coli NikR tetramer§. Molecular dynamics methods have been used with a variety of other proteins to find residue interactions that are involved in conformational changes33–36. The goal of our apoNikR simulation and analysis is to provide insight into conformational fluctuations and local interactions involved in the structural changes regulating the protein’s DNA binding affinity. Analyses of contact and positional correlations within and between residues of the ACT and RHH domains have defined networks of residues that connect the Ni2+ and DNA-binding sites and are likely important for allosteric control of NikR function. Several of the residues identified by these analyses have been shown experimentally to be important for NikR function (Ni2+ or DNA-binding). An additional subset of these residues provides a structural link between experimentally identified residues and may help coordinate the allosteric communication between the ACT and RHH domains. Given the structural similarity of the Ni2+ binding ACT domain in NikR with other small molecule binding ACT domains in a variety of other proteins, understanding how ACT domain control works in NikR could help elucidate a common regulatory mechanism for several ACT-containing systems.
Results
Equilibration measures
Molecular dynamics of apoNikR was performed as described in Methods and theory. Before analyzing the conformational fluctuations of the NikR tetramer (532 residues) observed during the MD simulation, it was important to assess whether or not the simulation achieved equilibrium or steady-state sampling. The evolution of the RMSD relative to the starting structure has been used to estimate equilibration and simulation stability in other systems37; 38. An initial rapid rise was observed in RMSD that leveled off around 10 ns (see Supplementary Material Figure S1), but with substantial continued fluctuation between 2.5 and 4.5 Å. An examination of the dihedral potential energy revealed a change over the first 30 ns of the simulation (see Supplementary Material Figures S2 and S3). At least part of the dihedral energy drift appeared to correlate with changes in secondary structure over time (see Supplementary Material Figure S4). Using secondary structure assignments from DSSP39 as implemented in the ptraj module of AMBER 9.040, this secondary structure change appeared to be caused by a loss of α-helix with a concomitant gain in 310-helix content, mainly in helix B of the RHH domain and helix C of the ACT domain. Taken together, these data showed a clear systematic drift in the MD trajectory that leveled off at ~30 ns.
The conformational effect of this systematic drift was also apparent in the correlation matrix of atomic positions. Correlation matrices were calculated for the α carbon position of each residue (532 total; 532 × 532 matrix). For comparison, the correlation matrix without the first 10 ns (change in RMSD) was compared with the matrix calculated without the first 30 ns (systematic drift in potential energy). Clearly, inclusion of the simulation data between 10 to 30 ns has a strong effect on the correlation matrix (see Figure 2), leading to the conclusion that the systematic drift apparent over the first 30 ns of the simulation gives rise to correlated motions due to concerted structural changes rather than equilibrium fluctuations of the system. Therefore, only the last 51 ns of the simulation were used for subsequent analyses.
Figure 2.
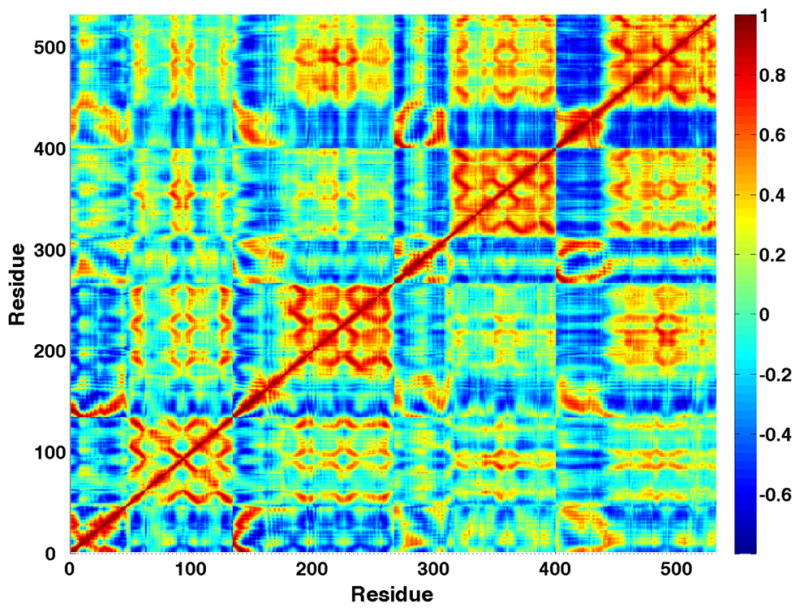
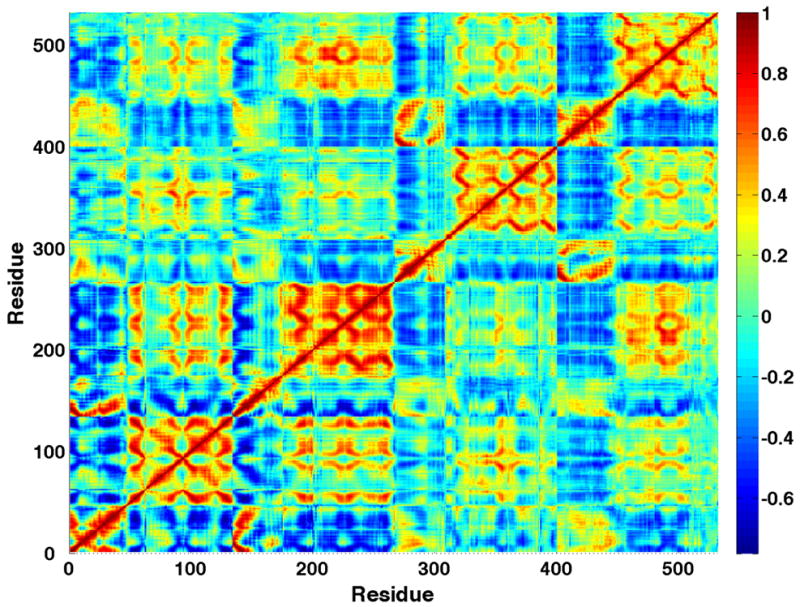
Cα correlation matrices. Last 71 ns (A) and last 51 ns (B). The data from the matrix that includes earlier non-equilibrated structural change has systematically larger (anti-)correlations within 2 of the 4 subunits. Figure generated using MATLAB 7.4 ((The MathWorks, Natick, MA, USA).
Principal component analysis
Principal component analysis (PCA) yields a set of modes (eigenvectors) that represent a non-redundant set of motions observed in the MD trajectory for a set of selected atoms 41–44. PCA was carried out on the simulation data using the α-carbon of each of the 532 residues in the NikR tetramer. This analysis yields 3N total modes, where N is the number of atoms included, giving a total of 1596 modes. The first mode can be interpreted as the principal axis of the largest atomic fluctuations represented in the covariance matrix; e.g., the direction of maximum variation in conformation observed over the course of the molecular simulation. Each subsequent mode represents the next-largest principal axis of atomic fluctuations orthogonal to all previous axes. Every PCA mode is also associated with an eigenvalue, this eigenvalue corresponds to the amplitude of fluctuations along that mode. Therefore each eigenvalue, divided by the sum of all eigenvalues, represents the relative contribution of a mode to the total conformational variance observed during the simulation.
To place the apoNikR MD simulation in the context of experimentally determined structural transitions for E. coli NikR, PCA provided a means to determine whether the observed equilibrium conformational fluctuations resemble the transformation between apoNikR and DNA-bound Ni2+NikR. The observed PCA modes, vi, were compared with a “structural change vector”, Δx, defined by aligning the DNA-bound crystal structure with the minimized apoNikR structure (e.g., the starting MD conformation described in the Methods and theory section) and calculating the change in position of each alpha carbon. A “completeness” test was performed to ascertain if Δx could be adequately described using a subset of the PCA modes as a basis set (Eqs. 3–6 in Methods and theory). The full basis set of 1596 PCA modes gave high overlap (cos θ, Eq. 5) of 0.999 and low error of 0.034 (ε, Eq. 6) when used to represent the Δx observed in X-ray studies (see Table 1). From this PCA basis set, a minimal set of modes was identified that represented the observed displacement between apo and DNA-bound NikR. Table 1 lists the mode overlaps between Δx and the “top 10” PCA modes based on the magnitude of the eigenvalues. The first and largest PCA mode accounts for 41.7% of the total motion, but has only a small overlap (cos(θ) = 0.125) with the observed changes in the X-ray structure. This largest mode represents an asymmetric twisting of one RHH dimer relative to the rest of the NikR structure. This twisting motion occurs along the long axis of the NikR molecule. The second PCA mode accounts for 13.2% of the total motion and has a strong overlap (cos(θ) = 0.811). This second mode is a highly symmetric “flapping” motion of both RHH dimers relative to the ACT tetramer that clearly resembles the conformational change necessary to transform the apoNikR crystal structure into the DNA-bound Ni2+NikR structure (see Figure 3). Together, the first 10 modes account for 81.9% of the total motion. A “reconstructed vector” that consists of the first 10 modes re-weighted by their respective α(i) also has a high overlap of 0.932 with Δx. In other words, the conformational fluctuations represented by the first 10 PCA modes can be used to provide a reasonable representation of a conformational change that is expected to be functionally relevant.
Table 1.
PCA mode overlap with the NikR structural change vector. As described in the text, the PCA modes describe a vector displacement of all Cα positions and are indexed by decreasing magnitude (eigenvalue). The “structural change vector” is calculated by comparing the Cα positions of the minimized apoNikR crystal structure (PDB ID 1Q5Y with missing atoms built in) with the Ni2+DNA-bound NikR crystal structure (PDB ID 2HZV). Equations for the vector overlap- cos(θ), α(i), and the error can be found in Methods and Theory section of the manuscript.
| Mode Index | Eigenvalue | % of Motion | cos(θ) | α(i) | Error* |
|---|---|---|---|---|---|
| 1 | 590.948 | 41.7 | −0.125 | -19.14 | 0.992 |
| 2 | 187.356 | 13.2 | −0.811 | −121.4 | 0.573 |
| 3 | 129.591 | 9.1 | 0.157 | 23.66 | 0.551 |
| 4 | 78.895 | 5.6 | −0.307 | −46.13 | 0.462 |
| 5 | 44.271 | 3.1 | 0.150 | 23.18 | 0.441 |
| 6 | 39.941 | 2.8 | −0.044 | −6.52 | 0.439 |
| 7 | 34.617 | 2.4 | 0.211 | 31.75 | 0.387 |
| 8 | 24.542 | 1.7 | −0.138 | −20.75 | 0.364 |
| 9 | 17.087 | 1.2 | −0.017 | −2.56 | 0.364 |
| 10 | 12.447 | 0.9 | −0.020 | −3.20 | 0.364 |
| First 10 | (sum) 1159.695 | 81.9 | 0.932 | -- | 0.364 |
| All 1596 | (sum) 1416.344 | 100 | 0.999 | -- | 0.034 |
For modes 1–10 the error is cumulative from mode 1 up to the specified mode.
Figure 3.
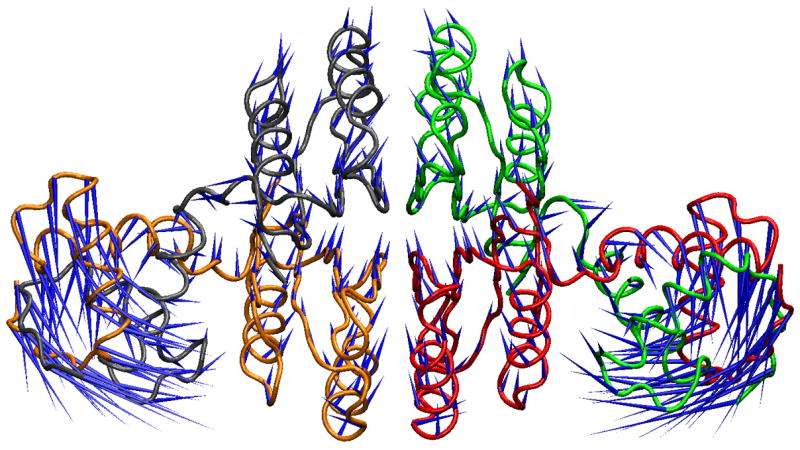
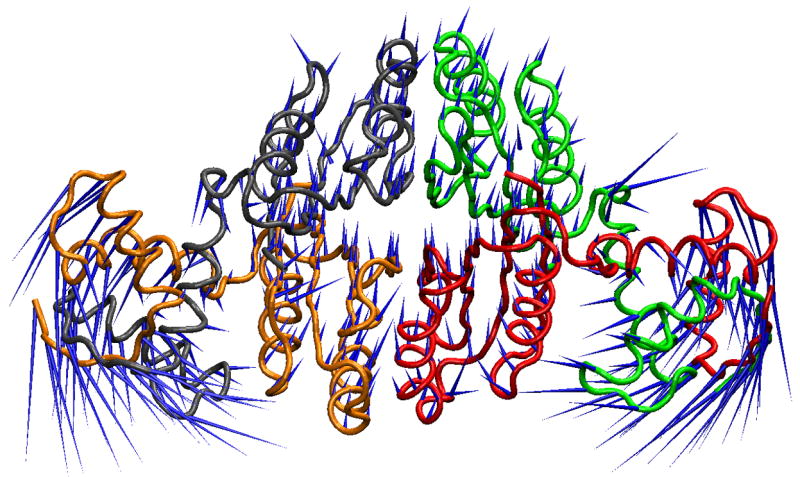
X-ray crystal structure and PCA mode displacement visualizations. A. The minimized starting structure is shown in tube representation colored by chain. The blue “porcupine needles” 35 indicate the direction of displacement in going from the apo to the DNA-bound Ni2+NikR crystal structure, denoted as Δx in the text. B. The MD average structure from the last 51 ns is shown in tube representation colored by chain. The blue “porcupine needles” indicate the direction of displacement based upon the 2nd PCA mode, which has the highest overlap with Δx.
Correlation matrix based residue clustering
An additional set of observables of interest in the simulation includes correlations in the equilibrium fluctuations of atomic position between sets of residues. A compact representation of this data is the covariance matrix, which for a chosen set of atoms expresses the variances (matrix diagonal) and covariances (off-diagonals) in Cartesian coordinates. In 3-dimensional space, the covariance matrix is 3N × 3N for N selected atoms. The scalar correlation matrix is instead N × N and simply contains the mean-squared correlations (range −1.0 to 1.0, see Eq. 8 in Methods and theory) between all N atoms in the off-diagonals and 1.0 along the diagonal. The scalar correlation matrix can be visualized to observe how motions in different regions of the protein are correlated (see Figure 2). By using the magnitude of the (anti-)correlation of α-carbons as an effective distance between residues (see Methods and theory) protein residues were clustered into groups whose motions were correlated with Ni2+ and DNA binding site residues (see Figure 4) where selected clusters are plotted as blocks of color on the NikR structure (see also Supplementary Material Table S1). Three clusters that connect the Ni2+ and DNA binding sites are shown (red, green, and blue), as well as an additional cluster contained within one RHH dimer (orange). This analysis allows visualization of dynamic correlations as structural connections between groups of residues that could be important for NikR activation upon nickel binding.
Figure 4.
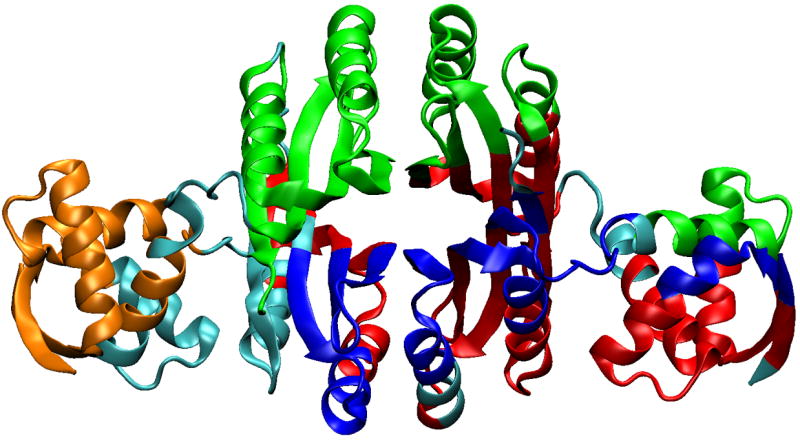
Residue clusters based on the correlation matrix. Clusters generated using the UPGMA algorithm were selected based on including either/both Ni2+ and DNA binding site residues. These clusters imply groups of residues with concerted conformational fluctuations that could be important for inter-domain communication. Different clusters are indicated by color, except cyan, which indicates residues not found in the selected clusters.
Non-covalent contact correlations
One observable that reports on equilibrium conformational fluctuations is the making and breaking of non-covalent bonds or “contacts” in residue-residue interactions. We hypothesize that significant correlations between contact fluctuations indicate energetic connections between regions of the protein that are not apparent from a static structure. Using contact definitions defined in the Methods and theory section, correlation statistics between all i,j pairs of contacts were calculated according to the φij binary correlation measure. By utilizing the connection between φij and χ2 (see Methods and theory), correlations could be classified as “significant” at a 95% confidence interval, leading to the discovery of networks of residues with significantly correlated contacts that connect the Ni2+ and DNA binding domains of NikR. Furthermore, certain residues are categorized as highly connected “hubs” in these networks (residues marked with a “#” in Table 2).
The clusters selected based on the “depth first” criteria for non-covalent contact correlations (see Methods and theory) are shown mapped onto the NikR structure in Figure 5. Three key regions had a high concentration of these residues (see Figure 5B): helix d (residues 60–65), the turn into beta strand 5 (residues 118–122), and helix b (residues 27–42). Residues associated with the selected contacts irrespective of chain ID are mapped onto the structure. These three regions contain several evolutionarily conserved residues as determined by MSA (see Methods and theory) and include residues known experimentally to be important for NikR function (see Table 2). A visual representation of the MSA is included in Figure 8. Several of the non-covalent contacts that are correlated with Ni2+ and DNA-binding site contacts (see Figure 5A) bridge the 3 regions highlighted in Figure 5B and directly connect these regions to binding site residues. This is illustrated in Figure 7, where a subset of residues from Table 2 are mapped onto the NikR structure along with non-covalent contacts selected by our clustering method. The top ten residues, irrespective of chain ID, that “own” the largest number of contact correlations in the selected clusters (listed Supporting Information) are marked in Table 2 (“*”). These residues are highly interconnected within the network of contact correlations selected by our analysis based on binding site residues. All of the residues marked with either “*” or “#” in Table 2 are included in Figure 7. Through this analysis, specific residue-residue contacts distributed between the ACT and RHH domains have been identified that connect to both the Ni2+ and DNA binding sites and could be important for allosteric control in NikR.
Figure 5.
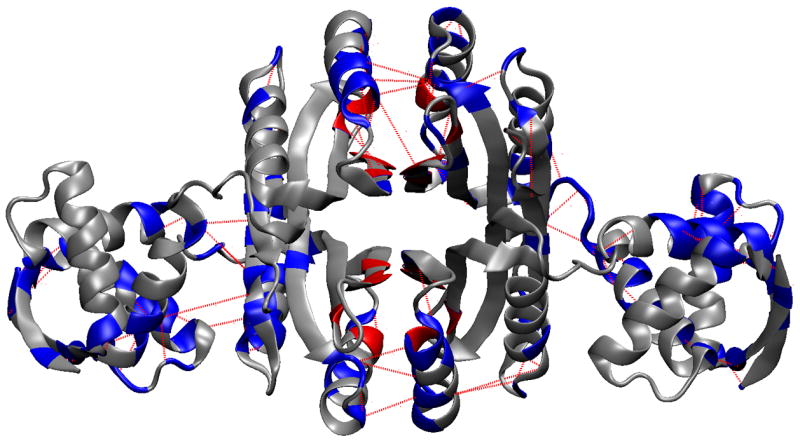
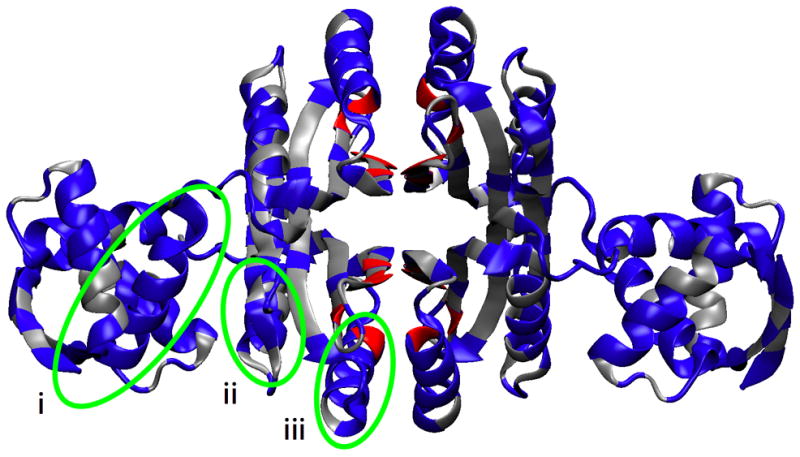
Protein regions identified by non-covalent contact correlations. A. Residues colored blue were selected using the UPGMA clustering criteria of finding the smallest clusters that include both Ni2+ and DNA binding site residues. The non-covalent contacts selected by this method are shown in red dashes. B. Color same as A, except residues are colored based on residue number irrespective of chain, thereby emphasizing the symmetry of the tetramer. The nickel binding residues are colored red (only His76, His87, and Cys95 were found in the UPGMA clusters). The remaining nickel binding residue, His89, is colored yellow. The three green ovals each highlight one example of the three regions with a concentration of correlated contacts: i. Helix B (residues 27–31, 33, 34, 37 to 48), ii. the end of helix D and turn leading into strand 5 (residues 117–123), iii. end of strand 2 and Helix C (residues 62–66 and 68–80).
Figure 7.
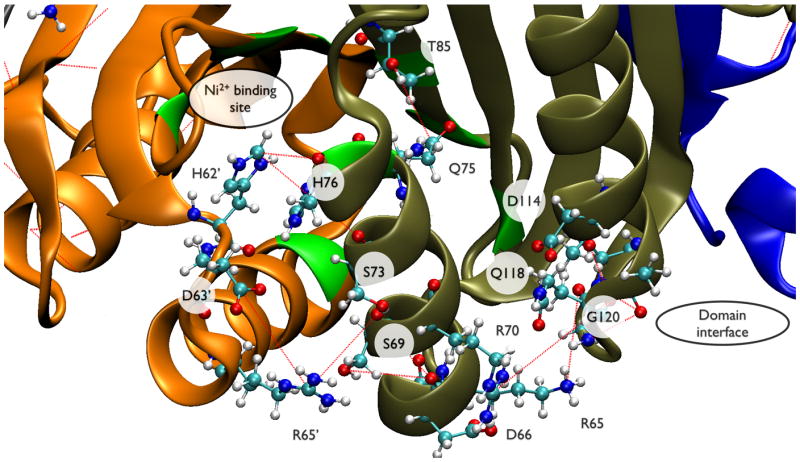
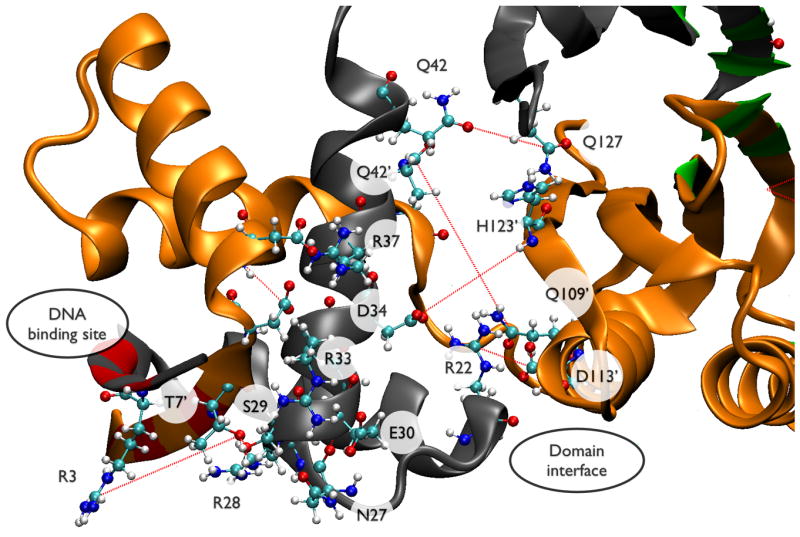
This figure shows subsets of residues from Table 2 mapped onto the NikR structure: (A) residues that connect the Ni2+ binding site to the RHH/ACT interface and (B) the RHH domain and RHH/ACT interface. Individual protein chains are colored grey, orange, tan, and blue. Ni2+ binding residues are colored green; residues that make sequence-specific DNA contacts are colored red. Red dashes indicate correlated non-covalent contacts selected by UPGMA clustering (see Methods and Theory). Selected residues are shown in CPK rendering and labeled by residue type/number.
Discussion
We have used a molecular dynamics simulation, together with new non-covalent contact and position correlation clustering methods, to investigate the mechanism of allostery in the NikR protein. Our hypothesis is that the dynamics observed in the apoNikR MD simulation contain functionally relevant conformational fluctuations. The lack of Ni2+ in these simulations prevents us from drawing detailed conclusions about the specific role of Ni2+as compared to other transition metal ligands. However, our overall approach and its relevance to NikR function is supported by comparison of the dominant modes of motion from PCA with the conformational change necessary to transform the apoNikR crystal structure into the DNA-bound Ni2+NikR structure. The new contact and position correlation methods are utilized to find clusters of residues that share similar correlation patterns with Ni2+ and DNA binding site residues. This results in the identification of a network of residue interactions that connect the two types of NikR binding sites and further highlights individual residues that could be important allosteric communication links. Several of these residues are evolutionarily conserved among members of the NikR family; those residues found in the Ni2+ binding domain could represent important control points that are common elements in ACT domain control of biological activity.
Correlation analysis methodology
While previous investigators have considered patterns in correlation matrices obtained from molecular simulations45; 46, the methods presented here combine automatic clustering of residues based on both position and contact correlations with further refinement using functional information about allosterically-linked sites of the molecule. Inclusion of multiple functional sites in the cluster selection method can result in relatively large clusters, which parse the NikR structure into regions that have significant connections manifested by the observed correlation. While these residue clusters are likely involved in inter-domain communication, they do not show individual residue interactions that could be important for the allosteric mechanism. The most significant methodological development in this work is the analysis of non-covalent contact correlations to measure fluctuations in “interaction space.” This contact correlation analysis approach provides a more local view of interactions, which complements the global motions typically identified with PCA or the position clustering methods described in this manuscript. The interpretation of the results of these position and contact correlation analyses is based on the hypothesis that such correlations imply structural and energetic connections between residues important for changes in NikR conformational distributions due to Ni2+. This interpretation is supported by the observation that several identified residues have functional consequences when mutated, appear to be important in the crystal structure of the NikR-DNA complex, and/or are evolutionarily conserved (see Figure 6 and Table 2). The usefulness of this approach is further supported by a related recent study of allosteric protein structures which analyzed local changes in contacts to successfully identify residue interaction networks47. The residues identified by our method do not provide direct physical information about the series of events that generate the structural changes in NikR; however, they do provide a starting point for subsequent experimental and computational studies designed to specifically determine the pathways for allosteric changes in the protein.
Figure 6.
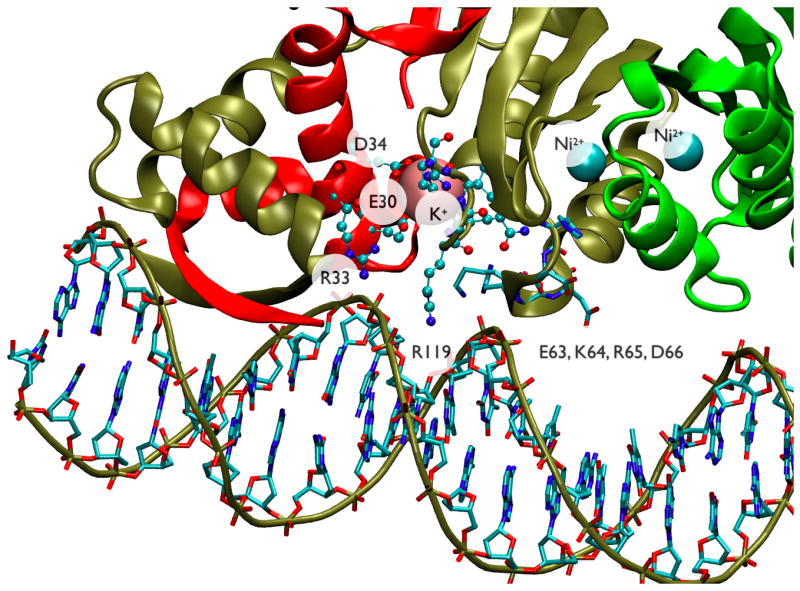
Close-up view of NikR-DNA interactions from the crystal structure (PDB ID 2HZV17). Protein chains are in “cartoon” rendering and colored red, tan, and green. Ni2+ atoms are shown as cyan spheres while K+ is shown in pink. The DNA backbone is outlined in “tube” rendering and colored tan while nucleotides are in “bond” rendering and colored by atom type. Protein side-chains for residues 63–66 are in “bond” rendering and colored by atom type while residues 30, 33, 34 and 118–122 are in “CPK” rendering and colored by atom type. The labeled protein residues correspond with the three groups identified in Figure 5 from MD analysis of apoNikR conformational dynamics. All three regions contain residues that make non-specific contacts with the DNA phosphate backbone. In addition the residues flanking R119 from one region along with residues E30 and D34 from another region form the cation-binding site that apparently helps stabilize the DNA-bound conformation.
Identification of residues implicated in NikR allostery
We observe groups of non-covalent contact correlations between three regions of the NikR structure identified in Figure 5 and the Ni2+ and DNA binding sites. When taken together with the domain-spanning clusters identified from the positional correlation matrix, a picture emerges of a pathway connecting the two functional sites that could transfer energy and information such as nickel binding site occupancy. This pathway is made up of the residues listed in Table 2 and mapped on the NikR structure in Figure 7. The pathway includes several residues with known experimental importance combined with an additional subset that structurally connects these residues with the Ni2+ and DNA binding sites.
The PCA results support the idea that the apoNikR simulation contains functionally relevant conformational fluctuations by demonstrating that the displacement necessary to go from the apo to the DNA-bound x-ray crystal structures is well represented by the second PCA mode and by a weighted combination of the first 10 PCA modes. While the simulation does not undergo full conformational transitions between states similar to the apo, Ni2+ bound, and Ni2+-DNA bound crystal structures, it does sample local fluctuations that are likely important to the allosteric transitions. The connection between apoNikR conformational fluctuations and functionally relevant residue interactions is further borne out by a close inspection of NikR-DNA interactions from the x-ray crystal structure in Figure 6. In this figure, the labeled protein residues correspond with the three groups identified in Figure 5 from our non-covalent contact correlation analyses. All three groups contain residues that make non-specific contacts with the DNA phosphate backbone. In addition, the residues flanking R119 from one group along with residues E30 and D34 from another group form the cation-binding site that helps stabilize the DNA-bound conformation17. Thus our analyses of equilibrium conformational fluctuations of the apo structure have identified residues that are apparently important in nickel-activated DNA binding.
Other studies have introduced the idea of shifting a pre-existing conformational equilibrium in allosteric systems33–36, including the original Monod, Wyman, and Changeaux model of protein allostery48. The fluctuation-dissipation theorem32 supports the idea that the apo protein ensemble should include fluctuations that are involved in shifting the conformational ensemble to the (de)activated state upon ligand binding. More recent experimental24 and computational26; 49 studies further support this view of protein allostery. In this study, correlations between residues resulting from fluctuations in atomic position and non-covalent contacts are interpreted as reporting on important interactions for the allosteric mechanism of NikR
The residues in Table 2 and Figure 7 reveal a number of interesting sites for further experimental analysis. The computational significance column of Table 2 indicates which of the analyses presented in this study found at least one instance of each residue. Several of the residues were identified by more than one computational analysis, and those with unknown experimental significance were included in the table based on being highly interconnected in the contact correlation analysis. Those residues marked with “#” in Table 2 had the largest total number of significant contact correlations; these can be thought of as “hubs” in the interaction network that were selected in an unbiased way without assuming knowledge of interactions that are important for NikR function. The association of hub residues with function in Table 2 suggests that it is possible to apply our contact correlation method without prior knowledge of important functional sites. The UPGMA clustering method used here does not depend on such knowledge, and simply provides a hierarchical tree of significant contact correlations, which can be parsed in a variety of ways. However, because the Ni2+ and DNA binding site residues are known, that information can also be used to select a subset of “important” contact correlations. The residues marked with “*” in Table 2 had the largest number of these correlations selected based on the functional criteria described in the Clustering section of Methods and theory. Residues marked with both “*” and “#” could be particularly important for transducing the Ni2+ binding signal and therefore of significant interest for future experimental study. Residues that have “unknown” experimental significance in Table 2 have not yet been tested but are positions at which mutations are predicted to alter NikR function. The majority of the residues in Table 2 are also conserved or have conservative mutations for other NikR orthologs with known structures18; 19. A representation of the MSA used to determine conservation is provided by the sequence logo in Figure 8. The sequence logo shows that the NikR family has several highly conserved residues. For the purpose of selecting mutagenesis targets, our MD approach provides additional data to help develop hypotheses for why residues in different regions of the protein are conserved. The analyses presented here provide additional rationale for interpreting the effects of NikR mutations.
A subset of the residues from Table 2 are highlighted in Figure 7. Panel A shows a close-up view of residues that connect the Ni2+ binding site with the RHH/ACT domain interface. H76 is a Ni2+ binding residue that forms a correlated contact with H62′ across the tetrameric interface. H62′ in turn contacts S73 back across the tetrameric interface. S73 is the i + 4 residue to S69 along helix C. D63′ is covalently connected to H62′ and contacts R65′. R65′ and R65 form non-specific phosphate backbone contacts with DNA17, and also span the tetrameric interface to contact S69. In addition, R65 forms a correlated contact with G120, a highly conserved residue at the RHH/ACT interface. R70 is covalently attached to S69, and forms a correlated contact with Q118 at the RHH/ACT domain interface. Q118 is also involved in forming a non-specific cation-binding site that stabilizes the DNA-bound conformation17. This network of interactions is likely to be important to communicate the Ni2+ binding signal to the RHH/ACT interface.
Figure 7B depicts the DNA binding site residues colored in red. Residue S29, near the N-terminus of helix B, contacts residue T7 and could help orient this DNA-binding group. R33 and R37, both near the middle of helix B, also make contacts with either DNA binding residues or D9 and D11, residues at the junction between the DNA-binding β-strands and the N-terminal end of helix A. On the other face of helix B, D34 and N42 both make contacts that span the domain interface to H123 and N127, respectively. R22, at the C-terminal end of helix A, also forms a domain interface spanning contact with D113. E30 forms several contacts over the course of the simulation that tie together the N-terminal end of helix B with the C-terminal end of helix A and thus could help transmit effects from the RHH/ACT interface across the RHH domain to the DNA binding site.
Of the residues identified in this study, contacts at the interface of the ACT and RHH domains are of obvious interest given the necessary interaction of these domains in Ni2+-induced conformational change. However, residues within RHH domain helices also merit attention. Some of the contact correlations include backbone-backbone H-bonds running along helices A and B, which might suggest a concerted, rigid body response in transferring the Ni2+ binding status to the DNA-binding interface, and vice versa. Perturbing interactions between residues outside the DNA and Ni2+ binding sites may therefore uncouple the DNA binding response under saturating Ni2+ conditions. Such perturbations will be the subject of future mutagenesis studies.
Implications for the ACT domain family
To our knowledge, this study is the first reported atomic-scale MD simulation of a protein containing an ACT domain. This domain family is found in a variety of contexts with essentially no conserved sequence homology between ACT proteins with different functions11. However, the extraordinary degree of structural similarity between the regulatory domains of these proteins leads us to hypothesize that there could be a common regulatory mechanism of this fold regardless of associated “biological function” domains. A structural alignment of the ACT domains from E. coli NikR and E. coli D-3-phosphoglycerate dehydrogenase (PGDH) (data not shown) shows that some experimentally-identified residues that are important for PGDH function50–53 align well with residues listed in Table 2. Therefore, the ACT domain residues identified in this study in the context of NikR function might also represent key positions for transferring allosteric effects in many ACT domain-containing systems. Several comparative studies of protein fold families have fruitfully determined common mechanisms of action and overlapping control points in approximately congruent structures54–58. However, in some proteins with similar folds, even those with the same biological function in different organisms, slight differences in sequence appear to generate differences in molecular mechanism59–61. These observations suggest that the analyses of NikR in this study may be useful for guiding computational and experimental work in other ACT domain proteins; however, such work should be undertaken with caution and awareness of the complex relationship between sequence and function.
Methods and theory
Molecular dynamics simulation
The NikR molecular dynamics (MD) simulation utilized the AMBER 8.0 molecular modeling package40; 62 with the ff99 force field63. The starting structure for simulation was based on the x-ray crystal structure of the apoNikR tetramer (PDB ID 1Q5V)6 with missing backbone atoms reconstructed by symmetry between the NikR monomers (generously provided by Eric Schreiter). The WHAT IF molecular modeling package was used to rebuild missing amino acid sidechains and eliminate steric overlap through geometry optimization64. The minimized structure was solvated in a periodic truncated octahedron simulation box of ~28,000 TIP3P water molecules65, providing a minimum of 10 Å of water between the protein surface and any periodic box edge. Sodium and chloride ions were added to neutralize the total system and achieve a salt concentration of ~150 mM (as estimated by the simulation ion mole fraction and bulk water molarity). AMBER 8.0 was used to first energy-minimize solvent and ions using 5000 steps of steepest descent followed by 5000 steps of conjugate gradient minimization. The entire system was then energy-minimized using the same procedure. Following minimization, the entire system was heated in 50 K increments up to 298 K with 10 ps of isobaric-isothermal (NpT) MD equilibration per temperature step. The production simulation was conducted at 298 K and 1 atm of pressure with the NpT ensemble using the Berendsen thermostat66 with 1.0 ps coupling frequency and the Berendsen barostat66 with 0.2 ps coupling frequency. The trajectory was calculated with 2 fs timesteps using SHAKE67 constraints on hydrogen-heavy atom bonds. The total production simulation length is 81.78 ns, of which the first 30.78 ns were discarded as an “equilibration period”. This extensive relaxation/equilibration period was necessary due to drift in the potential energy, which correlates with changes in other observables (see Results for a description of criteria used for equilibration). Snapshots were retained every 10 ps for analysis.
Simulation analyses
Equilibration measures
The sander module of AMBER provides energy output in a text file that was parsed to obtain energies as a function of time. The ptraj module of AMBER 9.0 was used to write out the backbone root mean-squared deviation (RMSD) of atomic position relative to the starting structure. The DSSP algorithm 39 implemented in the ptraj module of AMBER 9.0 was used to calculate relative secondary structure content for each snapshot as a function of time. Energy, RMSD, and secondary structure plots vs. time (see Supplementary Material) were all generated using the Xmgrace software package (http://plasma-gate.weizmann.ac.il/Grace/) and used to assess simulation equilibration.
Principal component analysis
As it relates to MD, principal component analysis (PCA) involves diagonalization of the positional covariance matrix C to identify an orthogonal set of eigenvectors or “modes” describing directions of maximum variation in the observed conformational distribution41–44. The elements of C in Cartesian coordinate space are defined as follows:
| Eq 1 |
where xi and xj are atomic coordinates and the 〈…〉 denote trajectory averages.
Note that the protein structures from the trajectory are superimposed to a reference structure to remove overall translational and rotational motion prior to the calculation of C. PCA diagonalization of the covariance matrix involves the following eigenvalue problem:
| Eq 2 |
for the eigenvectors u(α) and the eigenvalues λ(α)68 As with related methods such as singular value decompositions69 and isomaps70, one motivation for PCA is to reduce the dimensionality of the MD trajectory data and provide a concise way to visualize, analyze, and compare large-scale collective motions observed over the course of the simulation. In particular, eigenvectors with the largest eigenvalues provide the biggest contributions to the observed covariance. The “essential modes” from a PCA analysis are usually a selection of these eigenvectors and associated eigenvalues that collectively account for a large percentage of the total observed motion68.
In this work, PCA modes are leveraged to identify large-scale apoNikR motions which are similar to structural transitions between the available NikR crystal structures. The PCA modes can be defined as displacement vectors from the average structure for the MD simulation. PCA for α carbons was carried out using the ptraj module of Amber 9.040. Using MATLAB 7.4 (The MathWorks, Natick, MA, USA), PCA modes (vi) were compared with a vector ( Δx ) describing the displacement of α carbon atoms from the minimized starting apoNikR structure (e.g., PDB entry 1Q5V6 with missing atoms built in) to the DNA-bound Ni2+NikR structure determined by x-ray crystallography. This vector was calculated following alignment of the minimized and crystal structures with the MD average structure to remove rotation and translation of the center of mass. We began by determining whether or not Δx can be reasonably represented in the vector space described by various subsets of PCA modes. This is accomplished by calculating the weight factor (α(i)) for each PCA mode as follows:
| Eq 3 |
and subsequently using a subset S of modes to calculate a reconstructed vector (Ṽ) as follows:
| Eq 4 |
The similarity between Δx and each PCA mode (vi or Ṽ) is calculated by their overlap as measured by the angle between the two vectors:
| Eq 5 |
Furthermore, the relative error in the reconstructed vectors can be computed as:
| Eq 6 |
This error simply provides a measure of how well the displacement due to the recalculated vector recapitulates the observed crystallographic Δx and thus allows us to assess the number of modes required to accurately represent the conformational change.
Clustering
To define groups of residues with similar correlation patterns, an “unweighted pair group method with arithmetic mean” (UPGMA) clustering algorithm was used 71; 72. To do this, an effective “distance” dij between contacts/residues i and j was defined based on a correlation measure, cij, as follows:
| Eq 7 |
These distances between contacts/residues represent the strength of the relationship between them, with the “closest” contacts/residues having the largest magnitude correlations. In this work, we use this methodology for both the correlation matrix of atomic positions and non-covalent contacts (see below). With an effective distance defined between all contacts/residues, it is possible to cluster them using a hierarchical agglomerative approach such as UPGMA71. This method yields a “tree-like” representation of correlated residues in which individual residues are the “leaves” and clusters of residues are defined by different branch points in the tree at different “tree heights.” With this type of data representation, one must select a level of the tree hierarchy for defining clusters of residues (see below).
UPGMA clustering “depth first” selection
After clustering, functional selection criteria were applied to identify clusters containing a network of contacts/residues known to be important for NikR function. In particular, the smallest clusters containing at least one contact/residue from the Ni2+ binding site (His76, His87, His89, Cys95) and at least one sequence specific contact/residue from the DNA binding site (Arg3, Thr5, or Thr7). This cluster selection step is considered “depth first” and selects clusters that have the strongest relationship among members while still maintaining at least one contact/residue from each of the Ni2+ and DNA binding sites, in contrast to a “breadth first” selection that requires all Ni2+ and DNA binding site contacts/residues are included. The “depth first” approach selects a subset of total contacts/residues that have the strongest relationship with binding site contacts, producing a subset of NikR residues that form our selected groups of contacts/residues, which indicates positions in the structure that are likely involved in a communication network between the Ni2+ and DNA binding sites. Functional information plays an important role in these cluster definitions. However, as described in the Results section, it is also possible to use our correlation analysis to identify “highly connected” residues without the need for functional information.
UPGMA clustering “completion” step for cluster selection
An additional step of cluster selection was used when clustering residues based on the correlation matrix (see below) to ensure that all Ni2+ and DNA binding residues were accounted for. Upon identification of the initial domain-spanning clusters by the “depth first” approach, the largest clusters that contained at least one Ni2+ or one DNA binding site residue and no residues that had been found in the “depth first” step were then identified. This accounts for the remaining binding site residues at the same level in the tree hierarchy as the clusters identified in the “depth first” cluster selection step described above.
Correlations in atomic position
The scalar correlation matrix was calculated across all α-carbons of the NikR tetramer using the ptraj module of AMBER 9.040. The elements of this matrix, sij, assign a value between −1.0 and 1.0 that indicates the degree to which the fluctuations of atom i are correlated with those of atom j over the course of the MD trajectory according to the following equation73:
| Eq 8 |
where Δri and Δrj are the displacement vectors for atoms i and j and the <…> denote trajectory averages.
Correlation patterns apparent in this matrix were analyzed (see Figure 2) to define groups of NikR residues with similar correlation patterns. This grouping utilized the UPGMA clustering algorithm described above including the “depth first” selection criteria and the “completion” step. The residues included in each cluster are listed in Table S1 of Supporting Information.
Correlations in non-covalent contacts
Non-covalent contacts, including hydrogen bonds and salt-bridges, were analyzed for correlations to help identify the residues involved in potential communication networks connecting the Ni2+ binding sites to the DNA-binding domains. Nonpolar contacts were omitted from the correlation analysis for two major reasons. First, one of the goals of this study is to suggest positions for mutagenesis; alteration of a nonpolar contact is often more likely to adversely affect protein stability. Second, nonpolar contacts are more numerous throughout the protein structure and therefore more difficult to uniquely define as binary variables for correlation purposes. Individual contacts were treated as binary variables that were either “on” or “off” for each snapshot from the apoNikR MD trajectory. A useful measure of correlation between binary variables is the φ correlation metric74, a binary variant of the standard Pearson correlation75. The φ correlation can range between −1.0 and +1.0, indicating complete negative and positive correlation, respectively. A φ value of 0.0 indicates lack of correlation. The calculation of φ values for all possible pairs of non-covalent contacts across the NikR MD trajectory proceeded as follows:
A list of observed contacts was generated for each MD snapshot using the program PDB2PQR (http://pdb2pqr.sourceforge.net/)76. For hydrogen bonds, lists of H-bond donor (D) and acceptor (A) heavy atoms were defined based the following criteria: D to A distance ≤3.4 Å and the A-H-D angle ≤30°77. For salt bridges, both positively and negatively charged heavy atoms were defined by considering amino acid sidechains that carry a formal charge. Salt-bridges were then assigned whenever both a positively charged atom and a negatively charged atom were ≤4.0 Å78. To remove redundancy in counting multiple interactions between residues, contacts were defined and counted as sidechain-sidechain, sidechain-backbone, or backbone-backbone. Contact lists for each snapshot only allowed one instance of each type of contact between any 2 residues within each snapshot.
The contact lists for all snapshots were parsed in order to populate the contact occupancy matrix B, an N × N matrix where N is the total number of unique contacts observed throughout the entire simulation. The diagonal of B stores the total number of snapshots in which each contact is observed, and the i,j off-diagonal elements store the total number of snapshots in which both contacts i and j were observed.
For each i,j contact pair, the following frequencies were calculated using B: n00, the number of times both contact i and j were “off”; n10, the number of times contact i was “on” while contact j was “off”; n01, the number of times contact i was “off” while contact j was “on”; n11, the number of times both contacts i and j were “on”. Given these frequencies, the φij correlation value was calculated from74:
| Eq 9 |
The significance of a correlation value is generally dependent on the number of independent observations. In the case of φ correlation, there is a simple relationship that provides an effective chi-squared value for significance74:
| Eq 10 |
where N is the number of independent data observations used to compute the correlation. Because MD snapshots are intrinsically correlated over varying time scales depending on the observable of interest, N was estimated separately for each i,j pair of observed contacts. The number of times that each contact was both made and broken over the course of the simulation (representing the number of “on” and “off” states) was defined as ni, and used in the following equation:
For this definition of N, the χ2 value should depend on the number of independent states observed for the variable of interest. In the current work, we approximate the number of independent states by the number of times a non-covalent contact is made or broken. The φ correlations between i,j pairs were considered significant when is greater than or equal to the threshold value for the 95% confidence interval using 1 degree of freedom for the binary nature of the data 74; 79.
The set of statistically significant contact correlations gives a large data set with 91,934 elements for the 532 residue NikR tetramer. To parse these data and find correlations that may be important for NikR function, the contact correlation data were used as input for the UPGMA clustering algorithm described above. Only the “depth first” cluster selection step was used here. This cluster selection finds a smaller number of total contacts, which have the strongest relationship with binding site contacts. A subset of NikR residues form our selected groups of contacts (see Figure 5 and Table S2 in Supplementary Material) and are likely involved in a communication network between the Ni2+ and DNA binding sites.
Multiple sequence alignment and positional conservation
The E. coli NikR sequence (FASTA sequence from PDB ID 1Q5V) was used as the input for the NCBI BLASTP server (http://www.ncbi.nlm.nih.gov/blast/)80. The search was performed against the non-redundant database with default parameters except that sequences with an E-value less than 1.0 were retained. A multiple sequence alignment (MSA) was constructed using CLUSTALW 1.8181 with the BLOSUM substitution matrix series and otherwise all default parameters. This alignment was hand-pruned to remove sequences that were significantly shorter than E. coli NikR or that introduced large gaps into the alignment. The resulting sequences were re-aligned with CLUSTALW. Sequences were removed from this alignment if they did not have the His76, His87, His89, and Cys95 (E. coli NikR numbering) Ni2+ binding residues. The remaining sequences were re-aligned as above and the resulting MSA was further pruned such that no pair of sequences was greater than 80% identical, followed by an additional realignment. This process yielded a final MSA containing 82 sequences with an average sequence identity of 30.3%. The final MSA was used as input for the web-based Scorecons program (http://www.ebi.ac.uk/thornton-srv/databases/cgi-bin/valdar/scorecons_server.pl)82 to calculate the positional conservation score for each position in the MSA. The valdar01 scoring method was used with the BLOSUM45 substitution matrix. The positional sequence conservation values are reported in parentheses in Table 2 under the “Sequence Conservation” heading. Each position was then assigned a “high” (≥ 0.6), “moderate” (0.45 – 0.59), or “low” (≤0.44) level of sequence conservation.
Supplementary Material
Acknowledgments
This work was supported by NSF grant MCB-0520877, by an NSF Graduate Research Fellowship to MJB, and by the Molecular Biophysics Training Grant (T32 GM008492). We thank Eric Schreiter (now at the University of Puerto Rico) for providing an initial apo NikR structure with missing backbone density built in by symmetry; Rohit Pappu and Matt Wyczalkowski for helpful suggestions about simulation analysis and bootstrap methodology. We would also like to thank the anonymous reviewers for their helpful comments.
Footnotes
Hereafter, discussion of NikR in this manuscript refers to the E. coli protein, unless otherwise noted.
Publisher's Disclaimer: This is a PDF file of an unedited manuscript that has been accepted for publication. As a service to our customers we are providing this early version of the manuscript. The manuscript will undergo copyediting, typesetting, and review of the resulting proof before it is published in its final citable form. Please note that during the production process errors may be discovered which could affect the content, and all legal disclaimers that apply to the journal pertain.
References
- 1.Vignais PM, Billoud B, Meyer J. Classification and phylogeny of hydrogenases. FEMS Microbiol Rev. 2001;25:455–501. doi: 10.1111/j.1574-6976.2001.tb00587.x. [DOI] [PubMed] [Google Scholar]
- 2.Navarro C, Wu LF, Mandrand-Berthelot MA. The nik operon of Eschericia coli encodes a periplasmic binding-protein-dependent transport system for nickel. Mol Microbiol. 1993;9:1181–1191. doi: 10.1111/j.1365-2958.1993.tb01247.x. [DOI] [PubMed] [Google Scholar]
- 3.De Pina K, Desjardin V, Mandrand-Berthelot MA, Giordano G, Wu LF. Isolation and Characterization of the nikR Gene Encoding a Nickel-Responsive Regulator in Escherichia coli. J Bacteriol. 1999;181:670–4. doi: 10.1128/jb.181.2.670-674.1999. [DOI] [PMC free article] [PubMed] [Google Scholar]
- 4.Chivers PT, Sauer RT. Regulation of high affinity nickel uptake in bacteria. Ni2+-Dependent interaction of NikR with wild-type and mutant operator sites. J Biol Chem. 2000;275:19735–41. doi: 10.1074/jbc.M002232200. [DOI] [PubMed] [Google Scholar]
- 5.Iwig JS, Rowe JL, Chivers PT. Nickel homeostasis in Escherichia coli – the rcnR-rcnA efflux pathway and its linkage to NikR function. Molecular Microbiology. 2006;62:252–62. doi: 10.1111/j.1365-2958.2006.05369.x. [DOI] [PubMed] [Google Scholar]
- 6.Schreiter ER, Sintchak MD, Guo Y, Chivers PT, Sauer RT, Drennan CL. Crystal structure of the nickel-responsive transcription factor NikR. Nature Structural Biology. 2003;10:794–9. doi: 10.1038/nsb985. [DOI] [PubMed] [Google Scholar]
- 7.Chivers PT, Sauer RT. NikR is a ribbon-helix-helix DNA-binding protein. Protein Sci. 1999;8:2494–500. doi: 10.1110/ps.8.11.2494. [DOI] [PMC free article] [PubMed] [Google Scholar]
- 8.Schreiter ER, Drennan CL. Ribbon-helix-helix transcription factors: variations on a theme. Nat Rev Microbiol. 2007;5:710–20. doi: 10.1038/nrmicro1717. [DOI] [PubMed] [Google Scholar]
- 9.Chivers PT, Sauer RT. NikR repressor: high-affinity nickel binding to the C-terminal domain regulates binding to operator DNA. Chem Biol. 2002;9:1141–8. doi: 10.1016/s1074-5521(02)00241-7. [DOI] [PubMed] [Google Scholar]
- 10.Wang SC, Dias AV, Bloom SL, Zamble DB. Selectivity of Metal Binding and Metal-Induced Stability of Escherichia coli NikR. Biochemistry. 2004;43:10018–28. doi: 10.1021/bi049405c. [DOI] [PubMed] [Google Scholar]
- 11.Grant GA. The ACT domain: a small molecule binding domain and its role as a common regulatory element. J Biol Chem. 2006;281:33825–9. doi: 10.1074/jbc.R600024200. [DOI] [PubMed] [Google Scholar]
- 12.Rowe JL, Starnes GL, Chivers PT. Complex Transcriptional Control Links NikABCDE-Dependent Nickel Transport with Hydrogenase Expression in Escherichia coli. Journal of Bacteriology. 2005;187:6317–23. doi: 10.1128/JB.187.18.6317-6323.2005. [DOI] [PMC free article] [PubMed] [Google Scholar]
- 13.Bloom SL, Zamble DB. Metal-Selective DNA-Binding Response of Escherichia coli NikR. Biochemistry. 2004;43:10029–38. doi: 10.1021/bi049404k. [DOI] [PubMed] [Google Scholar]
- 14.Dias AV, Zamble DB. Protease digestion analysis of Escherichia coli NikR: evidence for conformational stabilization with Ni(II) J Biol Inorg Chem. 2005;10:605–12. doi: 10.1007/s00775-005-0008-2. [DOI] [PubMed] [Google Scholar]
- 15.Leitch S, Bradley MJ, Rowe JL, Chivers PT, Maroney MJ. Nickel-specific response in the transcriptional regulator, Escherichia coli NikR. J Am Chem Soc. 2007;129:5085–95. doi: 10.1021/ja068505y. [DOI] [PubMed] [Google Scholar]
- 16.Carrington PE, Chivers PT, Al-Mjeni F, Sauer RT, Maroney MJ. Nickel coordination is regulated by the DNA-bound state of NikR. Nature Structural Biology. 2003;10:126–30. doi: 10.1038/nsb890. [DOI] [PubMed] [Google Scholar]
- 17.Schreiter ER, Wang SC, Zamble DB, Drennan CL. NikR-operator complex structure and the mechanism of repressor activation by metal ions. Proceedings of the National Academy of Sciences of the United States of America. 2006;103:13676–81. doi: 10.1073/pnas.0606247103. [DOI] [PMC free article] [PubMed] [Google Scholar]
- 18.Dian C, Schauer K, Kapp U, McSweeney SM, Labigne A, Terradot L. Structural basis of the nickel response in Helicobacter pylori: crystal structures of HpNikR in Apo and nickel-bound states. J Mol Biol. 2006;361:715–30. doi: 10.1016/j.jmb.2006.06.058. [DOI] [PubMed] [Google Scholar]
- 19.Chivers PT, Tahirov TH. Structure of Pyrococus horikoshii NikR: nickel sensing and implications for the regulation of DNA recognition. Journal of Molecular Biology. 2005;348:597–607. doi: 10.1016/j.jmb.2005.03.017. [DOI] [PubMed] [Google Scholar]
- 20.Raumann BE, Rould MA, Pabo CO, Sauer RT. DNA recognition by beta-sheets in the Arc repressor-operator crystal structure. Nature. 1994;367:754–7. doi: 10.1038/367754a0. [DOI] [PubMed] [Google Scholar]
- 21.Sauer RT, Milla ME, Waldburger CD, Brown BM, Schildbach JF. Sequence determinants of folding and stability for the P22 Arc repressor dimer. Faseb J. 1996;10:42–8. doi: 10.1096/fasebj.10.1.8566546. [DOI] [PubMed] [Google Scholar]
- 22.Brown BM, Milla ME, Smith TL, Sauer RT. Scanning mutagenesis of the Arc repressor as a functional probe of operator recognition. Nature Structural Biology. 1994;1:164–8. doi: 10.1038/nsb0394-164. [DOI] [PubMed] [Google Scholar]
- 23.Cui G, Merz KM. The Intrinsic Dynamics and Function of Nickel Binding Regulatory Protein: Insights from Elastic Network Analysis. Biophysical Journal. doi: 10.1529/biophysj.107.115576. in press. [DOI] [PMC free article] [PubMed] [Google Scholar]
- 24.Volkman BF, Lipson D, Wemmer DE, Kern D. Two-state allosteric behavior in a single-domain signaling protein. Science. 2001;291:2429–33. doi: 10.1126/science.291.5512.2429. [DOI] [PubMed] [Google Scholar]
- 25.Pan H, Lee JC, Hilser VJ. Binding sites in Escherichia coli dihydrofolate reductase communicate by modulating the conformational ensemble. Proc Natl Acad Sci USA. 2000;97:12020–5. doi: 10.1073/pnas.220240297. [DOI] [PMC free article] [PubMed] [Google Scholar]
- 26.Formaneck MS, Ma L, Cui Q. Reconciling the “old” and “new” views of protein allostery: A molecular simulation study of chemotaxis Y protein (CheY) Proteins. 2006;63:846–67. doi: 10.1002/prot.20893. [DOI] [PubMed] [Google Scholar]
- 27.Ghosh A, Vishveshwara S. A study of communication pathways in methionyl- tRNA synthetase by molecular dynamics simulations and structure network analysis. Proceedings of the National Academy of Sciences of the United States of America. 104:15711–6. doi: 10.1073/pnas.0704459104. in press. [DOI] [PMC free article] [PubMed] [Google Scholar]
- 28.Swain JF, Gierasch LM. The changing landscape of protein allostery. Curr Opin Struct Biol. 2006;16:102–8. doi: 10.1016/j.sbi.2006.01.003. [DOI] [PubMed] [Google Scholar]
- 29.Velyvis A, Yang YR, Schachman HK, Kay LE. A solution NMR study showing that active site ligands and nucleotides directly perturb the allosteric equilibrium in aspartate transcarbamoylase. Proc Natl Acad Sci USA. 2007;104:8815–20. doi: 10.1073/pnas.0703347104. [DOI] [PMC free article] [PubMed] [Google Scholar]
- 30.Chennubhotla C, Bahar I. Signal propagation in proteins and relation to equilibrium fluctuations. PLoS Comput Biol. 2007;3:e172. doi: 10.1371/journal.pcbi.0030172. [DOI] [PMC free article] [PubMed] [Google Scholar]
- 31.Tobi D, Bahar I. Structural changes involved in protein binding correlate with intrinsic motions of proteins in the unbound state. Proc Natl Acad Sci USA. 2005;102:18908–13. doi: 10.1073/pnas.0507603102. [DOI] [PMC free article] [PubMed] [Google Scholar]
- 32.Kubo R. The fluctuation-dissipation theorem. Rep Prog Phys. 1966;29:255–84. [Google Scholar]
- 33.Radkiewicz JL, Brooks CL., III Protein Dynamics in Enzymatic Catalysis: Exploration of Dihydrofolate Reductase. J Am Chem Soc. 2000;122:225–31. [Google Scholar]
- 34.Ma J, Sigler PB, Xu Z, Karplus M. A dynamic model for the allosteric mechanism of GroEL. J Mol Biol. 2000;302:303–13. doi: 10.1006/jmbi.2000.4014. [DOI] [PubMed] [Google Scholar]
- 35.Tai K, Shen T, Borjesson U, Philippopoulos M, McCammon JA. Analysis of a 10-ns molecular dynamics simulation of mouse acetylcholinesterase. Biophys J. 2001;81:715–24. doi: 10.1016/S0006-3495(01)75736-0. [DOI] [PMC free article] [PubMed] [Google Scholar]
- 36.Perryman AL, Lin J-H, McCammon JA. HIV-1 protease molecular dynamics of a wild-type and of the V82F/I84V mutant: Possible contributions to drug resistance and a potential new target site for drugs. Protein Sci. 2004;13:1108–23. doi: 10.1110/ps.03468904. [DOI] [PMC free article] [PubMed] [Google Scholar]
- 37.Forrest LR, Kukol A, Arkin IT, Tieleman DP, Sansom MSP. Exploring models of influenza A M2 channel: MD simulations in a phospholipid bilayer. Biophys J. 2000;78:55–69. doi: 10.1016/s0006-3495(00)76572-6. [DOI] [PMC free article] [PubMed] [Google Scholar]
- 38.Gullingsrud J, Kosztin D, Schulten K. Structural determinants of MscL gating studied by molecular dynamics simulations. Biophys J. 2001;80:2074–81. doi: 10.1016/S0006-3495(01)76181-4. [DOI] [PMC free article] [PubMed] [Google Scholar]
- 39.Kabsch W, Sander C. DSSP: definition of secondary structure of proteins given a set of 3D coordinates. Biopolymers. 1983;22:2577–2637. doi: 10.1002/bip.360221211. [DOI] [PubMed] [Google Scholar]
- 40.Case DA, Cheatham TE, Darden T, Gohlke H, Luo R, Merz KM, Onufriev A, Simmerling C, Wang B, Woods RJ. The Amber biomolecular simulation programs. J Comput Chem. 2005;26:1668–88. doi: 10.1002/jcc.20290. [DOI] [PMC free article] [PubMed] [Google Scholar]
- 41.Hayward S, Kitao A, Go N. Harmonicity and anharmonicity in protein dynamics: a normal mode analysis and principal component analysis. Proteins. 1995;23:177–86. doi: 10.1002/prot.340230207. [DOI] [PubMed] [Google Scholar]
- 42.Garcia AE. Large-Amplitude Nonlinear Motions in Proteins. Phys Rev Lett. 1992;68:2696–9. doi: 10.1103/PhysRevLett.68.2696. [DOI] [PubMed] [Google Scholar]
- 43.Leach AR. Molecular modelling principles and applications. 2. Pearson Education Limited; Essex, UK: 2001. [Google Scholar]
- 44.Levy RM, Srinivasan AR, Olson WK, McCammon JA. Quasi-harmonic method for studying very low frequency modes in proteins. Biopolymers. 1984;23:1099–112. doi: 10.1002/bip.360230610. [DOI] [PubMed] [Google Scholar]
- 45.Rod TH, Radkiewicz JL, Brooks CL., III Correlated motion and the effect of distal mutations in dihydrofolate reductase. Proc Natl Acad Sci USA. 2003;100:6980–85. doi: 10.1073/pnas.1230801100. [DOI] [PMC free article] [PubMed] [Google Scholar]
- 46.Cheng X, Ivanov I, Wang H, Sine SM, McCammon JA. Nanosecond time scale conformational dynamics of the human alpha7 nicotinic acetylcholine receptor. Biophys J. 2007 doi: 10.1529/biophysj.107.109843. Epub. [DOI] [PMC free article] [PubMed] [Google Scholar]
- 47.Daily MD, Upadhyaya TJ, Gray JJ. Contact rearrangements form coupled networks from local motions in allosteric proteins. Proteins. 2007 doi: 10.1002/prot.21800. Epub. [DOI] [PMC free article] [PubMed] [Google Scholar]
- 48.Monod J, Wyman J, Changeux JP. On the nature of allosteric transitions: A plausible model. J Mol Biol. 1965;12:88–118. doi: 10.1016/s0022-2836(65)80285-6. [DOI] [PubMed] [Google Scholar]
- 49.Arora K, Brooks CL., III Large-scale allosteric conformational transitions of adenylate kinase appear to involve a population-shift mechanism. Proc Natl Acad Sci USA. 2007;104:18496–18501. doi: 10.1073/pnas.0706443104. [DOI] [PMC free article] [PubMed] [Google Scholar]
- 50.Schuller D, Grant GA, Banaszak L. Crystal structure reveals the allosteric ligand site in the Vmax-type cooperative enzyme: D-3-phosphoglycerate dehydrogenase. Nat Struct Biol. 1995;2:69–76. doi: 10.1038/nsb0195-69. [DOI] [PubMed] [Google Scholar]
- 51.Bell JK, Grant GA, Banaszak L. Multiconformational states in phosphoglycerate dehydrogenase. Biochemistry. 2004;43:3450–8. doi: 10.1021/bi035462e. [DOI] [PubMed] [Google Scholar]
- 52.Thompson JR, Bell JK, Bratt J, Grant GA, Banaszak L. Vmax regulation through domain and subunit changes. The active form of phosphoglycerate dehydrogenase. Biochemistry. 2005;44:5763–73. doi: 10.1021/bi047944b. [DOI] [PubMed] [Google Scholar]
- 53.Grant GA, Hu Z, Xu XL. Identification of amino acid residues contributing to the mechanism of cooperativity in calculating conformational energies of organic and biological molecules? J Comp Chem. 2005;21:1049–1074. [Google Scholar]
- 54.Hall BM, LeFevre KR, Cordes MHJ. Sequence Correlations between Cro Recognition Helices and Cognate OR Consensus Half-sites Suggest Conserved Rules of Protein–DNA Recognition. Journal of Molecular Biology. 2005;350:667–81. doi: 10.1016/j.jmb.2005.05.025. [DOI] [PubMed] [Google Scholar]
- 55.Kang SG, Saven JG. Computational protein design: structure, function and combinatorial diversity. Current Opinion in Chemical Biology. 2007;11:329–34. doi: 10.1016/j.cbpa.2007.05.006. [DOI] [PubMed] [Google Scholar]
- 56.Shrivastava I, Bahar I. Common Mechanism of Pore Opening Shared by Five Different Potassium Channels. Biophysical Journal. 2006;90:3929–40. doi: 10.1529/biophysj.105.080093. [DOI] [PMC free article] [PubMed] [Google Scholar]
- 57.Dima RI, Thirumalai D. Determination of network of residues that regulate allostery in protein families using sequence analysis. Protein Science. 2006;15:258–68. doi: 10.1110/ps.051767306. [DOI] [PMC free article] [PubMed] [Google Scholar]
- 58.del Sol A, Fujihashi H, Amoros D, Nussinov R. Residues crucial for maintaining short paths in network communication mediate signaling in proteins. Molecular Systems Biology. 2006;2 doi: 10.1038/msb4100063. 2006.0019. [DOI] [PMC free article] [PubMed] [Google Scholar]
- 59.Scrutton NS, Deonorain MP, Berry A, Perham RN. Cooperativity induced by a single mutation at the subunit interface of a dimeric enzyme: glutathione reductase. Science. 1992;258:1140–3. doi: 10.1126/science.1439821. [DOI] [PubMed] [Google Scholar]
- 60.Kuo LC, Zambidis I, Caron C. Triggering of allostery in an enzyme by a point mutation: ornithine transcarbamoylase. Science. 1989;245:522–4. doi: 10.1126/science.2667139. [DOI] [PubMed] [Google Scholar]
- 61.Heddle JG, Okajima T, Scott DJ, Akashi S, Park SY, Tame JRH. Dynamic Allostery in the Ring Protein TRAP. Journal of Molecular Biology. 2007;371:154–67. doi: 10.1016/j.jmb.2007.05.013. [DOI] [PubMed] [Google Scholar]
- 62.Pearlman DA, Case DA, Caldwell JW, Ross WS, Cheatham TE, Debolt S, Ferguson D, Siebel G, Kollman PA. Amber, a package of computer-programs for applying molecular mechanics, normal-mode analysis, molecular-dynamics and free-energy calculations to simulate the structural and energetic properties of molecules. Comput Phys Commun. 1995;91:1–41. [Google Scholar]
- 63.Wang J, Cieplak P, Kollman PA. How well does a restrained electrostatic potential (RESP) model perform in calculating conformational energies of organic and biological molecules? J Comp Chem. 2000;21:1049–1074. [Google Scholar]
- 64.Vriend G. WHAT IF: A molecular modeling and drug design program. J Mol Graph. 1990;8:52–56. doi: 10.1016/0263-7855(90)80070-v. [DOI] [PubMed] [Google Scholar]
- 65.Jorgensen W, Chandrasekhar J, Madura J. Comparison of simple potential functions for simulating liquid water. J Chem Phys. 1983;79:926–35. [Google Scholar]
- 66.Berendsen HJC, Postma JPM, van Gunsteren WF, DiNola A, Haak JR. Molecular dynamics with coupling to an external bath. J Chem Phys. 1984;81:3684–90. [Google Scholar]
- 67.Ryckaert JP, Ciccotti G, Berendsen HJC. Numerical integration of the Cartesian equations of motion of a system with contraints: molecular dynamics of n-alkanes. J Comput Phys. 1977;23:327–41. [Google Scholar]
- 68.Amadei A, Linssen ABM, Berendsen HJC. Essential dynamics of proteins. Proteins. 1993;17:412–25. doi: 10.1002/prot.340170408. [DOI] [PubMed] [Google Scholar]
- 69.Doruker P, Atilgan AR, Bahar I. Dynamics of proteins predicted by molecular dynamics simulations and analytical approaches: Application to alpha-amylase inhibitor. Proteins. 2000;40:512–24. [PubMed] [Google Scholar]
- 70.Plaku E, Stamati H, Clementi C, Kavraki L. Fast and reliable analysis of molecular motion using proximity relations and dimensionality reduction. Proteins. 2007;67:897–907. doi: 10.1002/prot.21337. [DOI] [PubMed] [Google Scholar]
- 71.Sneath PHA, Sokal RR. Numerical taxonomy. W.H. Freeman and Company; San Francisco, CA: 1973. [Google Scholar]
- 72.Durbin R, Eddy S, Krogh A, Mitchinson G. Biological Sequence Analysis: Probabilistic Models of Proteins and Nucleic Acids. Cambridge University Press; New York: 1998. [Google Scholar]
- 73.Ichiye T, Karplus M. Collective motions in proteins: A covariance analysis of atomic fluctuations in molecular dynamics and normal mode simulations. Proteins. 1991;11:205–17. doi: 10.1002/prot.340110305. [DOI] [PubMed] [Google Scholar]
- 74.Bailey NTJ. Statistical methods in biology. 3. Cambridge University Press; Cambridge, UK: 1995. [Google Scholar]
- 75.Falk R, Well AD. Many faces of the correlation coefficient. J Stat Ed. 1997;5 [Online] [Google Scholar]
- 76.Dolinsky TJ, Nielsen JE, McCammon JA, Baker NA. PDB2PQR: an automated pipeline for the setup, execution, and analysis of Poisson-Boltzman electrostatics calculations. Nucleic Acids Res. 2004;32:W665–W667. doi: 10.1093/nar/gkh381. [DOI] [PMC free article] [PubMed] [Google Scholar]
- 77.Mezei M, Beveridge DL. Theoretical studies of hydrogen bonding in liquid water and dilute aqueous solutions. J Chem Phys. 1981;74:622–32. [Google Scholar]
- 78.Barlow DJ, Thornton JM. Ion-pairs in proteins. J Mol Biol. 1983;168:867–85. doi: 10.1016/s0022-2836(83)80079-5. [DOI] [PubMed] [Google Scholar]
- 79.Bruning JL, Kintz BL. Computational handbook of statistics. 4. Addison Wesley Longman, Inc.; Reading, MA USA: 1997. [Google Scholar]
- 80.Altschul SF, Madden TL, Schaffer AA, Zhang J, Zhang Z, Miller W, Lipman DJ. Gapped BLAST and PSI-BLAST: a new generation of protein database search programs. Nucleic Acids Res. 1997;25:3389–3402. doi: 10.1093/nar/25.17.3389. [DOI] [PMC free article] [PubMed] [Google Scholar]
- 81.Thompson JD, Higgins DG, Gibson TJ. CLUSTALW: improving the sensitivity of progressive multiple sequence alignment through sequence weighting, position-specific gap penalities and weight matrix choice. Nucleic Acids Res. 1994;22:4673–80. doi: 10.1093/nar/22.22.4673. [DOI] [PMC free article] [PubMed] [Google Scholar]
- 82.Valdar WSJ. Scoring residue conservation. Proteins. 2002;48:277–41. doi: 10.1002/prot.10146. [DOI] [PubMed] [Google Scholar]
- 83.Crooks GE, Brenner SE. Protein secondary structure: entropy, correlations and prediction. Bioinformatics. 2004;20:1603–11. doi: 10.1093/bioinformatics/bth132. [DOI] [PubMed] [Google Scholar]
- 84.Crooks GE, Hon G, Chandonia JM, Brenner SE. WebLogo: A Sequence Logo Generator. Genome Research. 2004;14:1188–90. doi: 10.1101/gr.849004. [DOI] [PMC free article] [PubMed] [Google Scholar]
Associated Data
This section collects any data citations, data availability statements, or supplementary materials included in this article.


