

Abstract
Cell adhesion mechanically couples cells to surfaces. The durability of individual bonds between the adhesive receptors and their ligands in the presence of forces determines the cellular adhesion strength. For adhesive receptors such as integrins, it is a common paradigm that the cell regulates its adhesion strength by altering the affinity state of the receptors. However, the probability distribution of rupture forces is dependent not only on the affinity of individual receptor-ligand bonds but also on the mechanical compliance of the cellular anchorage of the receptor. Hence, by altering the anchorage, the cell can regulate its adhesion strength without changing the affinity of the receptor. Here, we analyze the anchorage of the integrin VLA-4 with its ligand VCAM-1. For this purpose, we develop a model based on the Kelvin body, which allows one to quantify the mechanical properties of the adhesive receptor's anchorage using atomic force microscopy on living cells. As we demonstrate, the measured force curves give valuable insight into the mechanics of the cellular anchorage of the receptor, which is described by the tether stiffness, the membrane rigidity, and the membrane viscosity. The measurements relate to a tether stiffness of kt = 1.6 μN/m, an initial membrane rigidity of ki = 260 μN/m, and a viscosity of μ = 5.9 μN·s/m. Integrins exist in different activation states. When activating the integrin with Mg2+, we observe altered viscoelastic parameters of kt = 0.9 μN/m, ki = 190 μN/m, and μ = 6.0 μ N·s/m. Based on our model, we postulate that anchorage-related effects are common regulating mechanisms for cellular adhesion beyond affinity regulation.
INTRODUCTION
Cell-to-surface or cell-to-cell adhesion is of critical importance for a large variety of cellular events. It is fundamental in homing of T-lymphocytes and in cancer metastasis. During homing, the T-lymphocytes experience shear stress of the blood stream and adhere against external forces. The adhesiveness of cells is tightly regulated and involves a variety of force-resisting receptors such as selectins and integrins. Our understanding of how different conformational states of integrins relate to different adhesion properties has been greatly improved by a combined effort of structural and cell biologists (1,2). Although the focus has been on conformational switching between affinity states, the influence of cytoskeletal anchorage as well as of integrin clustering has also been investigated (3–5). The latter events change the mechanical environment of the receptor (6). It is conceivable that changing the receptor's cellular anchorage influences the adhesive behavior of the cell against external forces, even without changing the equilibrium affinity of the receptor to its ligand (7).
We focus here on the anchorage of the integrin VLA-4 in Jurkat cells. VLA-4 is one of the key adhesive receptors on T-lymphocytes and is involved in both lymphocyte rolling and arrest (6,8). In our experimental setup, the VLA-4 receptor serves as a local nanoprobe to investigate the viscoelasticity of its environment. For using a single receptor as a probe for its environment, single-molecule techniques are required. Atomic force spectroscopy (AFM) is ideally suited to probe cell adhesion events on the level of individual molecules. It is capable of measuring and analyzing single receptor-ligand bonds on living cells under physiological conditions (9–12). Usually, AFM on cells has been employed to analyze the distribution of rupture forces of a given receptor-ligand pair (12–16). From this, one gets important insight on the energy landscape of the respective bond (16,17). Yet, the AFM data contain more information than only the rupture forces. The history of force development up to the point of cell-to-surface bond breakage is measured with high precision when retracting cells from adhesive surfaces (Fig. 1). This force-distance relationship is dictated by the energy landscape of the receptor-ligand bond but also includes the mechanical anchorage of the receptor in the cellular membrane. Thoroughly analyzing the force development can therefore reveal the mechanical properties of the anchorage. As noted earlier (12,18–22), the force-distance curves correspond to microvillus stretching and membrane tether pulling. Membrane tethers are small membrane tubes with a diameter on the order of tens of nanometers, which are fed from the membrane reservoir of the cell when pulled out. The force-distance relationship of pulling tethers has the characteristics of viscoelastic solids (22). Thus, the interpretation of the force curves should follow models that describe the viscoelasticity of cells. One well-established model for viscoelastic bodies is the Kelvin body (Fig. 2) (23–25). We show that the cell behaves like a Kelvin body under our experimental conditions. Hence, we can use VLA-4 expressed on Jurkat cells as a nanoprobe for the viscoelastic properties of the cellular anchorage in vicinity to this receptor.
FIGURE 1.

Experimental setup. The cell is pushed onto a surface and then retracted (a). The force-distance curve is recorded with piconewton precision. (b) A typical series of subsequent force curves is shown. A Jurkat cell immobilized on the cantilever was retracted from a VCAM-1 coated surface after 100 ms contacts at an indentation force of 50 pN. The right tail (up to 15 μm, cut at 4 μm here) of the curves was used to correct for drift and to determine the zero force level. For the tether model, only ruptures with tether lengths >300 nm were taken. From top to bottom: double rupture (evaluated as adhesion); short rupture (evaluated as adhesion); double rupture (evaluated as adhesion); no ruptures (evaluated as no adhesion); single rupture (evaluated as adhesion and for the tether model); no ruptures (evaluated as no adhesion); single rupture (evaluated as adhesion and for the tether model). Seven no adhesion force curves between the first three curves are omitted in the graph. Two regimes with different slopes are especially recognized in the tether rupture (dashed lines).
FIGURE 2.

(a) Mechanical model for cells. The Kelvin body consists of a spring with spring constant kt representing the tether stiffness, and parallel to this spring a series of a second spring with spring constant ki representing the bending rigidity of the membrane and a dashpot with viscosity μ. The Voigt and the Maxwell bodies are simplifications of the Kelvin body. (b) Fit to a typical force curve. Shown are the fits of the different models to a typical force curve.
To investigate changes in the environment of force-resisting receptors, we tested two different conditions: integrins on cells in a physiological buffer and integrins on cells in a buffer that is known to artificially activate integrins (26). Mechanical differences in the anchorage between these two setups are possible: for resting cells in physiological buffer, the vast majority of integrins is kept in an inactive state and is not available for binding. This allows the immune cell to circulate freely in the blood stream. Due to both statistical fluctuations and the requirement to probe the vessel wall, a small subset of integrins is nevertheless always in a binding competent state. These integrins have been postulated to be distributed to the proximity of lipid rafts (27–29), which are thought to be stiffer than the average lipid bilayer membrane.
When artificially activating the integrins with an activating buffer, nearly all integrins become binding competent. Therefore, after artificial activation, the majority of the binding competent integrins will not be located in the proximity of lipid rafts but distributed all over the cell. Therefore, we expect to measure a differing nanoenvironment. Here, we show that the average nanoenvironment of Mg2+-activated integrin receptors is indeed different from the nanoenvironment of resting receptors. Further on, from the force-distance relationship obtained from the Kelvin body model, we analytically determine the compliance of membrane tethers. The compliance describes the elastic response of the cell to external forces (30). The compliance is also fundamentally determining the distribution of rupture forces (7). The knowledge of the compliance allows us to gauge the influence of the rheological parameters on this distribution of rupture forces, which directly influences the force persistence of the cell-to-surface adhesion.
In summary, we have developed a model for the description of force-distance curves derived from cellular AFM measurements. We show that we can detect subtle differences in the membrane environment of the receptors. We conclude that the anchorage of receptors in the cellular membrane can be used as a regulator of receptor adhesiveness, without the need to change the receptor conformation. Hence, the cell can regulate its adhesiveness by altering the receptor anchorage on top of modulating the affinity of the receptor to its ligand through conformational changes.
MATERIALS AND METHODS
Reagents
Bovine serum albumin (BSA; fraction V), human serum albumin (HSA; fraction V), and Ca2+/Mg2+-free Hank's balanced salt solution (HBSS) were purchased from Sigma-Aldrich (St. Louis, MO). BIO1211 was a gift from Blake Pepinsky (Biogen, Cambridge, MA). Recombinant human VCAM-1 (seven domains), recombinant human SDF-1α, and anti-human CD43mAb were obtained from R&D Systems (Minneapolis, MN).
Surface preparation
To prepare the substrate for the AFM experiment, spots were incubated on the lid of a petri dish with 0.0125 μg/ml or 0.025 μg/ml VCAM-1 and 2 μg/ml HSA as carrier protein together with a heat-inactivated chemokine as inert spacer (8,15). The site densities of VCAM-1 were equivalent to 50 sites/μm2 and 100 sites/μm2, respectively (8). After adsorption overnight at 4°C, the spots were washed four times with phosphate-buffered saline (Ca2+/Mg2+-free) and quenched with 2% HSA in phosphate-buffered saline for >60 min at 4°C.
Cell culture
Jurkat cells were cultured in RPMI1640 medium (Biochrom, Berlin, Germany) supplemented with 10% heat-inactivated fetal calf serum, 2 mM L-glutamine, and penicillin/streptomycin in 5% CO2 at 37°C. The cells were washed with 5 mM EDTA and then transferred to HBSS medium (2 mg/ml BSA, 10 mM HEPES, 1 mM of CaCl2 and MgCl2 or 5 mM MgCl2 and no Ca2+).
AFM measurements
All experiments were conducted at 36°C ± 1°C in HBSS medium as described (9). The spring constant of the cantilever was determined by the thermal fluctuation method (31,32). One leg was broken from the C Lever (Park Scientific Instruments, Sunnyvale, CA), and the tip was snapped. Thirty minutes before the experiment, the cantilever was incubated with 0.1 mg/ml of anti-human CD43mAb at room temperature. A cell was attached to the cantilever, positioned over the VCAM-1 spot, and pressed onto the coated petri dish for 300 ms at ∼50 pN. Then, the cantilever with the cell was retracted from the surface at a velocity of 3.6 μm/s. This lies within the range of physiological velocities for lymphocytes in the blood stream (33). Two setups were tested: in one setup, physiological buffer conditions with 1 mMCa2+/Mg2+ were used, in the second setup, the integrins were artificially activated (26) by a buffer with 5 mM Mg2+ in the absence of Ca2+. Then, 50–100 force-distance curves were registered per cell and at eight cells per setup were probed (Table 1). Controls to test the specificity of the interactions were performed on an uncoated petri dish and by adding BIO1211 in experiments on VCAM-1 coated substrates. At a concentration of 1 μg/ml, this peptidomimetic blocks binding (34). BIO1211 was added 10 min before the measurement.
TABLE 1.
Number of cells and force curves analyzed
| Number of cells | Total number of curves | Number of adhesions | Adhesion rate | Number of fitted curves | |
|---|---|---|---|---|---|
| 1 mM Ca2+/Mg2+ | 8 | 749 | 195 | 26% | 172 |
| 5 mM Mg2+ | 8 | 778 | 303 | 39% | 278 |
| BSA | 4 | 170 | 7 | 4% | – |
| BIO1211 | 7 | 380 | 30 | 8% | – |
Mechanical models
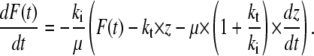
The force-distance relationships of the three standard viscoelastic models (Maxwell body, Voigt body, Kelvin body; Fig. 2) have been tested for the condition of a constant retract velocity. The Maxwell body and the Voigt body can be regarded as special cases of the third model, the Kelvin body. For the analysis of our data, we transformed the differential equation for the Kelvin body into a time dependency of the force under the boundary condition of a constant retraction velocity. This yields (23)
 |
(1) |
Here, F(t) is the force depending on the time, ki is the spring constant of the spring in series to the dashpot, μ is the viscosity of the dashpot, and kt is the spring constant of the spring parallel to the dashpot. If the retract velocity  is constant, the time t can be expressed in terms of the position z as
  With the boundary condition
  Eq. 1 can be integrated to
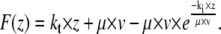 |
(2) |
With this equation, we fitted all force curves having a single rupture event and obtained distributions for the viscoelastic parameters. For fitting, all parameters were restrained to be larger than zero. We tested the significance of the differences between the two setups with the Mann-Whitney U-test.
Simulation of the force distributions
To test the quality of our model to describe the viscoelastic anchorage of molecular bonds under external load, we calculated the expected force distribution from the measured rupture length distribution. To this end, we used the measured viscoelastic parameters and recalculated the distribution of rupture forces from the measured distribution of rupture length using Eq. 2. To better simulate the experimental conditions, we added a random force noise of ±8 pN.
RESULTS AND DISCUSSION
Specificity of adhesion of our measurements
To be in the single-molecule regime, adhesion rates on the order of 30% are required (9). The adhesion rates are 26% under resting conditions and 39% under activating conditions (Table 1); these rates are in the desired range and demonstrate that the activation of integrins leads to increased adhesion. Recently, it has been argued that it is highly nontrivial to pull tethers from specific contacts (35) as opposed to nonspecific contacts. Since the surface is only adhesive if functionalized with VCAM-1 and since the cellular adhesion can be blocked by the specific integrin blocker BIO1211 (Fig. 3), we ensured the integrin-mediated specificity of the cell-to-surface adhesion. Moreover, to guarantee that we are in a single-molecule regime, we used a highly diluted ligand density of only 50–100 sites/μm2. At this density, the average distance between the ligands is larger than the average diameter of a microvillus of 100 nm (36).
FIGURE 3.

Specificity of adhesion. Although surfaces functionalized with VCAM-1 have adhesion rates of ≥25%, the unspecific adhesion either after blocking or at surfaces functionalized only with BSA is ≤8%, demonstrating the specificity of the measured interactions. Mg2+ was not added when blocking with BIO1211.
Mechanical models for viscoelastic bodies
Three simple models are common for the description of viscoelastic bodies, the Maxwell body, the Voigt body, and the Kelvin body (Fig. 2) (25). The Kelvin body consists of a spring with spring constant kt parallel to a series of a dashpot with viscosity μ and a second spring with spring constant ki. In our setup, the first spring with spring constant kt describes the stiffness of the membrane tether pulled from the cell membrane; the second spring describes the bending rigidity of the cellular membrane, and the dashpot represents the viscous contribution of the receptor-anchoring membrane. The Voigt and the Maxwell bodies are special cases of the Kelvin body, with  for the Maxwell body and
  for the Voigt body. Fitting a typical force curve with Eq. 2 reveals that only the Kelvin body is a good model for the description of our force-distance relationship (Fig. 2). By fitting our data, we can analyze the nanoviscoelastic properties ki, kt, and μ in the vicinity of the receptor. Due to the higher number of free parameters, the Kelvin model naturally fits the force curves better. Yet, from a biophysical point of view, it is also important to include a spring modeling tether stiffness, as it has also been shown that static tethers without a viscous contribution act like a spring with a certain spring constant (22), which cannot be modeled in a Maxwell body.
The viscoelastic parameters of the cellular membrane
We measured the cellular adhesion mediated by the interaction of the integrin VLA-4 with VCAM-1 both under physiological conditions and under the integrin-activating condition of 5 mM Mg2+ in the absence of Ca2+. Only force curves with single rupture events were taken into account. Each single rupture was fitted according to Eq. 2. From the median of the distributions of the fit parameters, we determined the respective parameter value. Since the values are potentially dependent on the length of the force curves, we used different minimum lengths (Fig. 4). The median of the viscosity μ with a minimum length of l > 600 nm is 6.0 μN·s/m for Mg2+-activated integrins and for resting integrins 5.9 μN·s/m. ki, the initial bending rigidity of the membrane, is decreased after activation from 260 μN/m to 190 μN/m. kt decreases from 1.6 μN/m to 0.9 μN/m under activating conditions (Table 2). A Mann-Whitney test of the distributions shows that for a minimum length of l > 300 nm or l > 600 nm, only the initial bending rigidity is significantly different. For ruptures with tethers longer than 800 nm, the tether stiffness also becomes significantly different between the two setups, although the absolute value hardly changes with increasing cutoff length. This shows that kt becomes better defined for longer ruptures. Although it would be desirable to test even longer ruptures, the number of ruptures with a rupture length of ≥1 mm is too small to obtain statistically significant distributions.
FIGURE 4.

The distributions of the viscoelastic parameters. Box plots of the distributions together with the median of the respective parameter are shown. The p-value describes the probability that the distributions are identical in both setups. It has been calculated using the Mann-Whitney test. (a) The distributions of the viscosity are shown for different length cutoffs. No clear distance-dependent trend is detected. (b) Cutoff distance-dependent distributions of the tether rigidity. Although the values do not change over cutoff distance, the significance of the difference becomes higher despite fewer ruptures. This indicates that for longer rupture lengths, the tether rigidity becomes better defined. (c) Distance dependency of the initial bending rigidity. This value describes the elastic response of the membrane at the initial bending. For longer ruptures, this bending rigidity seems to decrease. (d) Comparison of the bending rigidity (see lower left) and cellular stiffness. The cellular stiffness was determined by the slope of the force-distance curves at the region with F < 0 pN. In this region, the cell is compressed and works against the cantilever, depending on the stiffness of the cell. This is related to the cortex tension. (e) The relation of cell stiffness with the initial bending rigidity is shown. A weak dependency with a correlation coefficient of R ∼ 0.4 for resting integrins and R ∼ 0.2 for Mg-activated integrins is observed.
TABLE 2.
Median of the fit parameters to our data and to the data of Evans et al.
| Median of resting integrins on Jurkat
|
Median of activated integrins on Jurkat
|
P-selectin on primary T-cells (force-distance curves by Evans et al. (42))
|
||||||
|---|---|---|---|---|---|---|---|---|
| l > 300 nm | l > 600 nm | l > 800 nm | l > 300 nm | l > 600 nm | l > 800 nm | −Latrunculin | +Latrunculin | |
| μ [μN·s/m] | 6.0 | 5.9 | 5.8 | 6.1 | 6.0 | 6.1 | 9.9 | 4.6 |
| ki [μN/m] | 320 | 260 | 260 | 210 | 190 | 180 | 190 | 51 |
| kt [μN/m] | 1.5 | 1.6 | 1.9 | 0.9 | 0.9 | 0.8 | 8.0 | 3.0 |
Although no cutoff-dependent differences in μ or kt can be detected, ki is higher if we include ruptures with a length between 300 nm and 600 nm than if we exclude these ruptures. This may have different reasons: the molecular bonds of stiffly anchored receptors potentially break earlier due to the faster force loading. Hence, a stiffer environment induces shorter ruptures. Furthermore, kt is ill defined for short ruptures. Since the initial slope is the sum of ki and kt, an ill-defined kt influences ki. In our fit procedure, kt is initially set to kt = 0; if—due to the shortness of the rupture—kt is not well defined, ki will be artificially higher.
The initial slope of the force curve might be influenced by the cortex tension, which causes the (negative) pushing force of the cell when compressed. To test the correlation between cortex tension and initial bending rigidity, we compared the slope before zero force with ki for each setup. The cell stiffness, which is described by the slope before zero force, is related to the cortex tension. The two slopes (before zero force and ki) are significantly different in both setups (Fig. 4). Comparing the slopes before zero forces of the Ca2+/Mg2+ setup with the slope before zero forces of the Mg2+ setup shows that the slopes before zero force are not influenced by the ion composition of the buffer. This is reasonable, since the treatment with Mg2+ should not lead to a global change in the cellular mechanics but should be observable only when pulling on the activated integrins.
A weak dependency of the initial bending rigidity with the cellular stiffness is observed as expected (Fig. 4).
We also compared the distributions of the medians per single cell. To this end, we calculated the significance of the difference between the distributions of the medians per single cell. The initial bending rigidity, but not the tether reset force constant or the viscosity, is significantly different between the two setups when statistically testing the cell-to-cell variations (Fig. 5).
FIGURE 5.

Cell-to-cell variations. To test the cell-to-cell variations, the median was also determined for each individual cell. The box plots show the distributions of the medians of the single cells for tethers longer than 300 μm. The initial bending rigidity is significantly different (p < 0.05; Mann-Whitney test).
What is a plausible molecular reason for the altered nanoenvironment of Mg2+-activated receptors? It is commonly assumed that the cell bears a reservoir of resting receptors on its surface. These receptors are binding incompetent and not observed in our experiments. Yet, even for resting cells, a subset of receptors is binding competent. These receptors have been postulated to be located in lipid rafts (27). The binding-incompetent receptors, on the other hand, are distributed in other membrane areas. Mg2+-activation activates the resting receptors, which are not in rafts. Since lipid rafts are rich in cholesterol and do have different viscoelastic properties, it is reasonable to assume that the receptors probed after Mg2+-stimulation are located in an environment with less rigidity.
Yet, the tether populations we are probing are not homogeneous: before activation, not all binding-competent receptors will be located in the vicinity of lipid rafts, and after activation, a fraction of the integrins will still be located within lipid rafts. Other effects might lead to further inhomogeneities: activated integrins may be clustered or attached to the cytoskeleton. Also these alterations of the intracellular attachment will influence the viscoelasticity measured by pulling on the integrins.
In principle, it should be possible to resolve the different environments and to gauge the ratio of the respective populations. Unfortunately, due to the subtle differences between the environments, we are unable to statistically detect the subpopulations in the setups. The probing of inhomogeneous populations in each setup blurs the true differences between the varying environments.
Evaluation of the model
Equation 2 gauges the force at a certain rupture length, provided that the viscoelastic parameters are known. Hence, it is a good test of the model to try to recalculate the distribution of rupture forces from the measured rupture lengths using the obtained viscoelastic parameters. The fit between the experimentally measured force distribution and the distribution recalculated from the distribution of rupture lengths is a good indicator of the performance of the model. As shown in Fig. 6, the recalculated force distributions and the measured force distributions are in very good agreement.
FIGURE 6.

Comparison of measured and simulated force distributions. From the experimentally obtained distribution of rupture lengths, we calculated the distribution of rupture forces using the obtained viscoelastic parameters. The simulated distributions (black line) are in good agreement with the experimental distributions (gray bars) under both conditions, for resting (a) and Mg2+-activated (b) integrins.
We then went on to test the model on data obtained by Evans et al., who analyzed the extraction of P-selectin mediated membrane tethers from primary T-lymphocytes using a micropipette assay (18). Equation 2 fits the force-distance relationship measured by Evans and co-workers both for normal cells and for cells treated with Latrunculin A (Fig. 7). Our fit reveals that treatment with Latrunculin, a drug that impairs cytoskeletal development, renders the cell significantly softer. Interestingly, the membrane viscosity of these cells is only half the value of that of the untreated cells. On first sight, this is surprising, since Latrunculin does not change the membrane composition. Yet, it has been observed before that the membrane viscosity is dominated by the slip of the membrane over intracellular components rather than by intramembrane slipping events (22), in line with our observations here.
FIGURE 7.

Fit to data by Evans et al. (a) Equation 2 was fit to data by Evans et al. under two conditions, with and without Latrunculin A. (b) The dependence of the rupture forces on the pulling velocity obtained from the experiment (solid diamonds) and from a Monte Carlo simulation with our model (open diamonds) is shown.
Equation 2 describes the influence of the pulling velocity on the expected rupture forces. To test whether our model is able to reproduce experimental data over a large range of pulling velocities, we used the velocity-dependent measurements of Evans and co-workers. To compare our model with these data, we performed a Monte Carlo simulation of ruptures at different velocities. For small distance intervals dz = v × dt, where v is the pulling velocity and dt a small time interval, we calculated the rupture probability as  Then, a random number
  was generated. If
  the bond was broken and the rupture force saved, otherwise, the distance was incremented by dz. The off rate under force
  was defined as
 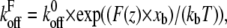 with F(z) as described by our model. This kind of simulation has been shown to accurately reproduce AFM data (37). F(z) was calculated for each distance according to Eq. 2 with the viscoelastic parameters obtained from the fit to the single force-distance curve (Table 2, data by Evans). The values for
  and xb were taken from an earlier single-molecule AFM study of isolated P-selectin by Fritz et al. (37) as
  = 0.022 s−1 and xb = 2.5 Å.
The simulation is in good agreement with the data of Evans et al. up to velocities of 50 μm/s, although our approach tends to underestimate the forces at low velocities (Fig. 7) and at the very high velocity of 150 μm/s (data not shown). The failure of our model to reproduce the data at very high velocities is not surprising, since at these velocities different barriers may be probed so that the kinetic parameters are not accurate any more (7,13,16,17). Still, it is encouraging that we can use data from isolated single molecules and the viscoelastic parameters obtained from a single force-distance curve on a cell to reasonably estimate the expected rupture forces of a given receptor/ligand pair on living cells over a range of velocities of over two orders of magnitude.
How do the viscoelastic parameters compare to other experiments? The range of measured parameters is large and spans orders of magnitude (for a recent review, see Lim et al. (38)). In general, the viscosity is recorded as μeff, which corresponds to the viscosity according to  recorded here. The membranes of red blood cells have a significantly higher viscosity than the values observed here, in the range of μeff = 34 pN·s/μm (39). Membrane surface viscosities for vesicles of lipid membranes are in the range of 0.001 pN·s/μm (40), whereas neuronal growth cones have been measured to have a viscosity of μeff = 0.137 pN·s/μm (19,20). For primary T-lymphocytes, a μeff of 1.6 pN·s/μm has been reported by Xu et al. (41). The viscosity obtained from the fit to the data of Evans et al. is in excellent agreement with the data by Xu et al.: 9.1 pN·s/μm corresponds to μeff = 1.4 pN·s/μm. Our viscosity value measured for the integrin-bound membrane tethers on Jurkat cells of ∼5–6 pN·s/μm (μeff = 0.8–1.0 pN·s/μm) is lower than the value reported by Xu et al. and the value obtained from the fit to Evans data. Xu et al. and Evans et al. used the PSGL-1 receptor P-selectin on primary T-cells in a micropipette manipulation assay, whereas we used the VLA-4/VCAM-1 pair and Jurkat cells. These are cancerous cells, which are softer and have a less developed cytoskeleton, which might reduce the viscous slip of the membrane over the cytoskeleton (22). Experiments at lower ambient temperatures might also increase μeff, compared to our experiments performed at 36°C.
The stiffness of the tethers is described by kt. This stiffness has been estimated before by Li et al. for outer hair cells (OHC) using optical tweezers (22). In these earlier studies, differences in the tether stiffness between tethers pulled from the lateral wall and tethers pulled from the basal end of OHC have been observed. The stiffness of the tethers was determined as 0.0037 pN/nm for the lateral wall and 0.0045 pN/nm for the basal end. These differences have been attributed to the higher cholesterol content of the membrane at the basal end compared to the lateral wall. These values are similar to the values of kt = 0.001–0.00 2 pN/nm measured in our setup. The fit to Evans data yields a kt of 0.008 pN/nm, which is slightly higher than the other values.
The stretching of the molecular connection between the cell and the cantilever as well as the deformations of the whole cell can influence the force-distance relationship and therefore have an effect on the measured parameters. Our cell is attached to the cantilever via an antibody. The typical size of an antibody is on the order of a few nanometers, whereas the typical size of cells is on the order of micrometers. Hence, stretching the antibody will not significantly affect the measurement. The initial bending rigidity, on the other hand, will certainly contain contributions from the deformation of the whole cell. These contributions are well described by our model, as demonstrated by the good agreement between data and fit.
Theoretical analysis of the force-distance relationship: the compliance
The mechanical compliance describes how much a system elongates under an applied force. It is important for the force absorption by the system and influences the distribution of rupture forces (7). To better understand the effect of the different parameters on the mechanical compliance, we isolated z in Eq. 2 and differentiated it to obtain the analytical expression
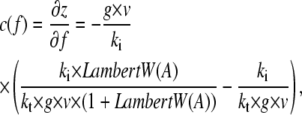 |
(3) |
with
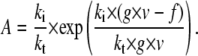 |
Hence, the knowledge of the viscoelastic parameters allows the calculation of the force-dependent compliance. Whereas kt changes the compliance in the high-force regime, ki changes the compliance in the low-force regime (Fig. 8). The viscosity changes the transition point between these two regimes. This demonstrates that by altering the anchorage properties in a well-defined manner, the cell can fine-tune the mechanical response to high forces, the response to low forces, and the transition between these two responses.
FIGURE 8.

Influence of the viscoelastic parameters on the mechanical compliance. Clearly, two regimes are seen. The transition between the two regimes is sharp. The viscosity of the membrane determines the point of transition. The high-force regime is dominated by kt, the low-force regime by ki.
Theoretical analysis of the force-distance relationship: the distribution of rupture forces
The distribution of rupture forces is dependent not only on the energy landscape of the receptor ligand bond but also on the elastic compliance of the linkage between the receptor and the force-exerting environment (7). In cellular adhesion events, the cell itself constitutes this linkage. Therefore, changes in compliance caused by altered viscoelastic parameters should also influence the distribution of rupture forces. The distribution of rupture forces is given by (7)
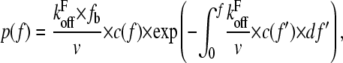 |
(4) |
where 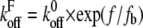 is the off rate under force,
  the basal off rate,
  the characteristic force of the bond, and γ the potential width. Thus, with the compliance described by Eq. 3, the effect of the viscoelastic parameters on the distribution of rupture forces can be gauged. Equation 4 cannot be solved analytically when using the compliance described by Eq. 3. Hence, we calculated the distribution numerically for different values of ki, kt, and μ. At a given affinity state, the viscosity of the membrane sets the force scale of the rupture and very effectively modulates the most probable rupture force (Fig. 9). At a given viscosity, both ki and kt can fine-tune the distribution of rupture forces and thus the adhesiveness of the cell.
FIGURE 9.

Influence of viscoelastic parameters on the distribution of rupture forces. The distribution of rupture forces was calculated numerically according to Eq. 4. For a given affinity state, the force scale is set by the viscosity. At a given viscosity, both ki and kt can fine-tune the force resistance of the bond. The overall range in forces that can be achieved by changing the viscoelastic parameters is in the same range as caused by changes in the affinity state (koff).
Biological implications
One of the features of our force curves is the long plateau of equal force before the rupture. Similar force plateaus preceding the tether rupture have been observed before (12,18,22,42,43). Still, the shape of the reported force curves differs between different cells, different receptors, and pulling speeds. Hence, although the Kelvin body is a good model for the T-cells investigated here, it might not be appropriate for other cell types or experimental setups. In particular, a strong initial tether formation force ranging from ∼100 pN to 500 pN has been observed for adherent cells like OHC cells, before the force drops to the plateau value (22). For OHC, the plateau value of ∼100 pN is significantly higher than the 20–25 pN observed here, demonstrating that the tether force is strongly correlated to the overall architecture of the cell. Therefore, an in-depth analysis of the force curves leading to membrane tethers will give insight into different cellular architectures.
Many other models have successfully been employed to analyze the deformability of cells (for a review, see Lim et al. (38)). The advantage of the Kelvin body is its simplicity. As shown above, it is the simplest linear solid capable of describing the observed force-distance relationship. This does not imply that other models, treating for instance the cell as liquid drop, may not also be applicable.
When analyzing the force curves with our model, the shape of the force curve characterizes the viscoelastic parameters of the membrane in vicinity to the probed receptor. Hence, the receptor serves as a nanoprobe of its membrane environment. The gathered data thus offer the unique possibility to analyze changes in the receptor anchorage. This is particularly interesting for adhesive cellular receptors such as integrins, which dynamically change their mode of anchorage depending on their phosphorylation states as well as on specific associations with cytoskeleton adaptor molecules (44). Future studies on the physiological activation of integrins with chemokines will use the analysis described here to gain better insight into the processes involved. It has been observed that the attachment of membrane components to the cytoskeleton has a significant impact on the rupture forces (45–47). Hence, the effects of physiological activation involving cytoskeletal attachment are expected to be much stronger than the subtle effect observed here.
The integrin VLA-4 is involved both in rolling as well as in firm arrest (8). These divers tasks are associated with different affinity states of the integrin. Our results indicate that the slowdown can additionally be maintained by changes in the compliance of the receptor's cellular anchorage. Changing the compliance of the system has the same influence on the distribution of rupture forces and therefore on the adhesiveness of cells as changing the off rate has (Eq. 4). Hence, modulating the stiffness of the receptor environment either intracellularly or extracellularly can be used to regulate cell adhesion or force-based signaling. Different lines of evidence suggest that this additional level of regulation is indeed utilized by cells. It has recently been shown that the mechanical properties of the extracellular matrix influence the development of stem cells (48). In addition, it has been reported that the extracellular matrix stiffness is a crucial factor for the migration of tumor cells (49). Furthermore, a paradigm in integrin signaling states that chemoattractants lead to a cytoskeletal attachment of the integrins (6). This will certainly lead to a lowered compliance and hence to increased rupture forces, even in the absence of further conformational changes. Furthermore, integrins are redistributed to lipid rafts after activation of the cell (27). Lipid rafts have altered membrane properties, expressed, for example, in a higher viscosity (50). As shown here, this redistribution alone will influence the integrin-mediated adhesiveness of the cell. These arguments corroborate the notion that the mechanical compliance of the membrane or the extracellular matrix is indeed a factor in cellular behavior and that it is actively modulated in addition to the affinity state of the receptor ligand bonds.
CONCLUSIONS
The technical innovations in single-molecule force measurements as well as the increased understanding of the physical background leading to the observed force-distance curves have greatly advanced our understanding of the material properties of single molecules (51). Refined theoretical models have helped to interpret the complex data obtained from these measurements (52–56). For single-molecule studies of isolated molecules, models such as the worm-like chain model or the freely rotated chain model have enabled the field to analyze not only the rupture forces but also the history of force evolution to obtain interesting parameters such as the persistence length of single molecules (7,17,57,58). For cells, these models have been lacking. The data we presented here show that a Kelvin body based model is well suited to interpret single-molecule measurements on living cells. With such a model, we can not only describe the observed force-distance relationship but also obtain a tool to possibly scrutinize cellular receptors from the outside for intracellular changes in the anchorage of these receptors. Hence, the interpretation of single-molecule force measurements introduced here can help to thoroughly analyze the biomechanics of cellular activation events.
Acknowledgments
We thank Ronen Alon for many helpful discussions and the generous gift of chemicals and biological material and Martin Tschöpe for help in the evaluation of the data.
The work is supported by CeNS (the Center for NanoScience). K.E.G. is supported by a Liebig Fellowship of the Fonds der Chemischen Industrie. J.S. is supported by the IDK-NBT.
Editor: Jane Clarke.
References
- 1.Xiao, T., J. Takagi, B. S. Coller, J. H. Wang, and T. A. Springer. 2004. Structural basis for allostery in integrins and binding to fibrinogen-mimetic therapeutics. Nature. 432:59–67. [DOI] [PMC free article] [PubMed] [Google Scholar]
- 2.Xiong, J. P., T. Stehle, B. Diefenbach, R. Zhang, R. Dunker, D. L. Scott, A. Joachimiak, S. L. Goodman, and M. A. Arnaout. 2001. Crystal structure of the extracellular segment of integrin α Vβ3. Science. 294:339–345. [DOI] [PMC free article] [PubMed] [Google Scholar]
- 3.van Kooyk, Y., and C. G. Figdor. 2000. Avidity regulation of integrins: the driving force in leukocyte adhesion. Curr. Opin. Cell Biol. 12:542–547. [DOI] [PubMed] [Google Scholar]
- 4.Grabovsky, V., S. Feigelson, C. Chen, D. A. Bleijs, A. Peled, G. Cinamon, F. Baleux, F. Arenzana-Seisdedos, T. Lapidot, Y. van Kooyk, R. R. Lobb, and R. Alon. 2000. Subsecond induction of α4 integrin clustering by immobilized chemokines stimulates leukocyte tethering and rolling on endothelial vascular cell adhesion molecule 1 under flow conditions. J. Exp. Med. 192:495–506. [DOI] [PMC free article] [PubMed] [Google Scholar]
- 5.Gottschalk, K. E., and H. Kessler. 2004. A computational model of transmembrane integrin clustering. Structure. 12:1109–1116. [DOI] [PubMed] [Google Scholar]
- 6.Alon, R., and M. L. Dustin. 2007. Force as a facilitator of integrin conformational changes during leukocyte arrest on blood vessels and antigen-presenting cells. Immunity. 26:17–27. [DOI] [PubMed] [Google Scholar]
- 7.Evans, E., and K. Ritchie. 1999. Strength of a weak bond connecting flexible polymer chains. Biophys. J. 76:2439–2447. [DOI] [PMC free article] [PubMed] [Google Scholar]
- 8.Alon, R., S. W. Feigelson, E. Manevich, D. M. Rose, J. Schmitz, D. R. Overby, E. Winter, V. Grabovsky, V. Shinder, B. D. Matthews, M. Sokolovsky-Eisenberg, D. E. Ingber, M. Benoit, and M. H. Ginsberg. 2005. α4β1-dependent adhesion strengthening under mechanical strain is regulated by paxillin association with the α4-cytoplasmic domain. J. Cell Biol. 171:1073–1084. [DOI] [PMC free article] [PubMed] [Google Scholar]
- 9.Benoit, M., D. Gabriel, G. Gerisch, and H. E. Gaub. 2000. Discrete interactions in cell adhesion measured by single-molecule force spectroscopy. Nat. Cell Biol. 2:313–317. [DOI] [PubMed] [Google Scholar]
- 10.Benoit, M., and H. E. Gaub. 2002. Measuring cell adhesion forces with the atomic force microscope at the molecular level. Cells Tissues Organs. 172:174–189. [DOI] [PubMed] [Google Scholar]
- 11.Eibl, R. H., and V. T. Moy. 2005. Atomic force microscopy measurements of protein-ligand interactions on living cells. Methods Mol. Biol. 305:439–450. [DOI] [PubMed] [Google Scholar]
- 12.Sun, M., J. S. Graham, B. Hegedus, F. Marga, Y. Zhang, G. Forgacs, and M. Grandbois. 2005. Multiple membrane tethers probed by atomic force microscopy. Biophys. J. 89:4320–4329. [DOI] [PMC free article] [PubMed] [Google Scholar]
- 13.Li, F., S. D. Redick, H. P. Erickson, and V. T. Moy. 2003. Force measurements of the α5β1 integrin-fibronectin interaction. Biophys. J. 84:1252–1262. [DOI] [PMC free article] [PubMed] [Google Scholar]
- 14.Grandbois, M., W. Dettmann, M. Benoit, and H. E. Gaub. 2000. Affinity imaging of red blood cells using an atomic force microscope. J. Histochem. Cytochem. 48:719–724. [DOI] [PubMed] [Google Scholar]
- 15.Zhang, X., A. Chen, D. De Leon, H. Li, E. Noiri, V. T. Moy, and M. S. Goligorsky. 2004. Atomic force microscopy measurement of leukocyte-endothelial interaction. Am. J. Physiol. Heart Circ. Physiol. 286:H359–H367. [DOI] [PubMed] [Google Scholar]
- 16.Zhang, X., S. E. Craig, H. Kirby, M. J. Humphries, and V. T. Moy. 2004. Molecular basis for the dynamic strength of the integrin α4β1/VCAM-1 interaction. Biophys. J. 87:3470–3478. [DOI] [PMC free article] [PubMed] [Google Scholar]
- 17.Evans, E., and K. Ritchie. 1997. Dynamic strength of molecular adhesion bonds. Biophys. J. 72:1541–1555. [DOI] [PMC free article] [PubMed] [Google Scholar]
- 18.Evans, E., V. Heinrich, A. Leung, and K. Kinoshita. 2005. Nano- to microscale dynamics of P-selectin detachment from leukocyte interfaces. I. Membrane separation from the cytoskeleton. Biophys. J. 88:2288–2298. [DOI] [PMC free article] [PubMed] [Google Scholar]
- 19.Hochmuth, F. M., J. Y. Shao, J. Dai, and M. P. Sheetz. 1996. Deformation and flow of membrane into tethers extracted from neuronal growth cones. Biophys. J. 70:358–369. [DOI] [PMC free article] [PubMed] [Google Scholar]
- 20.Shao, J. Y., and R. M. Hochmuth. 1996. Micropipette suction for measuring piconewton forces of adhesion and tether formation from neutrophil membranes. Biophys. J. 71:2892–2901. [DOI] [PMC free article] [PubMed] [Google Scholar]
- 21.Shao, J. Y., H. P. Ting-Beall, and R. M. Hochmuth. 1998. Static and dynamic lengths of neutrophil microvilli. Proc. Natl. Acad. Sci. USA. 95:6797–6802. [DOI] [PMC free article] [PubMed] [Google Scholar]
- 22.Li, Z., B. Anvari, M. Takashima, P. Brecht, J. H. Torres, and W. E. Brownell. 2002. Membrane tether formation from outer hair cells with optical tweezers. Biophys. J. 82:1386–1395. [DOI] [PMC free article] [PubMed] [Google Scholar]
- 23.Barakat, A. I. 2001. A model for shear stress-induced deformation of a flow sensor on the surface of vascular endothelial cells. J. Theor. Biol. 210:221–236. [DOI] [PubMed] [Google Scholar]
- 24.Bausch, A. R., F. Ziemann, A. A. Boulbitch, K. Jacobson, and E. Sackmann. 1998. Local measurements of viscoelastic parameters of adherent cell surfaces by magnetic bead microrheometry. Biophys. J. 75:2038–2049. [DOI] [PMC free article] [PubMed] [Google Scholar]
- 25.Fung, Y. C. 1993. Biomechanics; Mechanical Properties of Living Tissues. Springer, New York.
- 26.Spillmann, C., D. Osorio, and R. Waugh. 2002. Integrin activation by divalent ions affects neutrophil homotypic adhesion. Ann. Biomed. Eng. 30:1002–1011. [DOI] [PubMed] [Google Scholar]
- 27.Leitinger, B., and N. Hogg. 2002. The involvement of lipid rafts in the regulation of integrin function. J. Cell Sci. 115:963–972. [DOI] [PubMed] [Google Scholar]
- 28.Shirakawa, J., Y. Wang, S. Tahara-Hanaoka, S. Honda, K. Shibuya, and A. Shibuya. 2006. LFA-1-dependent lipid raft recruitment of DNAM-1 (CD226) in CD4+ T cell. Int. Immunol. 18:951–957. [DOI] [PubMed] [Google Scholar]
- 29.Marwali, M. R., J. Rey-Ladino, L. Dreolini, D. Shaw, and F. Takei. 2003. Membrane cholesterol regulates LFA-1 function and lipid raft heterogeneity. Blood. 102:215–222. [DOI] [PubMed] [Google Scholar]
- 30.Wojcikiewicz, E. P., X. Zhang, and V. T. Moy. 2004. Force and compliance measurements on living cells using atomic force microscopy (AFM). Biol. Proced. Online. 6:1–9. [DOI] [PMC free article] [PubMed] [Google Scholar]
- 31.Florin, E.-L., M. Rief, H. Lehmann, M. Ludwig, C. Dornmair, V. T. Moy, and H. E. Gaub. 1995. Sensing specific molecular interactions with the atomic force microscope. Biosens. Bioelectron. 10:895–901. [Google Scholar]
- 32.Butt, H.-J., and M. Jaschke. 1995. Calculation of thermal noise in atomic force spectroscopy. Nanotechnology. 6:1–7. [Google Scholar]
- 33.Kunkel, E. J., J. L. Dunne, and K. Ley. 2000. Leukocyte arrest during cytokine-dependent inflammation in vivo. J. Immunol. 164:3301–3308. [DOI] [PubMed] [Google Scholar]
- 34.Chen, C., J. L. Mobley, O. Dwir, F. Shimron, V. Grabovsky, R. R. Lobb, Y. Shimizu, and R. Alon. 1999. High affinity very late antigen-4 subsets expressed on T cells are mandatory for spontaneous adhesion strengthening but not for rolling on VCAM-1 in shear flow. J. Immunol. 162:1084–1095. [PubMed] [Google Scholar]
- 35.Hosu, B. G., M. Sun, F. Marga, M. Grandbois, and G. Forgacs. 2007. Eukaryotic membrane tethers revisited using magnetic tweezers. Phys. Biol. 4:67–78. [DOI] [PubMed] [Google Scholar]
- 36.Bruehl, R. E., T. A. Springer, and D. F. Bainton. 1996. Quantitation of L-selectin distribution on human leukocyte microvilli by immunogold labeling and electron microscopy. J. Histochem. Cytochem. 44:835–844. [DOI] [PubMed] [Google Scholar]
- 37.Fritz, J., A. G. Katopodis, F. Kolbinger, and D. Anselmetti. 1998. Force-mediated kinetics of single P-selectin/ligand complexes observed by atomic force microscopy. Proc. Natl. Acad. Sci. USA. 95:12283–12288. [DOI] [PMC free article] [PubMed] [Google Scholar]
- 38.Lim, C. T., E. H. Zhou, and S. T. Quek. 2006. Mechanical models for living cells: a review. J. Biomech. 39:195–216. [DOI] [PubMed] [Google Scholar]
- 39.Hwang, W. C., and R. E. Waugh. 1997. Energy of dissociation of lipid bilayer from the membrane skeleton of red blood cells. Biophys. J. 72:2669–2678. [DOI] [PMC free article] [PubMed] [Google Scholar]
- 40.Evans, E. A., and R. M. Hochmuth. 1976. Membrane viscoelasticity. Biophys. J. 16:1–11. [DOI] [PMC free article] [PubMed] [Google Scholar]
- 41.Xu, G., and J. Y. Shao. 2005. Double tether extraction from human neutrophils and its comparison with CD4+ T-lymphocytes. Biophys. J. 88:661–669. [DOI] [PMC free article] [PubMed] [Google Scholar]
- 42.Heinrich, V., A. Leung, and E. Evans. 2005. Nano- to microscale dynamics of P-selectin detachment from leukocyte interfaces. II. Tether flow terminated by P-selectin dissociation from PSGL-1. Biophys. J. 88:2299–2308. [DOI] [PMC free article] [PubMed] [Google Scholar]
- 43.King, M. R., V. Heinrich, E. Evans, and D. A. Hammer. 2005. Nano-to-micro scale dynamics of P-selectin detachment from leukocyte interfaces. III. Numerical simulation of tethering under flow. Biophys. J. 88:1676–1683. [DOI] [PMC free article] [PubMed] [Google Scholar]
- 44.Liu, S., D. A. Calderwood, and M. H. Ginsberg. 2000. Integrin cytoplasmic domain-binding proteins. J. Cell Sci. 113:3563–3571. [DOI] [PubMed] [Google Scholar]
- 45.Thie, M., R. Rospel, W. Dettmann, M. Benoit, M. Ludwig, H. E. Gaub, and H. W. Denker. 1998. Interactions between trophoblast and uterine epithelium: monitoring of adhesive forces. Hum. Reprod. 13:3211–3219. [DOI] [PubMed] [Google Scholar]
- 46.Afrin, R., H. Arakawa, T. Osada, and A. Ikai. 2003. Extraction of membrane proteins from a living cell surface using the atomic force microscope and covalent crosslinkers. Cell Biochem. Biophys. 39:101–117. [DOI] [PubMed] [Google Scholar]
- 47.Afrin, R., and A. Ikai. 2006. Force profiles of protein pulling with or without cytoskeletal links studied by AFM. Biochem. Biophys. Res. Commun. 348:238–244. [DOI] [PubMed] [Google Scholar]
- 48.Engler, A. J., S. Sen, H. L. Sweeney, and D. E. Discher. 2006. Matrix elasticity directs stem cell lineage specification. Cell. 126:677–689. [DOI] [PubMed] [Google Scholar]
- 49.Zaman, M. H., L. M. Trapani, A. L. Sieminski, D. Mackellar, H. Gong, R. D. Kamm, A. Wells, D. A. Lauffenburger, and P. Matsudaira. 2006. Migration of tumor cells in 3D matrices is governed by matrix stiffness along with cell-matrix adhesion and proteolysis. Proc. Natl. Acad. Sci. USA. 103:10889–10894. [DOI] [PMC free article] [PubMed] [Google Scholar]
- 50.Niemela, P. S., S. Ollila, M. T. Hyvonen, M. Karttunen, and I. Vattulainen. 2007. Assessing the nature of lipid raft membranes. PLoS Comput. Biol. 3:e34. [DOI] [PMC free article] [PubMed] [Google Scholar]
- 51.Hugel, T., M. Rief, M. Seitz, H. E. Gaub, and R. R. Netz. 2005. Highly stretched single polymers: atomic-force-microscope experiments versus ab-initio theory. Phys. Rev. Lett. 94:048301. [DOI] [PubMed] [Google Scholar]
- 52.Kessler, M., K. E. Gottschalk, H. Janovjak, D. J. Muller, and H. E. Gaub. 2006. Bacteriorhodopsin folds into the membrane against an external force. J. Mol. Biol. 357:644–654. [DOI] [PubMed] [Google Scholar]
- 53.Neuert, G., C. H. Albrecht, and H. E. Gaub. 2007. Predicting the rupture probabilities of molecular bonds in series. Biophys. J. 93:1215–1223. [DOI] [PMC free article] [PubMed] [Google Scholar]
- 54.Neuert, G., C. Albrecht, E. Pamir, and H. E. Gaub. 2006. Dynamic force spectroscopy of the digoxigenin-antibody complex. FEBS Lett. 580:505–509. [DOI] [PubMed] [Google Scholar]
- 55.Rief, M., F. Oesterhelt, B. Heymann, and H. E. Gaub. 1997. Single molecule force spectroscopy on polysaccharides by atomic force microscopy. Science. 275:1295–1297. [DOI] [PubMed] [Google Scholar]
- 56.Clausen-Schaumann, H., M. Rief, C. Tolksdorf, and H. E. Gaub. 2000. Mechanical stability of single DNA molecules. Biophys. J. 78:1997–2007. [DOI] [PMC free article] [PubMed] [Google Scholar]
- 57.Round, A. N., M. Berry, T. J. McMaster, S. Stoll, D. Gowers, A. P. Corfield, and M. J. Miles. 2002. Heterogeneity and persistence length in human ocular mucins. Biophys. J. 83:1661–1670. [DOI] [PMC free article] [PubMed] [Google Scholar]
- 58.Evans, E. 2001. Probing the relation between force–lifetime–and chemistry in single molecular bonds. Annu. Rev. Biophys. Biomol. Struct. 30:105–128. [DOI] [PubMed] [Google Scholar]