

Abstract
Duchenne muscular dystrophy (DMD) is a hereditary degenerative disease manifested by the absence of dystrophin, a structural, cytoskeletal protein, leading to muscle degeneration and early death through respiratory and cardiac muscle failure. Whereas the rise of cytosolic Ca2+ concentrations in muscles of mdx mouse, an animal model of DMD, has been extensively documented, little is known about the mechanisms causing alterations in Na+ concentrations. Here we show that the skeletal muscle isoform of the voltage-gated sodium channel, Nav1.4, which represents over 90% of voltage-gated sodium channels in muscle, plays an important role in development of abnormally high Na+ concentrations found in muscle from mdx mice. The absence of dystrophin modifies the expression level and gating properties of Nav1.4, leading to an increased Na+ concentration under the sarcolemma. Moreover, the distribution of Nav1.4 is altered in mdx muscle while maintaining the colocalization with one of the dystrophin-associated proteins, syntrophin α-1, thus suggesting that syntrophin is an important linker between dystrophin and Nav1.4. Additionally, we show that these modifications of Nav1.4 gating properties and increased Na+ concentrations are strongly correlated with increased cell death in mdx fibers and that both cell death and Na+ overload can be reversed by 3 nM tetrodotoxin, a specific Nav1.4 blocker.
INTRODUCTION
Duchenne muscular dystrophy (DMD) is a degenerative X-linked muscle disease affecting 1 male out of 3,500 newborns, leading to death through respiratory or cardiac muscle failure at age 20 to 30, with no effective treatment at present. Mutations in the p21 region of the X chromosome lead to an absence of dystrophin, a 427-kD protein located beneath the plasma membrane, which is associated with the cytoskeleton via actin, and with the extracellular matrix via a dystrophin–glycoprotein complex (DGC) (Blake et al., 2002). Because of its key localization, dystrophin is thought to play multiple roles such as maintaining mechanical stability of the muscle architecture (Koenig et al., 1988) or regulating the function of sarcolemmal components, for example, cation channels (Fong et al., 1990). The mechanisms leading to increased muscle cell death are still unclear; however, it is generally accepted that an elevated cytosolic calcium concentration occurring when muscle is stretched is an important link between the absence of dystrophin and muscle degeneration (Gailly, 2002; Ruegg et al., 2002).
This increase in the Ca2+ concentration is not the only alteration in dystrophin-lacking cells. Thus, it has been shown that the intracellular sodium concentration ([Na+]i) is also elevated in skeletal muscle of mdx mice, an animal model of DMD (Dunn et al., 1993; Allen, 2004). Additionally, an increase in Na+/K+ ATPase activity has been reported in mdx mice, suggesting an impairment in Na+ regulation (Dunn et al., 1995). It has also been shown that fibers from mdx muscle are more susceptible to stretch-induced damage and that there is an associated rise in [Na+]i, which could be attenuated by unspecific cation channel blocker Gd3+ (Yeung et al., 2003). Nonetheless, the cause of the increased [Na+]i is still unknown.
Voltage-gated sodium channels (VGSCs) are transmembrane proteins responsible for propagating the action potentials along the muscle fibers and initiating contraction. VGSCs are composed of a pore-forming α-subunit and a smaller β-subunit (Catterall, 1988). Two isoforms have been described in muscle: Nav1.4, the skeletal muscle isoform that represents >90% of VGSCs expressed in skeletal muscle, and Nav1.5, the fetal or cardiac isoform.
Nav1.4 is highly expressed at the endplate of skeletal muscle fibers, but its detailed localization in the extrajunctional sarcolemma has not been studied extensively. Both isoforms contain the consensus sequence SXV-COOH, which binds directly to the PDZ domain of α1-syntrophin (Gee et al., 1998), a cytoplasmic protein belonging to the DGC. The distribution of dystrophin and syntrophin at the sarcolemma remains controversial, although results favor costameric and intercostameric localization (Williams and Bloch, 1999a). Moreover, it has been shown that in the heart, DGC is required for the proper expression and function of the Nav1.5 isoform (Gavillet et al., 2006). These observations prompted us to test whether the absence of dystrophin could alter the expression and function of Nav1.4, and whether the changes can account for the increase in [Na+]i (Dunn et al., 1993; Allen, 2004).
We found that the absence of dystrophin modifies the expression level, distribution, and gating properties of Nav1.4 in skeletal muscle. At the measured resting membrane potential, changes in gating properties and inactivation threshold are sufficient to support an observed twofold higher level of Na+ under the sarcolemma in mdx muscle. This [Na+]i elevation likely contributes to an elevated rate of cell death in dystrophic muscle, and both these effects can be reversed by tetrodotoxin (TTX) treatment at concentrations that specifically block the Nav1.4 channel.
MATERIALS AND METHODS
Animals
Male C57BL/6J (control) and mdx5cv mice were age matched to be 12–16 wk old. Mice were killed by cervical dislocation. All the procedures involving animals were performed in compliance with the Swiss Federal Veterinary Office's guidelines, based on the Swiss Federal Law on Animal Welfare, and approved by the Cantonal Veterinary Office.
Fiber Dissociation and Survival Test
Flexor digitorum brevis (FDB) muscles were dissected from both hind feet of the mice. After extraction, both muscles were incubated in DMEM supplemented with glutamax (GIBCO BRL), 2 mg/ml of collagenase type I-A (Sigma-Aldrich C-2674), and 10 μg/ml ciproxine (Bayer) for 1 h at 37°C. They were then rinsed three times with DMEM-glutamax and were dissociated by passing them repeatedly through wide-mouthed fire-polished Pasteur pipettes of decreasing size in DMEM until single intact fibers were obtained. The dissociated fibers were plated on coverslips coated with 400 μg/ml Matrigel (Becton Dickinson). For survival tests 50–100 fibers per well were plated in Matrigel-coated 48-well plates and treated with TTX (Alexis) at various concentrations in DMEM-glutamax (2 wells by concentration). Fiber survival was quantified daily by performing a blind count of living fibers, as judged by shape and light refraction using phase contrast optics under an inverted microscope (Nikon). No spontaneous contractile activity was observed in cultures of dissociated and denervated fibers.
Immunostaining of Isolated Fibers and Confocal Imaging
Freshly isolated fibers plated on coverslips (Labtek) were fixed in 1.5% solution of formaldehyde in PBS, washed twice in cold PBS, and then permeabilized in 0.2% Triton X-100 in PBS. The samples were incubated in 10% normal goat serum in PBS followed by an overnight incubation at 4°C with the primary antibody (1:500 dilution) in PBS containing 0.05% Triton X-100. After extensive washing, fibers were incubated with a fluorophore-conjugated secondary antibody (1:500 dilution, Molecular Probes) in PBS for 1 h at room temperature. Finally slides were mounted in Mowiol (Calbiochem). Nav1.4 was labeled using an anti-SkM1 mouse monoclonal antibody (Sigma-Aldrich S9568) and α1 syntrophins with an anti-α1-syntrophin rabbit polyclonal antibody (provided by M. Schaub, University of Zurich, Zurich, Switzerland). Secondary antibodies were AlexaFluor 488–labeled monoclonal goat anti-rabbit, and Texas red–labeled monoclonal goat anti-mouse.
Confocal images were obtained using a Leica SP2 confocal microscope with a 40× oil immersed objective with 1.4 numerical aperture. The pixel dimensions were 0.2 × 0.2 μm in the focal plane, and the z sections were 0.1–0.4 μm. The same settings were used for all images. Slides were excited at either 488 or 594 nm depending on the secondary antibody.
Western Blots
FDB muscles were homogenized in a buffer containing (in mM) 20 HEPES, pH 7.6, 125 NaCl, 1 EDTA, 1 EGTA, 1 DTT, 10% glycerol, protease inhibitor cocktail using an Ultra-Turrax T8 homogenizer (Verrerie de Carouge). Triton-X was added to a final concentration of 1% and homogenates were incubated 10 min on ice. After centrifugation (12,000 g, 4°C, 20 min), supernatants were collected. Protein concentration was determined using the BC assay method (Optima). 5 μg of protein were resolved on a gradient gel (5–10% of acrylamide) at 80 V. Proteins were transferred onto 0.45-μm nitrocellulose membranes for 2 h at 100 V at 4°C (Bio-Rad Laboratories Inc. Miniprotean III apparatus). Transfer efficiency was verified by staining with Ponceau S (Sigma-Aldrich).
Membranes were blocked in saturation solution (TBST containing 3% BSA) for 1 h and incubated overnight at 4°C with a primary antibody (anti-SkM1, Sigma S-9568, 1:5,000) in saturation solution. After extensive washing, membranes were exposed to secondary antibodies (HRP-conjugated goat anti-mouse antibody, Bio-Rad Laboratories Inc., 1:50,000) for 1 h. Proteins were detected by chemiluminescence using the ECL plus kit (Amersham Biosciences) on Fuji x-ray film, and were quantified using the Bio-Rad Laboratories Inc. scanner (Universal Hood II, Quantity one analysis software) and normalized to expression level of SERCA1. Western blot analysis of SERCA1 expression was performed using mouse anti-SERCA1 antibody (Affinity Bioreagents 1:1,000). Expression of SERCA1 has been shown to be essentially the same in FDB muscles from C57BL/6J and mdx5cv mice (Boittin et al., 2006).
Measurement of Sodium Influx in FBD Muscle
FDB muscles were rinsed in PBS, incubated with 1 μCi of 22Na+ in PSS (in mM: HEPES 5, KCl 5, MgCl2 1, NaCl 145, CaCl2 1.2; pH 7.3) in the presence of 10−4 M ouabain (Merck) in order to inhibit Na+/K+ATPase activity, with or without 3 × 10⁻⁹ M TTX. No preincubation was performed and muscles were incubated for 5 min, rinsed four times in ice-cold PSS with ouabain, soaked, weighed, and extracted overnight with 3 N NaOH. 22Na+ content was determined by liquid scintillation counting using a β-counter (LKB Wallac) normalized by dividing by muscle weight and expressed as ratio of nontreated control muscle.
Patch Clamp Recordings
Cell-attached patch-clamp recordings were performed at room temperature on individual fibers isolated as described above. Fibers were immersed in a relaxing, high K solution (in mM: 10 NaCl, 142 KCl, 2 MgCl2, 0.2 CaCl2, 5 glucose, 0.5 EGTA, 10 HEPES; pH 7.3) containing additionally 30 μM N-benzyl-p-toluene sulphonamide (BTS) to inhibit contractions. Cells immersed in this solution had their resting membrane potentials within 2 mV of zero. Patch pipettes contained a Tyrode solution (in mM: 140 NaCl, 5 KCl, 0.5 MgCl2, 1 CaCl2, 6 glucose, 10 HEPES; pH 7.3) with 2 mM TEA and 10 μM 4,4′-diisothiocyanato-stilbene-2,2′-disulphonic acid (DIDS) added to inhibit K+ and Cl− currents. Resting membrane potential measurements were performed in control and mdx fibers immersed in the physiological Tyrode solution with sharp pipettes filled with 3 M KCl. Pipettes were pulled using the horizontal puller P2000 (Sutter Instrument) and had a resistance consistently lying in the range of 4–6 MOhm for patch pipettes and 6–7 MOhm for sharp electrodes. Electric currents were acquired and low-pass filtered at 10 kHz with a HEKA EPC-7 amplifier (HEKA Elektronik), and then digitized with a Digidata 1322 digitizer (Molecular Devices) at 100 kHz. Patch-clamp currents were normalized per the area of the patch by multiplying currents by the resistance of the corresponding pipette and then dividing by the average pipette resistance.
Stimulation protocols used to study activation and inactivation properties of VGSCs are shown on the insets of Fig. 3 B and Fig. 4 A. In short, patches were held at −100 mV between stimulation applications. The inactivation-recovery prepulses to −120 mV were applied for 30 ms and then potential was stepped up to voltages ranging from −70 to +40 mV or, during the determination of Na+ reversal potential, to +100 mV in steps of 10 mV for 20 ms. To study inactivation properties, the patches were held for 500 ms at voltages ranging from −120 to −10 mV in steps of 10 mV and currents were sampled at 10 mV for 50 ms. For the purpose of leak subtraction, the stimulation protocols were extended by a 20-ms step from the holding potential of −100 mV to −80 mV. Additionally, after performing recordings as described, currents were acquired using the online leak subtraction as implemented in Clampex program (pClamp-9 suite, Axon Instruments). Both methods allowed equivalently good removal of leakage currents during the study of activation properties of Nav1.4 channels. Only online leak subtraction was used to study the inactivation properties of these channels.
Figure 3.

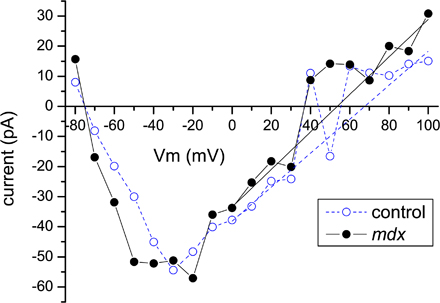
Electrophysiological measurements of Nav1.4 activity in cell-attached patches. (A) Representative traces of cell-attached Na+ currents in C57BL/6J (top) and mdx5cv (bottom) FDB fibers. Of note are the longer inactivation tails in mdx5cv traces. Currents were elicited with an activation protocol shown on the inset of B. (B) Comparison of average currents (top) and inactivation time constants τi (bottom) for the control (open circles, 28 patches) and mdx (filled circles, 33 patches) recordings. Inactivation time constants for potentials below −40 and above 30 mV could not be reliably estimated because of small current amplitude and are not shown. Values are reported as means ± SEM.
Figure 4.

Steady-state activation and inactivation. (A) Representative steady-state activation and inactivation curves. Individual curves were fit with the Boltzmann function, and midpoints were averaged per patch and then overall averages were calculated, yielding no significant differences between activation thresholds (−33.8 ± 1.5 mV for control and −29.6 ± 2 mV for mdx5cvpatches). However, a shift of ∼10 mV toward more positive potentials for inactivation thresholds was observed in mdx5cv (−89.4 mV ± 2 mV for control and −79.5 mV ± 2.5 mV for the mdx5cv fibers, P = 0.01). The stimulation protocol used to produce currents for the inactivation curves is shown on the inset. (B) Window currents calculated from the determined average activation/inactivation thresholds and slopes at midpoint. Vertical line at −50 mV represents measured resting membrane potential, emphasizing an ∼2× increase in opening probability of Nav1.4 channels at rest in mdx fibers.
Individual responses at every sampling potential were extracted and fit with the Hodgkin-Huxley model with the help of custom made software, which can be downloaded at http://www.unige.ch/sciences/pharm/fagie/software/elphys_utils-20080407.tar.bz2. Fit convergence was verified by recalculating the peak currents from the obtained fit parameters and comparing them with the apparent peak currents, as well as by fitting only tail regions of VGSC responses using Clampfit 9 software (pClamp-9 suite) and comparing the resulting inactivation rates (τi). Averages were computed by first calculating per patch means of the corresponding individual values and then establishing the overall averages. Typically, three recordings were performed for every patch. Patches where a significant rundown of signal or nonspecific activity was detected were discarded. Reversal potential for Na+ was determined by fitting tails of individual IV curves in the region where the tails were linear (typically 10–30 or, for patches with large currents, 40 mV) and averaging the calculated intersections with I = 0 first per patch and then for all patches. These data analyses were supplemented by traces with the sampling voltage steps extended to 100 mV, in order to perform control measurements of zero-current crossings. Details of these data analyses can be found in online supplemental material. Statistical modeling and composition of histograms (Fig. 5 B) were performed with the help of the R project for statistical computing (http://www.r-project.org/). Plots of sample Nav1.4 traces, steady-state activation and inactivation curves, and fit parameters were prepared using Microcal Origin software (Origin Laboratory).
Figure 5.

Nav1.4 channel clusters in sarcolemma of control and mdx fibers. (A) Confocal images of Nav1.4 localization. Isolated fibers were immunolabeled with mouse antibodies to Nav1.4. A fluorescent signal was observed primarily at the sarcolemma. The luminescence distribution plot (inset) shows nonuniform density corresponding to apparent clusters of Na+ channels. (B) Distribution of Nav1.4 expression levels in cell-attached patches (model parameter A in fits with the Hodgkin-Huxley model) displays a similar non-Gaussian shape corresponding to that observed in confocal microscopy. The continuous curve represents the distribution density of amplitudes calculated using a Gaussian kernel density estimate with the bandwidth of 40 pA from the data points plotted below the histogram as thin vertical lines.
Online Supplemental Material
The online supplemental material (available at http://www.jgp.org/cgi/content/full/jgp.200810024/DC1) contains the detailed description of data analyses performed in order to reliably measure Na+ reversal potential, including Fig. S1.
RESULTS
Sodium Influx through Nav1.4 Is Increased in mdx Muscle
To investigate whether Na+ influx through voltage-gated Na+ channels was altered in dystrophin-deficient muscle, we studied the global Na+ influx using 22Na+ as a tracer. The observed basal Na+ influx in C57BL/6J FDB muscle was 31.5 ± 4.4 cpm/mg and was taken as 100%. As can be seen in Fig. 1, Na+ influx increased by 20 ± 5.6% (P = 0.003) in mdx5cv muscles compared with that of control FDB muscles. Similar increases associated with dystrophin deficiency were found in EDL and SOL muscles (unpublished data). We then tested whether the basal Na+ influx measured in control and dystrophic muscles was affected by TTX, a high-affinity inhibitor of Nav1.4 channels (Ritchie and Rogart, 1977). Whereas TTX at a concentration of 3 × 10⁻⁹ M had no significant effect on control muscles, it produced a significant reduction of Na+ entry in mdx5cv muscles (30%, Fig. 1). TTX treatment restored Na+ influx into mdx5cv fibers to a level indistinguishable from that of C57BL/6J muscles, suggesting that Nav1.4 channels play an important role in regulating [Na+] under the sarcolemma of mdx muscles.
Figure 1.

TTX blocks enhanced basal sodium influx in mdx5cv FDB muscle. Isolated muscles were incubated for 5 min in the presence of 22Na+ with or without 3 × 10⁻⁹ M TTX. After extensive washing, muscle tissue–associated radioactivity was quantified by scintillation counting. Influx in mdx5cv muscles and inhibition of influx by TTX is expressed as percentage of influx in the nontreated control (C57BL/6J) muscle (ANOVA: **, P < 0.01; ***, P < 0.001). Values are reported as means ± SEM.
Expression of Nav1.4 Is Decreased in mdx FDB Muscle
To investigate whether the increased sodium entry observed in mdx5cv cells is caused by overexpression of Nav1.4 channels, we performed Western blot and real time PCR analyses. Protein concentrations were measured in triplicates to guarantee equal loading. Nav1.4 density was expressed in arbitrary units using SERCA1 as an internal control (Boittin et al., 2006). Surprisingly, Nav1.4 protein levels were 35% smaller in mdx5cv than in control muscles (Fig. 2, A and B). We and others (Ribaux et al., 2001) obtained similar results with EDL muscle where Nav1.4 expression was decreased by 40% in mdx5cv compared with control muscle (unpublished data). Thus, Nav1.4 channels are underexpressed, rather than overexpressed, in mdx fibers, highlighting the importance of a proper explanation of the increased Na+ entry.
Figure 2.

Nav1.4 expression levels in mdx and C57BL/6J FDB muscles. (A) Representative Western blot analysis of Nav1.4 channels from FDB muscle extracts of control C57BL/6J and mdx5cv mice. Each slot represents the extract from one FDB muscle of one 12–16-wk-old mouse. (B) Quantification of Nav1.4 expression levels (four mice/group). Protein concentrations were measured in triplicate to guarantee equal loading, and Nav1.4 density is expressed in arbitrary units using SERCA1 as an internal control (**, P < 0.01; Student's unpaired t test). Values are reported as means ± SEM.
Sodium Current Is Observed at Similar Levels in Control and mdx Fibers
To determine whether the increase in [Na+]i observed in mdx5cv fibers is caused by changes in kinetic properties of Na+ channels, we performed patch-clamp measurements. To avoid possible changes in the expression levels of Nav1.4 channels following fiber isolation, measurements were performed within a few hours after harvesting the cells.
Fig. 3 A shows typical Na+ currents induced in FDB fibers using the protocol displayed on the inset of Fig. 3 B. Patches were held at −100 mV between stimulation applications. The inactivation-recovery prepulses to −120 mV were applied for 30 ms and then potential was stepped up to voltages ranging from −70 to +40 mV in steps of 10 mV for 20 ms. The addition of 50 nM TTX to the pipette solution blocked this activity completely (unpublished data), confirming prevalence of the skeletal muscle isoform in these fibers, namely Nav1.4. Current–voltage relationships are shown in Fig. 3 B, top panel. While average currents suggest an increased Na+ entry in mdx5cv fibers, this difference was not significant.
Nav1.4 Channels Inactivate Slower in mdx Fibers
To assess kinetic properties of Na+ channels we fit individual traces with the Hodgkin-Huxley model (Hodgkin and Huxley, 1952) determining the amplitude parameter A, corresponding to the density of the channels in the patch and activation/inactivation time constants τon and τi. The fit parameters of individual traces thus obtained were used to recalculate current at the peak and compare it with the apparent value for the trace, as a means of controlling fit convergence. Additionally, tails of randomly selected traces were fit with exponential dependence and the resulting time constants were compared with the corresponding τi's of the model fits. Fitting the traces with the Hodgkin-Huxley model yielded good convergence for the traces exhibiting maximum peak currents >10 pA. Patches with maximum peak current <10 pA did not show good fit convergence and were considered empty (3 of 31 or ∼10% C57BL/6J and 9 of 42 or ∼20% mdx5cv).
Data analysis yielded amplitude parameters A of 284 ± 50 pA for control and 216 ± 34 pA for mdx5cv fibers. As with average currents, average amplitudes suggest a possible, but not significant, difference in the expression levels of Nav1.4 channels. Peculiarly, while average currents tended to be larger, the average amplitudes hint at a smaller expression level of Nav1.4 in mdx5cv as compared with C57BL/6J fibers.
These observations were complemented by a significant increase of inactivation time constants (τi). While values obtained for control fibers corresponded to those reported (Ulbricht, 2005), the τi's of mdx5cv fibers were ∼1.5 times larger (Fig. 3 B, bottom). This increase in open dwell times causes an increased entry of Na+ into the cells and allows reconciling the inverse signs of change in observed currents and estimated amplitudes. Activation time constants of the currents were typically in the 0.1–0.2 ms range, corresponding to the resolution attainable at the used bandwidth of 10 kHz. Therefore, no conclusion could be drawn as to whether τon values in control fibers differ from those of mdx5cv fibers.
Nav1.4 Channels Inactivate at Less Negative Potentials in mdx Fibers
Representative steady-state activation and inactivation curves are shown in Fig. 4 A, using the stimulation protocols shown in the insets of Fig. 3 B and Fig. 4 A. To sample inactivation properties, the patches were held at voltages ranging from −120 to −10 mV and were changed in steps of 10 mV for 500 ms and currents were sampled for 50 ms. Individual curves were fit with the Boltzmann function, and the transition thresholds were first averaged per patch before overall averages were produced. The thresholds of steady-state activation did not differ significantly (−33.8 ± 1.5 mV for control and −29.6 ± 2 mV for mdx5cv fibers). On the other hand, steady-state inactivation thresholds were shifted by ∼10 mV toward more positive potentials for mdx5cv in comparison with those of control fibers (−89.4 mV ± 2 mV for control and −79.5 mV ± 2.5 mV for mdx5cv fibers, P = 0.01).
To investigate the effect of this shift, resting membrane potentials (Vrest) of the fibers were determined with sharp electrodes filled with 3 M KCl. Resting membrane potentials were measured in I = 0 mode, yielding −49.7 ± 1.5 mV in control and −50.8 ± 1.6 mV in mdx fibers (mean ± SEM). Fig. 4 B shows window currents calculated for the above average activation and inactivation curve parameters for control (dashed line) and mdx (solid line) fibers with a vertical dashed line marking the measured Vrest position. As can be seen, at such Vrest one can expect an approximately twofold higher probability of Nav1.4 opening in mdx as compared with control cells.
[Na+] under the Sarcolemma Is Elevated in mdx Fibers
To assess how these changes in Nav1.4 gating properties influence [Na+] under the sarcolemma, we measured the reversal potential for Na+. Tail regions of current–voltage relations (typically 10–30 mV or, for the traces with larger currents, 40 mV) were fit with linear dependence and the intersections with the I = 0 line were determined and averaged for mdx and control cells as described, yielding 69.9 ± 5 mV for control and 51.7 ± 5 mV for mdx fibers (28 and 33 patches correspondingly, IV curves generated as described in previous subsections were used). To control the representativity of such fits we extended the activation protocol (Fig. 3 B, inset) to apply sampling voltage steps of as much as 100 mV, with the intention of directly observing the reversal of the Na+ current. Unfortunately application of large voltages made patches unstable, significantly decreasing the proportion of surviving patches. Additionally, small overall currents caused large distortions in the derived IV curves in the zero-crossing region (40–100 mV), yielding results with a significant margin of systematic error (see online supplemental material for a detailed description, available at http://www.jgp.org/cgi/content/full/jgp.200810024/DC1) which, however, agree with the reversal potentials derived by fitting stable tail regions, as described above, at 67.8 ± 6 mV for control (five patches) and 52.7 ± 5 mV for mdx fibers (six patches), yielding overall averages of 69.6 ± 5 mV for control and 52.5 ± 5 mV for mdx (mean ± SEM, P = 0.02).
At the conditions under which the recordings were performed (TEA and DIDS in the pipette, traces with nonspecific activity discarded), only the Na+ currents could be observed, allowing us to use the Nernst equation in order to derive the [Na+] under the sarcolemma. The calculations were done for the individual traces and then calculated concentrations were averaged to produce overall [Na+] levels, yielding 9.3 ± 2 mM for control C57BL/6J fibers and 18.1 ± 4 mM for mdx5cv fibers.
Nav1.4 Channels Cluster in Sarcolemma of Control and mdx Fibers
One peculiar feature observed during patch clamp recording was an unusually high variability of Na+ currents recorded in the patches. Differences of 40 pA in current and almost 70 pA in amplitude (an ∼30% difference, fit parameter A above) were made insignificant because of patch-to-patch variability. On the other hand, the τi's were very consistent and significantly differed between control and mdx5cv fibers.
To investigate whether such variability was caused by ion channel clustering in the plasma membrane, we immunolabeled mdx5cv and C57BL/6J fibers with monoclonal anti-SkM1 antibody and performed confocal imaging of labeled fibers. Fig. 5 A shows the confocal image of part of the mdx5cv fiber sarcolemma, with the inset showing luminescence distribution in the part containing the membrane. The distribution was not simply Gaussian, as one would expect in case of diffuse distribution of ion channels in the plasma membrane; instead it had a characteristic tail, corresponding to hot spots representing clusters of the channels apparent on the image. Fig. 5 B shows the distribution of amplitude parameters, representative of channel expression density at the point of patch formation, calculated from Hodgkin-Huxley fits to the currents in cell-attached patches made to the mdx5cv fibers as described above. A similar tail, emphasizing the asymmetrical presence of amplitudes larger than the value of the main peak, can be observed in this panel. Control fibers yielded a similar distribution of amplitude parameter densities, thus confirming the hypothesis that Nav1.4 channels cluster in the sarcolemma of muscle fibers.
Distribution Pattern of Nav1.4 Is Altered in Isolated mdx Fibers
To further investigate the distribution of VGSCs, and to test whether the absence of dystrophin influences Na+ channel gating properties via syntrophin, we performed confocal imaging of mdx5cv and control fibers labeled with an anti-SkM1 monoclonal antibody against Nav1.4, and a polyclonal antiserum against α1-syntrophin, as described above.
Confocal images captured at the surface of the cells revealed an intense signal at the muscle endplate, as assessed by fluorescently labeled α-bungarotoxin (not depicted), and on the surface of the fiber, dispersed over the area of the fiber (Fig. 6 A). By contrast, in the confocal planes crossing the cells, labeling was localized to the sarcolemma, with only a background level of fluorescence in the cytoplasm (Fig. 6 B). No fluorescence was detected when primary antibodies were omitted (not depicted).
Figure 6.

Distribution pattern of Nav1.4 is altered in mdx fibers. Nav1.4 channel distribution in isolated FDB fibers; comparison between C57BL/6J and mdx5cv (four mice each condition). Nav1.4 immunofluorescence (green) in single C57BL/6J fibers (left) and mdx5cv fibers (right) captured at the surface (A) or in deeper part of the cells (B). (C) 4× zoom of A.
Fibers from C57BL/6J muscle showed a longitudinally striated pattern (Fig. 6 C); 53 out of 63 fibers exhibited a pattern parallel to the longitudinal axis of the fibers reminiscent of the L-domain of costamers (Bloch et al., 2002). Interestingly, this pattern was present in only 16 out of 57 mdx5cv fibers. The majority of fibers showed a disorganized labeling (Fig. 6 C), suggesting that, at the sarcolemma of mdx5cv fibers, Nav1.4 channel distribution is altered by the absence of dystrophin and undergoes a change in organization as described for other plasma membrane–associated proteins. Additionally, in good agreement with the results obtained by Western blot analysis, we observed a decrease in Nav1.4 channel density in mdx5cv as compared with control fibers (Fig. 6 C).
To investigate the localization of the Nav1.4, we coimmunolabeled it with α1-syntrophin, the main syntrophin expressed in muscle. We observed a reduced expression of this syntrophin in mdx5cv muscle (Fig. 7 B), similar to what was reported by Williams and Bloch (1999b). As expected, Nav1.4 colocalized quite well with α1-syntrophin at the sarcolemma in both types of muscle (Fig. 7 C), repeating a costameric pattern similar to that of Nav1.4 channels, strongly suggesting that syntrophins are an important link between Nav1.4 and dystrophin, whose absence leads to alterations in distribution patterns of both proteins studied here.
Figure 7.

Nav1.4 colocalizes with α1-syntrophin. High magnification views of C57BL/6J fibers (left) and mdx5cv fibers (right). Coimmunolabeling of Nav1.4 (A) and α1-syntrophin (B) in C57BL/6J fibers and mdx5cv fibers. (C) Merged fluorescence.
Tetrodotoxin Increases Survival of Isolated mdx Fibers
To determine the involvement of VGSCs in mdx5cv muscle cell death we investigated the effect of tetrodotoxin on survival of isolated fibers. As shown in Fig. 8 A, the percentage of living C57BL/6J and mdx5cv fibers in culture decreased with time, however at a faster rate in the case of mdx cells. For the first 3 d in culture ∼25% less mdx5cv fibers survived than C57BL/6J ones.
Figure 8.

Tetrodotoxin improves survival of isolated mdx fibers. Isolated fibers were plated on 24-mm diameter Matrigel-coated culture dishes and left for 4 h at 37°C. Afterwards buffer was added with or without TTX (3 × 10⁻⁹ M) and the numbers of living cells were immediately determined. Time 0 is taken as 100%. (A) Comparison between C57BL/6J (n = 5) and mdx5cv (n = 5) fibers surviving at 0, 1, 2, and 3 d after addition of the buffer. Effect of 3 × 10⁻⁹ M TTX on C57BL/6J (B) and mdx5cv (C) fiber survival (Student's unpaired t test: *, P < 0.05; **, P < 0.01). Values are reported as means ± SEM.
Furthermore, we assessed the effect of TTX on fiber survival (Fig. 8, B and C). Two concentrations of TTX (3 × 10⁻⁹ and 10−8 M) that specifically inhibit Nav1.4, but not Nav1.5, channels (Ritchie and Rogart, 1977) were tested and yielded identical results. We observed no significant effect on C57BL/6J survival (Fig. 8 B); however, TTX significantly improved survival of mdx5cv fibers in culture, bringing the survival rate close to that of control fibers (Fig. 8 C). On the other hand, the sub-IC50 concentration of TTX (10−9 M) did not have any significant effect.
DISCUSSION
Dystrophic muscle fibers from humans or mice have been shown to have an elevated concentration of Na+ under their sarcolemma (Dunn et al., 1993; Constantinides et al., 2000; Allen, 2004). However, the mechanisms involved in this elevation have not been investigated so far. We report here that deregulation of Nav1.4, the VGSC isoform that accounts for the bulk of Na+ channels expressed in the sarcolemma of skeletal muscle, significantly affects Na+ influx in mdx muscle fibers and can, at least partially, explain this increased [Na+]i. While increased Na+ entry in stimulated mdx muscle, in association with up-regulated activity of stretch-activated channels has been known (Yeung et al., 2003; Allen, 2004), the alteration of Nav1.4 gating properties reported in this paper appears to be important for both basal and stimulated Na+ entry and likely plays no less important a role in causing excessive Na+ entry in mdx muscle fibers.
We observed that Na+ entry in dystrophic fibers, as assessed by 22Na+ uptake, was increased by 20% over that of control fibers. Incubating the cells with a concentration of TTX that specifically blocks the skeletal (Nav1.4), but not the cardiac (Nav1.5), isoform (Goldin, 2001) produced no significant effect on control fibers, while it reduced the influx in mdx5cv muscle to the control level. In agreement with this, fiber survival was significantly worsened in the case of mdx5cv cells, but could also be restored to the levels observed in control fibers by application of TTX (Fig. 8 C). Taking into account that currents in cell-attached patches were completely blocked by TTX, we confirm that Nav1.4 is the primary isoform expressed in the sarcolemma of both dystrophic and control fibers and that the up-regulated activity of Nav1.4 channels is primarily responsible for the increase in Na+ influx in dystrophin-deficient muscle cells, significantly affecting their survival.
Similar effect of TTX has been reported in neurons, where it reduced neuronal death and blocked Na+ entry during hypoxia, improving survival of cultured neocortical neurons (Banasiak et al., 2004). In that case, TTX attenuated apoptotic neuronal death via a reduction in caspase-3 activation. Moreover, veratridine, a stimulator of VGSC activity, induced Na+ overload, leading to increased cell death (Koike et al., 2000). Thus, it can be argued that maintaining a proper Na+ balance is important for optimal muscle survival and function. In particular, Na+ overload in mdx5cv fibers significantly contributes to cell degradation and early death.
One possible explanation for the increase in Na+ influx is that it is caused by overexpression of Nav1.4 in mdx muscles. However, our Western blot measurements, as well as estimates of expression levels of Nav1.4 channels in patch pipettes together with a higher incidence of empty patches showed that this was not the case. Furthermore, we investigated whether the distribution of Na+ channels in the sarcolemma was disturbed in dystrophin-deficient cells. Analysis using confocal imaging of isolated FDB fibers allowed an accurate localization of the protein. Channels were observed exclusively at the membrane and showed an unusual longitudinally oriented pattern likely corresponding to the longitudinal (L) domains oriented in parallel to the long axis of the muscle fiber (Bloch et al., 2002). These L domains, while present universally in normal fibers, were often distorted in mdx myofibers due to disorganized costamers. It seems that Nav1.4 protein is directly attached to an L domain in normal muscle, and the absence of dystrophin leads to irregularities in its anchorage, implying that the DGC is required for proper localization and function of the VGSCs.
Interestingly, Nav1.4 in our experiments with skeletal muscle colocalized with syntrophin, similarly to what has been described for the cardiac isoform Nav1.5 (Gee et al., 1998; Gavillet et al., 2006). Syntrophins are costameric proteins known to interact directly with both types of muscle VGSCs, however they also show an intercostameric pattern, responsible for the longitudinal strands (Williams and Bloch, 1999a,b). In mdx muscle their expression is lower than in control muscle and their distribution shows a broad range of disrupted patterns, similarly to what we observed for Nav1.4 (Bloch et al., 2002). Moreover Gee and coworkers observed, in vitro, that the C-terminal biotinylated peptide of Nav1.4 binds syntrophin via its PDZ domain (Gee et al., 1998). Taken together with our observations this suggests that α1-syntrophin is the main link between dystrophin and Nav1.4. and that dystrophin deficiency leads to disruption of distribution of both of these proteins. Work is in progress to assess the role and the distribution of Nav1.5, as well as the interaction of β1 and β2 syntrophins with Nav1.4 in dystrophin-deficient muscle cells.
The observation of an altered distribution pattern of Nav1.4 channels in mdx5cv fibers, which in itself involves important considerations, cannot fully explain the increase in Na+ influx in view of the smaller amount of the protein in sarcolemma. To resolve this ambiguity we turned to patch-clamp measurements of Na+ currents to study how the gating properties of Nav1.4 are modified in dystrophin-deficient cells. Unfortunately, differences in overall currents and amplitude parameters, while not small, were masked by the high patch to patch variability due to nonuniform distribution of channels. Nonetheless it is interesting to note that mean currents were larger in mdx5cv fibers while amplitudes, representing the expression level of Nav1.4, were smaller. On the other hand, the finding that inactivation times were consistently and by a big margin larger in mdx5cv cells enables to explain the increased stimulated inward Na+ current in spite of the decreased Nav1.4 expression levels.
Another important observation, producing even more significant effect on basal Na+ entry, is the shift of the inactivation threshold by ∼10 mV toward less negative potentials. While resting membrane potentials were not affected by the absence of dystrophin, the shift in the inactivation curve itself is sufficient to cause an approximately twofold higher activity of Nav1.4 channels at the measured Vrest of approximately −50 mV. It is important to note that this up-regulation of basal VGSC activity is not specific for this exact value of Vrest. Window currents are similarly up-regulated by a factor of two to four in the whole range of physiologically sensible resting membrane potentials, i.e., between −50 and −90 mV. Therefore, while it may be likely that the measured value of Vrest is specific to the particular genetic background of these mice or the investigated muscle type, and indeed estimates of Vrest vary widely in literature (Head, 1993; Woods et al., 2005), the end effect of significantly higher basal VGSC activity should hold in the majority of cases.
These observations of longer open dwell times and greater basal activity of Nav1.4s produce a good ground for explaining the observed approximately twofold increase in [Na+] under the sarcolemma of mdx5cv fibers. Indeed, combining the 1.5 factor of longer open dwell times with the 2× higher frequency of openings at the Vrest of −50 mV, or even 3× at Vrest of −75 mV, we arrive at ∼3× or even 5× greater forcing of Na+ entry by the Nav1.4 channels at the corresponding resting membrane potentials, sufficient to sustain elevated [Na+]i even in view of an ∼20% smaller driving force for Na+ in mdx cells at rest. Such an increase is in good agreement with measurements reported elsewhere (Yeung et al., 2003), performed using Na+ green fluorescence. Thus, it can be argued that changes in Nav1.4 gating properties significantly affect the Na+ balance in FBD muscle fibers, producing an important long-term effect even in nonexercised muscle.
It is interesting to note that no significant changes in Na+ currents in mdx-deficient EDL fibers were reported by others (Mathes et al., 1991). One apparent difference that could account for this discrepancy is the different type of muscle investigated; however there are other avenues to investigate. In our study, mice were age matched (12–16 wk old), corresponding, in mdx5cv mice, to the phase of slow chronic disease after full recovery from the initial massive necrosis episode. Using mice of that age may have been an important factor, maximizing the differences between control and mdx-deficient fibers. Moreover, careful examination of the figure in Mathes et al. suggests that these authors, similarly to us, may have been faced with significant patch-to-patch variability, possibly masking the difference between control and mdx fibers, with steady-state inactivation thresholds being slightly, but not significantly, shifted toward positive potentials, and τi's being slightly longer in mdx cells.
Deregulation, by the absence of dystrophin, of Nav1.4 activity leading to Na+ overload is likely connected with multiple other changes reported in mdx fibers. Thus, the reduced expression levels of Nav1.4 channels might be explained by a compensatory mechanism down-regulating, via the E box motif, their expression in response to the increase in Na+ influx via VGSCs. This motif plays a critical role in regulating Nav1.4 expression through binding to a complex of proteins (Kraner et al., 1998). Another compensatory mechanism may be causing an increased activity and expression of the Na+/K+ATPase in order to counteract the [Na+]i overload in mdx muscle (Dunn et al., 1995). Alternatively, an elevated Na+ influx in skeletal muscle as well as in neurons, might lead directly either to caspase-3 activation, or to a subsequent Ca2+ entry, due to the Na+/Ca2+ exchanger, which in its reverse mode induces Ca2+-dependent cell death (Banasiak et al., 2004). Another possibility is that other proteins might be involved in skeletal muscle dysfunction. For example, the β-subunit of the channel, thought to have a regulatory function, may be altered by the absence of dystrophin. Such a dysfunction of the β-subunit could be responsible for the decreased inactivation rate observed in mdx5cv fibers. Work is in progress to determine events downstream of Na+ overload leading to increased cell death in mdx5cv fibers.
Supplementary Material
Acknowledgments
We thank M. Schaub for providing anti–α1-syntrophin antibodies, and F.X. Boittin and O.M. Dorchies for their suggestions and advice. We are grateful to J.L. Bény (University of Geneva, Geneva, Switzerland) for letting us use some of his equipment.
This study was supported by grants from the Swiss National Science Foundation (grant 3100A0-109981), the Swiss Foundation for Research on Muscular Diseases, and the Association Française contre les Myopathies.
Olaf S. Andersen served as editor.
C. Hirn and G. Shapovalov contributed equally to this paper.
Abbreviations used in this paper: DGC, dystrophin–glycoprotein complex; DMD, Duchenne muscular dystrophy; FDB, flexor digitorum brevis; TTX, tetrodotoxin; VGSC, voltage-gated sodium channel.
References
- Allen, D. 2004. Skeletal muscle function: role of ionic changes in fatigue, damage and disease. Clin. Exp. Pharmacol. Physiol. 31:485–493. [DOI] [PubMed] [Google Scholar]
- Banasiak, K.J., O. Burenkova, and G.G. Haddad. 2004. Activation of voltage-sensitive sodium channels during oxygen deprivation leads to apoptotic neuronal death. Neuroscience. 126:31–44. [DOI] [PubMed] [Google Scholar]
- Blake, D.J., A. Weir, S.E. Newey, and K.E. Davies. 2002. Function and genetics of dystrophin and dystrophin-related proteins in muscle. Physiol. Rev. 82:291–329. [DOI] [PubMed] [Google Scholar]
- Bloch, R.J., Y. Capetanaki, A. O'Neill, P. Reed, M.W. Williams, W.G. Resneck, N.C. Porter, and J.A. Ursitti. 2002. Costameres: repeating structures at the sarcolemma of skeletal muscle. Clin. Orthop. Relat. Res. 403:203–210. [DOI] [PubMed] [Google Scholar]
- Boittin, F.-X., O. Petermann, C. Hirn, P. Mittaud, O.M. Dorchies, E. Roulet, and U.T. Ruegg. 2006. Ca2+-independent phospholipase A2 enhances store-operated Ca2+ entry in dystrophic skeletal muscle fibers. J. Cell Sci. 119:3733–3742. [DOI] [PubMed] [Google Scholar]
- Catterall, W.A. 1988. Structure and function of voltage-sensitive ion channels. Science. 242:50–61. [DOI] [PubMed] [Google Scholar]
- Constantinides, C.D., J.S. Gillen, F.E. Boada, M.G. Pomper, and P.A. Bottomley. 2000. Human skeletal muscle: sodium MR imaging and quantification-potential applications in exercise and disease. Radiology. 216:559–568. [DOI] [PubMed] [Google Scholar]
- Dunn, J., N. Bannister, G.J. Kemp, and S.J. Publicover. 1993. Sodium is elevated in mdx muscles: ionic interactions in dystrophic cells. J. Neurol. Sci. 114:76–80. [DOI] [PubMed] [Google Scholar]
- Dunn, J.F., K.A. Burton, and M.J. Dauncey. 1995. Ouabain sensitive Na+/K+-ATPase content is elevated in mdx mice: implications for the regulation of ions in dystrophic muscle. J. Neurol. Sci. 133:11–15. [DOI] [PubMed] [Google Scholar]
- Fong, P.Y., P.R. Turner, W.F. Denetclaw, and R.A. Steinhardt. 1990. Increased activity of calcium leak channels in myotubes of Duchenne human and mdx mouse origin. Science. 250:673–676. [DOI] [PubMed] [Google Scholar]
- Gailly, P. 2002. New aspects of calcium signaling in skeletal muscle cells: implications in Duchenne muscular dystrophy. Biochim. Biophys. Acta. 1600:38–44. [DOI] [PubMed] [Google Scholar]
- Gavillet, B., J.-S. Rougier, A.A. Domenighetti, R. Behar, C. Boixel, P. Ruchat, H.-A. Lehr, T. Pedrazzini, and H. Abriel. 2006. Cardiac sodium channel Nav1.5 is regulated by a multiprotein complex composed of syntrophins and dystrophin. Circ. Res. 99:407–414. [DOI] [PubMed] [Google Scholar]
- Gee, S.H., R. Madhavan, S.R. Levinson, J.H. Caldwell, R. Sealock, and S.C. Froehner. 1998. Interaction of muscle and brain sodium channels with multiple members of the syntrophin family of dystrophin-associated proteins. J. Neurosci. 18:128–137. [DOI] [PMC free article] [PubMed] [Google Scholar]
- Goldin, A.L. 2001. Resurgence of sodium channel research. Annu. Rev. Physiol. 63:871–894. [DOI] [PubMed] [Google Scholar]
- Head, S.I. 1993. Membrane potential, resting calcium and calcium transients in isolated muscle fibres from normal and dystrophic mice. J. Physiol.. 469:11–19. [DOI] [PMC free article] [PubMed] [Google Scholar]
- Hodgkin, A.L., and A.F. Huxley. 1952. A quantitative description of membrane current and its application to conduction and excitation in nerve. J. Physiol. 117:500–544. [DOI] [PMC free article] [PubMed] [Google Scholar]
- Koenig, M., A.P. Monaco, and L.M. Kunkel. 1988. The complete sequence of dystrophin predicts a rod-shaped cytoskeletal protein. Cell. 53:219–226. [DOI] [PubMed] [Google Scholar]
- Koike, T., S. Tanaka, T. Oda, and T. Ninomiya. 2000. Sodium overload through voltage-dependent Na+ channels induces necrosis and apoptosis of rat superior cervical ganglion cells in vitro. Brain Res. Bull. 51:345–355. [DOI] [PubMed] [Google Scholar]
- Kraner, S.D., M.M. Rich, R.G. Kallen, and R.L. Barchi. 1998. Two E-Boxes are the focal point of muscle-specific skeletal muscle type 1 Na+ channel gene expression. J. Biol. Chem. 273:11327–11334. [DOI] [PubMed] [Google Scholar]
- Mathes, C., F. Bezanilla, and R.E. Weiss. 1991. Sodium current and membrane potential in EDL muscle fibers from normal and dystrophic (mdx) mice. Am. J. Physiol. Cell Physiol. 261:C718–C725. [DOI] [PubMed] [Google Scholar]
- Ribaux, P., F. Bleicher, M.L. Couble, J. Amsellem, S.A. Cohen, C. Berthier, and S. Blaineau. 2001. Voltage-gated sodium channel (SkM1) content in dystrophin-deficient muscle. Pflugers Arch. 441:746–755. [DOI] [PubMed] [Google Scholar]
- Ritchie, J., and R. Rogart. 1977. The binding of saxitoxin and tetrodotoxin to excitable tissue. Rev. Physiol. Biochem. Pharmacol. 79:1–50. [DOI] [PubMed] [Google Scholar]
- Ruegg, U.T., V. Nicolas-Metral, C. Challet, K. Bernard-Helary, O.M. Dorchies, S. Wagner, and T.M. Buetler. 2002. Pharmacological control of cellular calcium handling in dystrophic skeletal muscle. Neuromuscul. Disord. 12:S155–S161. [DOI] [PubMed] [Google Scholar]
- Ulbricht, W. 2005. Sodium channel inactivation: molecular determinants and modulation. Physiol. Rev. 85:1271–1301. [DOI] [PubMed] [Google Scholar]
- Williams, M.W., and R.J. Bloch. 1999. a. Differential distribution of dystrophin and β-spectrin at the sarcolemma of fast twitch skeletal muscle fibers. J. Muscle Res. Cell Motil. 20:383–393. [DOI] [PubMed] [Google Scholar]
- Williams, M.W., and R.J. Bloch. 1999. b. Extensive but coordinated reorganization of the membrane skeleton in myofibers of dystrophic (mdx) mice. J. Cell Biol. 144:1259–1270. [DOI] [PMC free article] [PubMed] [Google Scholar]
- Woods, C.E., D. Novo, M. DiFranco, J. Capote, and J.L. Vergara. 2005. Propagation in the transverse tubular system and voltage dependence of calcium release in normal and mdx muscle fibres. J Physiol. 568:867–880. [DOI] [PMC free article] [PubMed] [Google Scholar]
- Yeung, E.W., S.I. Head, and D.G. Allen. 2003. Gadolinium reduces short-term stretch-induced muscle damage in isolated mdx mouse muscle fibres. J. Physiol. 552:449–458. [DOI] [PMC free article] [PubMed] [Google Scholar]
Associated Data
This section collects any data citations, data availability statements, or supplementary materials included in this article.