

Abstract
The distribution of potassium conductance over the surface of freshly dissociated salamander astrocytes was determined by monitoring cell depolarizations evoked by focal increases in the extracellular potassium concentration. The specific potassium conductance of the endfoot processes of these cells was approximately tenfold higher than the conductance of other cell regions. This dramatically nonuniform conductance distribution may play an important role in the regulation of extracellular potassium levels by glia in the brain.
Although astrocytes outnumber all other types of glial cells and neurons in the vertebrate brain, their membrane properties and functions are not well understood (1, 2). Müller cells, the principal glial cells of the retina, resemble astrocytes in many respects. In Müller cells, 95 percent of the total cell membrane conductance is localized to the cell’s endfoot process (3, 4). It is not known whether this striking membrane specialization occurs only in these specialized retinal cells or whether membrane conductance is also distributed nonuniformly across the surface of all astrocytes throughout the brain. I have addressed this issue by determining the distribution of potassium conductance over the surface of freshly dissociated astrocytes.
Astrocytes were isolated from the optic nerve of the salamander Ambystoma tigrinum. Optic nerves were excised with the meninges intact and partially teased apart before incubation in papain [0.6 mg/ml in Hepes-buffered Ringer solution; see (4) for composition of Ringer solutions] for 30 minutes at 28°C. They were then washed several times in Hepes-Ringer and maintained at 0°C for 3 to 4 hours before the cells were dissociated by gentle trituration. Isolated cells were placed in a recording chamber and perfused with a bicarbonate-buffered Ringer solution (containing 2.5 mM K+) maintained at 15°C. Experiments were performed on cells within 2 hours of dissociation.
The cells isolated with this dissociation procedure all had a similar appearance. They had several stout, branching processes radiating from a prominent soma. These cells were provisionally identified as astrocytes on the basis of their appearance and because astrocytes are the principal cell type found in the salamander optic nerve. [Amphibian optic nerves contain no intrinsic neurons and few myelinated fibers or oligodendrocytes (5, 6).] The radial processes of these cells terminated in bulbous enlargements. These were the endfeet, which lie at the ends of astrocyte processes in the intact brain and optic nerve. Cells had from 3 to 17 endfeet each, although the exact number was sometimes difficult to determine (mean = 8.7; n= 30). Some radial processes lacked endfeet, probably because they were broken off during dissociation.
Dissociated cells were characterized by immunofluorescent labeling of glial fibrillary acidic protein (GFAP), a characteristic cytoplasmic marker of astrocytes (7). All dissociated cells were labeled heavily with monoclonal antibodies to GFAP (Fig. 1), identifying them conclusively as astrocytes. Control cells, in which saline was substituted for the primary GFAP antibody, remained unlabeled. In a second series of controls, dissociated cells from the salamander retina were tested for GFAP immunoreactivity. Retinal neurons and photoreceptors showed no signs of labeling, while Müller cells [which contain GFAP (8)] were heavily labeled.
Fig. 1.
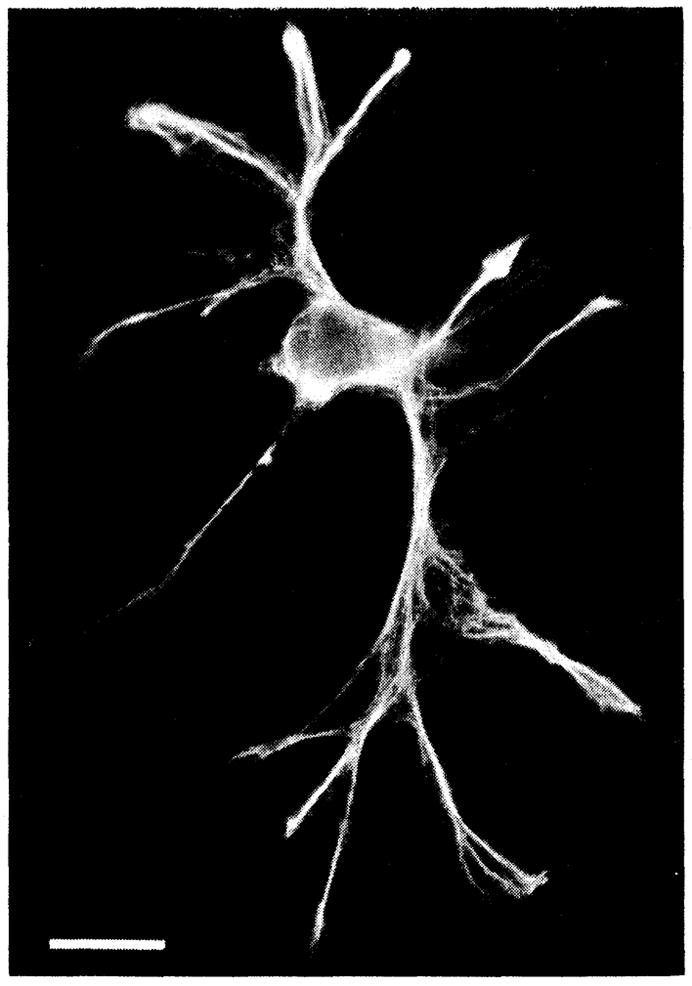
GFAP immunoreactivity of a freshly dissociated cell from the optic nerve of the salamander (19). This fluorescence micrograph shows that the cell was heavily labeled with antibodies to GFAP, identifying it unequivocally as an astrocyte. Scale bar, 20 μm.
Whole cell intracellular recordings were made from the somata of freshly dissociated astrocytes with patch clamp microelectrodes filled with 125 mM KCl (4). For cells in which the membrane potential had stabilized, the cell resting potential was −87.3 ± 1.9 mV (mean ± SD; n = 12). The cell input conductance, measured by injecting 50 to 100 pA depolarizing current pulses through die recording microelectrode, averaged 25.1 ± 18.3 nS and ranged from 6.0 to 55.6 nS (71 ± 49 Mohms; n = 12).
Astrocytes are known to be almost exclusively permeable to K+ at or near their resting potential (5, 9). It is not known, however, whether this K+ conductance is distributed uniformly over the cell surface or whether it is localized to particular regions (4). Regional differences in membrane K+ conductance were measured by monitoring the cell membrane potential as the extracellular K+ concentration ([K+]o) was raised over localized regions of die cell surface (4). Recordings were made with patch clamp electrodes attached to cell somata. Localized K+ increases were generated by pressure ejection of a 125 mM KCl solution from a second, extracellular micropipette positioned against the cell surface.
When K+ was ejected onto the endfeet of the cell (Fig. 2, traces a, b, g, and h) large depolarizations were recorded. In contrast, much smaller depolarizations were evoked when K+ was ejected onto the radial processes of the cell (Fig. 2, traces c, d, and f) or onto the soma (Fig. 2, trace e). The ejected K+ had free access to the surface of the cell at each ejection site, as demonstrated by the similarity of the mean time to peak for the endfoot responses (20.5 ± 4.9msec; n = 4) and for the radial process and soma responses (22.8 ± 5.9 msec; n = 4).
Fig. 2.
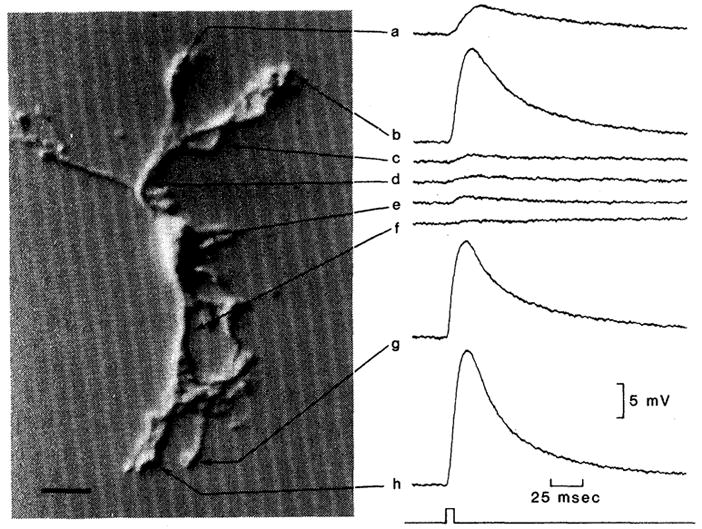
Responses of a freshly dissociated astrocyte to focal potassium ejections. Cell responses were recorded from the soma of the cell shown at left. Sites of K+ ejection are indicated in the photograph. Potassium ejections directed at the endfeet of the cell (traces a, b, g, and h) evoked significantly greater cell depolarizations than did ejections directed at the radial processes of the cell (c, d, and f) or the soma (e). The onset and duration of the K+ ejection pressure pulse are indicated below the traces. Scale bar for photograph, 20 μm.
Potassium ejection experiments were performed on a total of 14 dissociated astrocytes. In each case the responses of the endfeet to K+ were markedly greater than the responses of other cell regions. Potassium responses of the radial processes of individual cells averaged 10.4 ± 7.9 percent of the mean endfoot response of that cell (‘n = 31). Values ranged from 2.2 to 44.2 percent. Responses of the soma to K+ averaged 10.5 ± 8.7 percent of the mean end-foot response (n = 14) and ranged from 1.8 to 34.6 percent. Thus, the responses of the endfeet to K+ were nearly ten times greater than those of other cell regions.
Because the magnitude of a response to K+ ejection is directly proportional to the specific K+ membrane conductance of that region of the cell surface experiencing the [K+]o increase (10), these experiments demonstrate that astrocyte endfeet have a much higher specific K+ conductance than do other cell regions. The magnitudes of the K+ responses indicate that the mean specific membrane conductance of astrocyte endfeet was approximately 9.6 times greater than the conductance of the radial processes and the soma.
Because astrocyte endfeet lay at the ends of long thin processes, it was possible that endfoot responses to K+ were attenuated when measured in the cell soma. However, the end-to-end cytoplasmic conductance of astrocyte radial processes was much larger than the membrane conductance of the endfeet. Consequently, endfoot responses were attenuated only slightly [approximately 3 percent, on the basis of the attenuation equation in (4)].
These experiments demonstrate that the K+ conductance of dissociated salamander astrocytes is not distributed uniformly across the cell surface but is concentrated in the cells’ endfoot membrane. In dissociated Müller cells of the retina, the specific membrane conductance of the endfoot was 57 times that of other cell regions (4). Thus, the regional variations in the specific membrane conductance of astrocytes, although large, do not appear to be as great as the conductance variations in Müller cells.
It remains to be demonstrated that the high K+ conductance of dissociated astrocyte endfeet accurately reflects the membrane properties of astrocytes in vivo. This appears likely, however, because (i) evidence for high K+ conductance in the endfeet of Müller cells has been obtained both from dissociated Müller cells (3, 4) and from a number of in situ preparations (4, 11, 12) and (ii) it is unlikely that the dissociation procedure in my study would lead to a nonuniform conductance distribution if it were not already present in vivo.
Astrocytes are believed to regulate [K+]o in the brain by (among other mechanisms) K+ spatial buffering (13–15). This occurs when K+ enters astrocytes in regions of increased [K+]o generated by neuronal activity. To maintain net electrical neutrality, an equal amount of K+ exits from these cells, or from astrocytes electrically coupled to them, in regions where [K+]o is lower. The net effect of this K+ current flow is to transfer K+ from regions where [K+]o is elevated to regions where [K+]o is low.
The high K+ conductance of astrocyte endfeet may function to make K+ spatial buffering a far more powerful process than previously envisioned. In the absence of a membrane specialization, K+ spatial buffering would function to transfer excess K+ from the site of a [K+]o increase to other regions of neural tissue. Because astrocyte endfeet have high K+ conductance, however, the excess K+ would be preferentially shunted out through the endfeet. This directed flow of K+ spatial buffering current through the endfeet is termed “K+ siphoning” and has been demonstrated experimentally in Müller cells (16).
Astrocyte endfeet terminate on the pial surfaces of the brain and on brain capillaries (1, 2). Thus, the excess K+ siphoned from astrocyte endfeet would be deposited on the brain surface, where it would freely diffuse into the cerebrospinal fluid. Potassium would also be siphoned onto the ablumenal wall of brain capillaries. Although the endothelial cells of these capillaries are largely impermeable to K+ (17), active transport by these cells (18) could transfer the K+ into the capillary lumen. The net result of this siphoning process would be that excess K+ generated by neuronal activity would be transferred to the large fluid reservoirs of the cerebrospinal fluid and the blood instead of to other regions of neural tissue.
REFERENCES AND NOTES
- 1.Varon SS, Somjcn GG. Neurosci Res Program Bull. 1979;17(1) [PubMed] [Google Scholar]
- 2.Kuffler SW, Nicholls JG, Martin AR. From Neuron to Brain. 2. Sinauer; Sunderland, MA: 1984. [Google Scholar]
- 3.Newman EA. Nature (London) 1984;309:155. doi: 10.1038/309155a0. [DOI] [PMC free article] [PubMed] [Google Scholar]
- 4.Newman EA. J Neurosci. 1985;5:2225. doi: 10.1523/JNEUROSCI.05-08-02225.1985. [DOI] [PMC free article] [PubMed] [Google Scholar]
- 5.Bracho H, Orkand PM, Orkand RK. J Neurobiol. 1975;6:395. doi: 10.1002/neu.480060405. [DOI] [PubMed] [Google Scholar]
- 6.Maturana HR. J Biophys Biochem Cytol. 1960;7:107. doi: 10.1083/jcb.7.1.107. [DOI] [PMC free article] [PubMed] [Google Scholar]
- 7.Bignami A, Dahl D. J Comp Neural. 1974;153:27. doi: 10.1002/cne.901530104. [DOI] [PubMed] [Google Scholar]
- 8.Bignami A. Brain Res. 1984;300:175. doi: 10.1016/0006-8993(84)91355-6. [DOI] [PubMed] [Google Scholar]
- 9.Walz W, Wuttke W, Hertz L. ibid. 1984;292:367. doi: 10.1016/0006-8993(84)90772-8. [DOI] [PubMed] [Google Scholar]
- 10.The relation between the amplitude of a K+ response and the specific membrane conductance is derived in (4). The relation assumes that equal areas of membrane are exposed to similar [K+]o increases at each ejection site.
- 11.Mori S, Miller WH, Tomita T. Proc Natl Acad Sci USA. 1976;73:1351. doi: 10.1073/pnas.73.4.1351. [DOI] [PMC free article] [PubMed] [Google Scholar]
- 12.Newman EA. J Neurophysiol. 1980;43:1355. doi: 10.1152/jn.1980.43.5.1355. [DOI] [PubMed] [Google Scholar]
- 13.Orkand RK, Nicholls JG, Kuffler SW. ibid. 1966;29:788. doi: 10.1152/jn.1966.29.4.788. [DOI] [PubMed] [Google Scholar]
- 14.Dietzel I, Heinemann U, Hofmeier G, Lux HD. Exp Brain Res. 1980;40:432. doi: 10.1007/BF00236151. [DOI] [PubMed] [Google Scholar]
- 15.Gardner-Medwin AR. J Physiol (London) 1983;335:393. doi: 10.1113/jphysiol.1983.sp014541. [DOI] [PMC free article] [PubMed] [Google Scholar]
- 16.Newman EA, Frambach DA, Odette LL. Science. 1984;225:1174. doi: 10.1126/science.6474173. [DOI] [PMC free article] [PubMed] [Google Scholar]
- 17.Hansen AJ, Lund-Andersen H, Crone C. Acta Physiol Scand. 1977;101:438. doi: 10.1111/j.1748-1716.1977.tb06027.x. [DOI] [PubMed] [Google Scholar]
- 18.Goldstein GW. J Physiol (London) 1979;286:185. doi: 10.1113/jphysiol.1979.sp012613. [DOI] [PMC free article] [PubMed] [Google Scholar]
- 19.Cells were tested for GFAP immunoreactivity by a modification of the method of Bowman et al. [C. L. Bowman, H. K. Kimelberg, M. V. Frangakis, Y. Berwald-Netter, C. Edwards, J. Neurosci. 4, 1527, 1984]. Freshly dissociated cells from the optic nerve were plated on a slide coated with concanavalin A, which promoted cell adhesion (4). The cells were fixed in 4% formaldehyde for 3 minutes, rinsed in phosphate-buffered saline (PBS), postfixed in methanol at − 20°C for 3 minutes, rinsed in PBS, and labeled for 5 minutes with a mouse monoclonal antibody to GFAP at room temperature (Boehringer Mannheim, 814, 369; 50-fold dilution). The cells were then rinsed thoroughly in PBS, labeled for 5 minutes with antibody to mouse immunoglobulin G that had been labeled with fluorescein-isothiocyanate (Boehringer Mannheim, 821, 462; 50-fold dilution), rinsed, and a cover slip applied with a p-phenylenediamine and glycerol mounting medium to retard fading.
- 20.I thank J. I. Gepner and P. H. Hartline for their helpful comments on the manuscript. This work was supported by National Institutes of Health grant EY 04077.