

Abstract
During migration, cells must couple direction sensing to signal transduction and actin remodeling. We previously identified GIV/Girdin as a Gαi3 binding partner. We demonstrate that in mammalian cells Gαi3 controls the functions of GIV during cell migration. We find that Gαi3 preferentially localizes to the leading edge and that cells lacking Gαi3 fail to polarize or migrate. A conformational change induced by association of GIV with Gαi3 promotes Akt-mediated phosphorylation of GIV, resulting in its redistribution to the plasma membrane. Activation of Gαi3 serves as a molecular switch that triggers dissociation of Gβγ and GIV from the Gi3–GIV complex, thereby promoting cell migration by enhancing Akt signaling and actin remodeling. Gαi3–GIV coupling is essential for cell migration during wound healing, macrophage chemotaxis, and tumor cell migration, indicating that the Gαi3–GIV switch serves to link direction sensing from different families of chemotactic receptors to formation of the leading edge during cell migration.
Introduction
Cell migration in response to chemotactic stimuli is a key aspect of many physiological and pathological processes (Van Haastert and Devreotes, 2004). During migration, signals from the exterior are relayed to the cell interior via surface receptors to initiate events necessary for efficient directional motility. The most extensively studied chemotactic receptors in the context of cell migration are the growth factor receptor tyrosine kinases (RTKs) studied in fibroblasts and epithelial cells and G protein–coupled receptors (GPCRs) extensively studied in leukocytes and Dictyostelium discoideum (Van Haastert and Devreotes, 2004). Regardless of which receptor system is involved in sensing chemotactic stimuli, they signal via a conserved pathway that culminates in the activation and enhancement of Akt/PKB through phosphoinositide 3-kinase (PI3K) at the leading edge of migrating cells (Merlot and Firtel, 2003; Van Haastert and Devreotes, 2004). Once the Akt signal is adequately enhanced, cells “polarize” and reposition their Golgi apparatus and microtubule-organizing center (MTOC) in front of the nucleus and form the leading edge (Etienne-Manneville and Hall, 2002; Ridley et al., 2003) oriented toward the direction of the chemotactic stimulus.
GIV (Gα-interacting vesicle-associated protein) was discovered based on its ability to bind Gαi3 (Le-Niculescu et al., 2005). Simultaneous work from other groups proposed distinct roles for GIV in endocytosis (Simpson et al., 2005) and in regulating cell migration via its interaction with Akt, actin, and PI4P (Anai et al., 2005; Enomoto et al., 2005). Of particular interest is the fact that GIV is localized at the crossroads of two major signaling pathways, as it is able to interact with α-subunits of G proteins (Le-Niculescu et al., 2005) and enhance PI3K-Akt activity upon RTK stimulation (Anai et al., 2005). Although RTKs and Gβγ-subunits are known to directly increase PI3K activity and subsequently activate Akt (Stephens et al., 1997), the role of Gα-subunits in this process has remained unclear. We set out to define the role of Gα-subunits and the significance of its interaction with GIV during cell migration and to understand how Gα-subunits and GIV link cell surface receptors to downstream signaling events.
In this paper, we show that Gαi3 regulates GIV's functions during cell migration. We provide mechanistic insights into how activation of the G protein dictates the formation of the leading edge in a chemotaxing cell by coupling direction sensing through cell surface receptors to Akt enhancement and actin remodeling via GIV.
Results
Gαi3 is necessary for cell migration
Both GIV and Gαi3 are localized on Golgi membranes and the plasma membrane (PM; Stow et al., 1991; Denker et al., 1996; Enomoto et al., 2005; Le-Niculescu et al., 2005). We reported previously that GIV is predominantly on vesicles near the Golgi during quiescence (Le-Niculescu et al., 2005), and others reported that during cell migration it accumulates at the leading edge where it interacts with Akt and participates in actin remodeling (Enomoto et al., 2005). Because key participants in cell migration (GIV, PI3K, Akt, and actin; Merlot and Firtel, 2003; Enomoto et al., 2005) are enriched at the leading edge, we asked if Gαi3 behaves similarly. We subjected confluent monolayers of HeLa cells to scratch wounding to induce unidirectional cell migration (Kupfer et al., 1982) and examined the distribution of endogenous Gαi3 by immunofluorescence (IF). In quiescent cells far from the wound, Gαi3 showed a predominant Golgi localization based on colocalization with a Golgi marker, β1-4 galactosyltransferase (β-GALT; Fig. 1 A, a–c), and was almost undetectable at the cell periphery marked by actin (Fig. 1 A, d–f). In contrast, migrating cells at the edge of the wound showed peripheral Gαi3-stained puncta within lamellipodial extensions. Some of these puncta colocalized with actin at the leading edge (Fig. 1 A, g–j). Thus, Gαi3 showed different distributions depending on the migratory state of the cell.
Figure 1.

Gαi3 redistributes to the cell periphery during cell migration and is necessary for cell migration. (A) Distribution of Gαi3 in quiescent (a–f) versus migrating (g–j) HeLa cells after scratch wounding. In quiescent cells, endogenous Gαi3 colocalizes with βGalT in the Golgi (a–c) but not actin (d–f). In migrating cells, Gαi3 is found in puncta that partially colocalize with actin at the leading edge (g–i). Arrows denote direction of migration. Boxed area in i is enlarged in j. HeLa cells were aldehyde fixed 0 (left) and 8 (right) h after scratch wounding, as shown in the diagram, and stained as indicated. Bars,10 μm. (B) Depletion of Gαi3 (g and h) or GIV (e and f), but not Gαs (c and d), impairs wound healing (compare with scrambled siRNA [scr siRNA] controls; a and b). Repletion of hGαi3 by rat Gαi3 (i and j), but not vector alone (k and l), restores this defect. HeLa cells treated as indicated were subjected to scratch wounding and examined immediately after wounding (0 h) or 16 h later (n = 5). (C) Cell lysates from cells treated as in B were immunoblotted to assess the efficiency of siRNA depletion of Gαs (∼90%), GIV (∼85%), or Gαi3 (∼95%) and the expression of rGαi3. Several GIV bands are identified that most likely are different posttranslationally modified forms of GIV because they are specifically depleted using GIV siRNA. (D) Comparative trajectories of Gαi3-depleted cells versus those transfected with Gαi3-YFP were followed by live cell imaging for 8 h after wounding. Representative cells at the advancing edge of the wound (dashed line) were traced using a cell tracker application on videos obtained of transfected (solid squiggles) or untransfected (circles) cells through the YFP channel (b) or a simultaneously recorded DIC channel (a; Video 1, available at http://www.jcb.org/cgi/content/full/jcb.200712066/DC1). (E) Bar graphs showing the distance covered by cells in D analyzed by the cell-tracker application (top graph) and the percent of untransfected Gαi3-depleted cells versus Gαi3-depleted cells transfected with rGαi3-YFP that displayed directional migration (bottom graph). Results are shown as mean ± SEM (n = 3).
Because GIV is a binding partner of the α-subunit of Gi and Gs and is important for cell migration, we asked if Gαi3 or Gαs is necessary for cell migration. We depleted Gαi3 in HeLa cells using siRNA oligos (Fig. 1 C) and measured the rates of wound closure. Depleting Gαi3 (∼95%) delayed wound healing (Fig. 1 B, g and h), whereas controls closed the wound as expected (Fig. 1 B, a and b). This impairment in migration was similar to that observed when GIV was depleted (∼85%; Fig. 1 B, e and f). In contrast, depletion of Gαs (∼90%) had no effect (Fig. 1 B, c and d). Gαi3-depleted cells regained their ability to close the wound when Gαi3 levels were replenished by expression of siRNA-resistant rat (rGαi3wt; Fig. 1 B, i–l).
Live cell imaging revealed that most (∼75%) of the Gαi3-depleted cells displayed random oscillatory movements around a virtually motionless nucleus (Fig. 1, D and E; and Video 1, available at http://www.jcb.org/cgi/content/full/jcb.200712066/DC1), resembling cells expressing a dominant-negative migration-defective GIV mutant (Enomoto et al., 2005). When siRNA-resistant YFP-tagged rGαi3 (rGαi3-YFP) was introduced into Gi3-depleted cells, ∼75% of the transfected cells migrated toward the wound (Fig. 1 E).
Gαi3 preferentially localizes to pseudopods at the leading edge of migrating cells
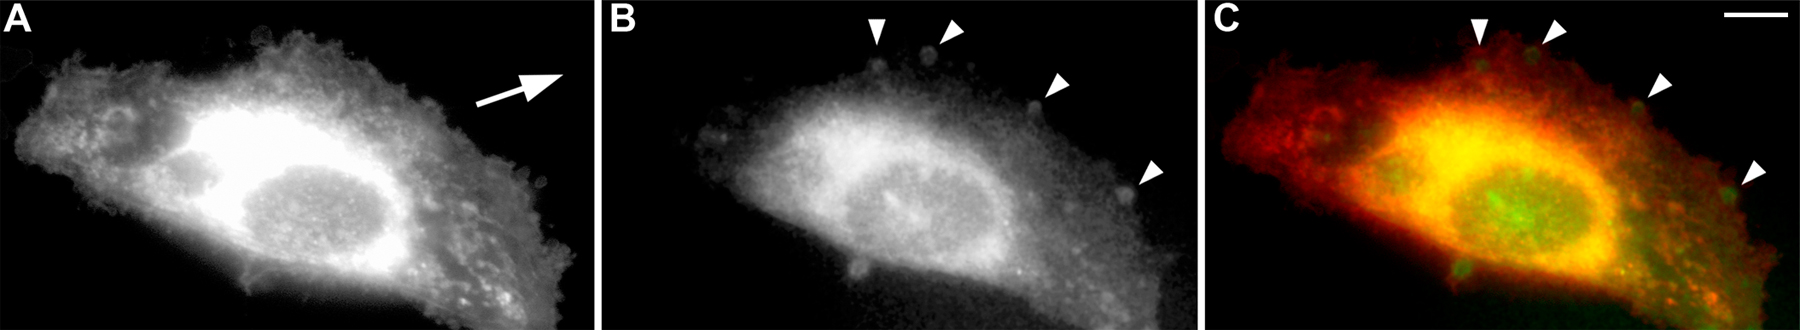
To study the dynamics of Gαi3 localization after wounding, we observed HeLa cells expressing rGαi3-YFP by live cell imaging as they transitioned from quiescence to migration. Previously, we demonstrated that rGαi3-YFP localizes largely to the Golgi and behaves similarly to endogenous Gαi3 (Weiss et al., 2001). During migration, Gαi3-YFP localized preferentially within pseudopods at the leading edge as manifest by the transient “blush” of fluorescent signal within these microdomains (Fig. 2 A and Video 2, available at http://www.jcb.org/cgi/content/full/jcb.200712066/DC1). This blush most likely reflects the transient localization of Gαi3-stained puncta (Fig. 1 A, j) that are not resolved by the optical conditions used for live cell imaging (see Materials and methods). Because Gαi3 is membrane anchored, membrane redundancy at the sites of pseudopod formation could lead to nonspecific accumulation of membrane-anchored proteins (Servant et al., 1999). However, myristoyl-palmitoyl–modified YFP (mp-YFP), which has the same modifications as Gαi3-YFP and was previously characterized as a general membrane marker (Zacharias et al., 2002), showed patchy distribution along the entire PM and other membranous compartments without any preference for the leading edge during polarized migration (Fig. 2 B and Video 3). Accumulation of Gαi3 was also observed within pseudopods at the leading edge using 1,1′-Dioctadecyl-3,3,3′,3′-tetramethyllindodicarbocyanine perchlorate (DiD) as an alternative membrane marker (Fig. S1, available at http://www.jcb.org/cgi/content/full/jcb.200712066/DC1; Servant et al., 1999). We conclude that Gαi3, like its binding partner GIV, is concentrated at the leading edge of a migrating cell.
Figure 2.

Gαi3 localizes preferentially in pseudopods at the leading edge. (A) Time-lapse images of a HeLa cell expressing Gαi3-YFP migrating into a freshly made wound visualized by live cell imaging. Gαi3-YFP is preferentially localized within pseudopods at the leading edge (carats) during polarized migration. Time after wounding is expressed as hours:minutes:seconds. Outline of the cell at the beginning of Video 2 (available at http://www.jcb.org/cgi/content/full/jcb.200712066/DC1) is indicated with a dashed line. (B) Similar images of a HeLa cell expressing mp-YFP. Mp-YFP shows a patchy distribution over most of the PM (arrows) and other membranous compartments with no preferential localization to the leading edge (carats). The dashed line indicates the position of the cell at the beginning of Video 3 (available at http://www.jcb.org/cgi/content/full/jcb.200712066/DC1).
Gαi3 is necessary for centrosome/MTOC repositioning during cell migration
Because Gαi3-depleted cells failed to undergo directional migration, we looked for defects in centrosome reorientation at the wound edge using HeLa cells stably expressing the centrosome marker Centrin1-GFP and quantified as described previously (Fig. 3 B; Kupfer et al., 1982; Etienne-Manneville and Hall, 2001). We observed that although ∼64% of control siRNA-treated cells repositioned the centrosome in front of the nucleus looking toward the wound, only ∼34% of Gαi3-depleted cells (as was expected in the absence of polarization) achieved the same phenotype (Fig. 3 C). GIV or Gαs-depleted cells were similar to controls. When rGαi3wt was introduced into Gαi3-depleted cells, the defect in centrosome repositioning was reversed. Using deconvolution microscopy to visualize the plane of the centrosome, we found that both endogenous Gαi3 (Fig. 3 A, a–f) and endogenous (Fig. 3 A, j–l) or overexpressed GIV (Fig. 3 A, g–i) localized at the centrosome with bona fide centrosomal proteins (pericentrin or γ-tubulin) in HeLa and Cos7 cells. Our finding that both Gαi3 and GIV localize to the centrosome region and only Gαi3 is required for centrosomal repositioning suggests that the latter is a GIV-independent function of Gαi3.
Figure 3.

Gαi3 and GIV localize at the centrosome/MTOC and Gαi3 is necessary for centrosome repositioning. (A) Deconvolved images through the centrosomes demonstrating the localization of Gαi3 and GIV on centrosomes. HeLa and Cos7 cells were permeabilized, fixed, and costained with a centrosome marker (γ-tubulin or pericentrin) and Gαi3 (a–f), GIV (j–l), or overexpressed V5-GIV (g–i). Bar,10 μm. (B) Schematic illustration (bottom) of the centrosome repositioning assay performed on HeLa cells expressing GFP-Centrin1. Cells located at the edge of a wound are scored positive in which the centrosome (GFP-Centrin1, green) and Golgi (Man II, red) are positioned in front of the nucleus (DAPI, blue) within the 120° trident facing the direction of the wound (arrow). The white box indicates the area magnified below. Bar, 10 μm. (C) Bar graph showing the percentage of cells at the wound edge that achieved centrosome repositioning by 8 h after wounding. Gαi3-depleted cells failed to reposition their centrosomes and transfection of Gαi3wt restored this defect. GIV or Gαs-depleted cells were similar to controls (64%). Results (200–400 cells per experiment; n = 3) are shown as mean ± SEM. *, P < 0.001; #, P > 0.001 (compared with scr siRNA cells).
Gαi3 is required for enhancement of Akt signaling
Next, we asked whether Gαi3 regulates GIV's functions in activating Akt and remodeling actin after growth factor stimulation, an approach which mimics scratch wound–induced Akt signaling in a more synchronized fashion (Enomoto et al., 2005). When serum-starved HeLa cells were stimulated with insulin, Akt activity peaked at 5 min and was rapidly down-regulated within 15–30 min in controls (Fig. 4 A). In Gαi3-silenced cells, the peak activation was reduced by ∼60% (Fig. 4, A and B), which is similar to the effect observed after GIV depletion in HeLa (Fig. 4 B) or HepG2 cells (Anai et al., 2005). The effect was Gαi specific because Gαs depletion did not significantly affect Akt activation (Fig. 4 A) and was reversed when rGαi3wt was restored in Gαi3 siRNA-treated cells (see Fig. 5 B). Therefore, Gαi3 links Akt activation and cell migration in a manner similar to that reported for GIV (Anai et al., 2005). To distinguish whether Gαi3 and GIV function in a common pathway or in independent parallel pathways mediating enhancement of Akt signaling, we investigated the effect of silencing both proteins. Silencing of Gαi3 or GIV alone reduced Akt activation by ∼60 and 80%, respectively (Fig. 4 B). When both were silenced (Fig. 4 B), no significant difference was observed from GIV-depleted cells, indicating that the effect on Akt was not additive. The fact that depletion of Gαi3 promoted weaker inhibition of Akt than GIV suggests that other Gi3-independent pathways might exist in which GIV is a common effector. Akt activation was also impaired when Gαi3-depleted HeLa cells were stimulated with EGF (Fig. S2, available at http://www.jcb.org/cgi/content/full/jcb.200712066/DC1), which implicates Gαi3 and GIV in a common pathway mediating Akt activation upon RTK stimulation.
Figure 4.

Gαi3 cooperates with GIV in Akt activation and actin remodeling and regulates the distribution of GIV. (A) Depletion of Gαi3 but not Gαs inhibits insulin-stimulated Akt activation. HeLa cells treated as indicated were serum starved for 6 h and stimulated with 100 nM insulin. (Top) Lysates were separated by SDS-PAGE and immunoblotted for total (tAkt), phospho-Akt (pAkt), Gαi3, Gαs, and actin. (Bottom) Bar graph showing ratio of pAkt to tAkt in scr RNA controls versus cells depleted of Gαi3 or Gαs. (B) Simultaneous depletion of Gαi3 and GIV does not have an additive effect on Akt signaling. (Top) HeLa cells treated as in A were immunoblotted for tAkt and pAkt 5 min after insulin stimulation. (Bottom) Bar graph showing Akt activity in cells treated as in top expressed as percentage of the response in controls. Results are shown as mean ± SEM (n = 3). P values compared with scr-siRNA are indicated. (C) Depletion of Gαi3 alters actin organization. Cells treated with scr siRNA (a) show stress fibers whereas Gαi3-depleted cells (b) are unable to form stress fibers and show a prominent bed of cortical actin. The effects on actin in Gαi3-depleted cells are reversed by transfecting rGαi3wt-YFP (d) but not vector alone (c). HeLa cells treated as indicated were stained with Phalloidin (red) and DAPI (blue). *, cells expressing rGαi3-YFP visualized with anti-GFP. Bar, 10 μm. (D) Distribution of GIV is less scattered and more concentrated in the Golgi (arrowheads) upon silencing Gαi3 (compare a and b). The scattered distribution is restored upon transfecting rGαi3-YFP (c–e). HeLa cells were treated as indicated and stained for GIV (red), GFP (green), and DAPI (blue). *, cell expressing rGαi3-YFP visualized with anti-GFP mAb. Bar, 10 μm.
Figure 5.

Activation status of Gαi3 determines its role in cell migration. (A) Cell migratory behavior is restored by wild-type (a and b) and active (Q204L; c and d), but not the inactive (G203A; e and f), Gαi3 mutant. (Top) HeLa cells expressing rGαi3wt, active, or inactive mutants were subjected to scratch wounding. (Bottom) Equal overexpression of Gαi3 constructs was confirmed by immunoblotting. In assays in which siRNA was followed by plasmid overexpression, the efficiency of transfection (∼45–55%) was similar for wt, active, or inactive Gαi3 constructs by IF (n = 3). (B) Insulin-stimulated Akt activation is restored by wt and active (Q204L) but not the inactive (G203A) Gαi3 mutant. (Top) Assays were performed as in Fig. 4 (A and B) and samples were immunoblotted for tAkt and pAkt 5 min after stimulation. (Bottom) Bar graph showing percentage of Akt activation in cells treated as in top. Results are shown as mean ± SEM (n = 3). (C) Transfection of active (Q204L; a–c), but not inactive (G203A; d–f), mutant rGαi3-YFP restores normal actin organization (Phalloidin, red) in Gαi3-depleted cells. *, cell expressing rGαi3-YFP visualized with anti-GFP (green). Bar, 10 μm. (D) Transfection of active (Q204L; a–c), but not inactive (G203A; d–f), rGαi3-YFP restores the normal (Fig. 4D, a) scattered peripheral and Golgi-associated (arrowheads) punctate distribution of GIV (red). *, cell expressing rGαi3-YFP visualized with anti-GFP (green). Bar, 10 μm.
Gαi3 is necessary for remodeling of the actin cytoskeleton
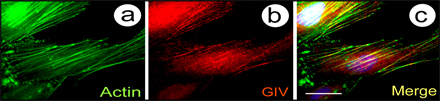
Because PI3K-Akt signaling is associated with actin remodeling during cell migration, we next examined the organization of the actin cytoskeleton in the migration-deficient Gαi3-depleted cells. Phalloidin staining for F-actin (filamentous actin) revealed major differences in actin organization of Gαi3-depleted cells versus that of controls (Fig. 4 C, a and b): the Gαi3-depleted cells were virtually unable to form long stress fibers and displayed a prominent bed of cortical actin but recovered their ability to form stress fibers when transfected with rGαi3wt-YFP (Fig. 4 C, c and d). We also investigated actin morphology in Gαi3-depleted cells treated with insulin which induces actin remodeling (Ridley et al., 1992) and found that actin remodeling and generation of stress fibers failed to occur upon insulin stimulation (Fig. S3, available at http://www.jcb.org/cgi/content/full/jcb.200712066/DC1). Similar results were obtained in GIV-depleted cells using EGF as a ligand (Enomoto et al., 2005). We conclude that Gαi3 plays a major role in the organization of the actin cytoskeleton, most likely via its interaction with GIV, an established actin binding protein.
The distribution of GIV is altered in the absence of Gαi3
We next investigated if silencing Gαi3 leads to changes in the distribution of GIV. In quiescent cells treated with scr siRNA, we detected GIV on vesicles in and around the Golgi and scattered throughout the cytoplasm (Fig. 4 D, a). Occasionally, GIV also colocalized with actin stress fibers (Fig. S4, available at http://www.jcb.org/cgi/content/full/jcb.200712066/DC1) as reported by Enomoto et al. (2005) in fibroblasts; however, this was an infrequent and inconsistent finding in epithelial cells. We believe that this discrepancy in staining pattern is likely caused by the fact that epithelial cells express lower levels of GIV than mesenchymal cells. Depletion of Gαi3 resulted in a more compact concentration of GIV staining in the Golgi region and reduced peripheral staining (Fig. 4 D, b). This phenotype was reversed when Gαi3-depleted cells were replenished with rGαi3-YFP (Fig. 4 D, c–e). We conclude that Gαi3 is necessary for redistribution of GIV from the Golgi to more peripheral locations.
Activation of Gαi3 is required for Akt enhancement and actin remodeling
Because heterotrimeric G protein signaling is regulated by the activation state of the α-subunit, we asked whether activation of Gαi3 is required for its functions during cell migration. We transfected rGαi3Q204L and rGαi3G203A mutants, which behave like the GTP- and GDP-bound forms of Gαi3, respectively (Hermouet et al., 1991; Coleman et al., 1994), into Gαi3 depleted cells and assessed their ability to reverse the effects of Gαi3 depletion. Transfection of either Gαi3wt or the active rGαi3Q204L mutant restored cell migration (Fig. 5 A), Akt activation in response to insulin (Fig. 5 B), formation of stress fibers (Fig. 5 C), and distribution of GIV (Fig. 5 D). Transfection of the inactive mutant rGαi3G203A had no effect on these parameters (Fig. 5, A–D).
Next, we asked whether the interaction between Gαi3 and GIV is activity dependent and found that the inactive GST-Gαi3G203A mutant consistently bound ∼10–15-fold more GIV than the active Gαi3Q204L mutant in in vitro binding assays using HeLa cell lysates or TnT (in vitro–translated) GIV (Fig. 6 A). We confirmed these results by preloading GST-Gαi3 with GDP alone or in the presence of AlF4−, which mimics the active state (Coleman et al., 1994). In the presence of GDP alone, GST-Gαi3 bound ∼10–30% of the total GIV, and addition of AlF4− virtually abolished the binding (Fig. 6 B). In contrast, GST-Gαs bound ∼100–300-fold less than GST-Gαi3 (Fig. 6 C), which is consistent with our finding that Gαs-depletion had no influence on cell migration (Fig. 1 B), Akt activation (Fig. 4 A), or actin stress fiber formation (not depicted). These results demonstrate that GIV binding is specific for Gαi3 and is greatly reduced upon activation of the G protein. Because inactive GDP-bound Gαi3 interacts with both Gβγ and GIV, we asked whether the α-subunit can interact with GIV when it is assembled into an intact heterotrimer. That this is the case is suggested by the fact that the Gβ subunit could be coimmunoprecipitated from brain lysates with GIV antibodies and that this interaction was abolished in the presence of GDP and AlF4− (Fig. 6 D).
Figure 6.

Activation status of Gαi3 regulates its interaction with GIV. (A and B) GIV binds preferentially to the inactive (Gai3G203A) form of Gai3. (A, Top) In vitro binding assays were performed using GST-Gαi3 (wt or mutants) and either HeLa cell lysates (GIV (HeLa)) or in vitro–translated GIV (GIV (TnT)). Bead-bound fractions were separated by SDS-PAGE. Bound GIV was analyzed either by immunoblotting or autoradiography (TnT). (B, Top) In vitro binding assay performed as in A with GST-Gαi3wt after GDP loading in the absence or presence of AlF4−. (A and B, Bottom) Ponceau S-staining of PVDF membranes to show equal loading of GST proteins. (C) GIV preferentially binds to Gαi3. In vitro binding assays were performed as in Bwith GST-Gαi3 wt or Gαs in the presence of GDP ± AlF4− loading to compare the relative binding of Gαs and Gαi3 to GIV. Gβ-subunits were used as a positive control. Bound GIV from HeLa cell lysates was visualized by immunoblotting (GIV (Low exp), low exposure; GIV (High exp), high exposure) and autoradiography (TnT), respectively. (D) GIV interacts with the inactive Gαβγ heterotrimer in vivo. GIV was immunoprecipitated from rat brain lysate in the absence (lanes 1–3) or presence (lanes 4–6) of GDP + AlF4−, and immune complexes were probed for GIV and Gβ subunits using anti–pan Gβ.
Because the active, but not the inactive, Gαi3 mutant reversed the migration-defective phenotype of Gαi3-depleted cells, activation of the G protein seems to be the key event leading to Akt enhancement during cell migration. However, in vitro binding studies showed that GIV preferentially binds to the inactive G protein. Collectively, these observations support a working model whereby in vivo, the functional interaction between the G protein and GIV needs to be reversible as the G protein cycles between active and inactive states.
Gαi3 promotes phosphorylation of GIV by Akt at S1416
In addition to being an enhancer of Akt activity, GIV is a substrate for Akt at S1416, and this phosphorylation is critical for the function of GIV in cell migration (Enomoto et al., 2005). Interestingly, S1416 lies within the G binding domain of GIV (Le-Niculescu et al., 2005), raising the question of whether the Gαi3–GIV interaction modulates ser/thr phosphorylation of GIV. We found that in Gαi3-depleted cells GIV was poorly phosphorylated compared with controls (Fig. 7 A). Repletion of Gαi3 with rGαi3wt restored phosphorylation of GIV to control levels (Fig. 7 A). To determine if the Gαi3–GIV interaction enhanced or interfered with Akt mediated phosphorylation of GIV on S1416, we performed in vitro phosphorylation reactions with immunopurified GIV, GST-Gαi3, and recombinant Akt. Because Akt phosphorylates immunopurified GIV at a single site, i.e., S1416 (Enomoto et al., 2005), p-ser/thr antibody was used to estimate the amount of phosphorylation that occurred. We found that preincubation of GIV with GST-Gαi3G203A, the inactive mutant that binds GIV most avidly, increased the phosphorylation of GIV ∼2.5 fold (Fig. 7 B, lane 6), whereas GST-Gαi3Q204L and GST-Gαi3wt were not significantly different (Fig. 7 B, lanes 4 and 5). We conclude that binding of Gαi3 to GIV promotes phosphorylation of GIV at S1416 by Akt. We reasoned that this is likely via a change in the conformation of GIV that might facilitate access of Akt to S1416. To investigate whether such a change in confirmation takes place, we performed limited proteolysis using increasing amounts of trypsin on immunopurified GIV (Fig. 7 C). GIV preincubated with GST, GST-Gαi3wt, or GST-Gαi3Q204L was relatively resistant to proteolysis, whereas GIV preincubated with Gαi3G203A was more susceptible to proteolysis, indicating a change in the conformation of GIV upon binding the inactive mutant.
Figure 7.

Gαi3 is necessary for phosphorylation of GIV by Akt. (A) Phosphorylation of GIV is decreased upon depletion of Gαi3 (Gαi3 siRNA) and restored upon transfecting rGαi3 (Gαi3 siRNA and rGαi3). GIV was immunoprecipitated from HeLa cells treated as indicated and phosphorylation determined by immunoblotting with anti-pSer/Thr IgG. (B, top) Gαi3 binding to GIV promotes phosphorylation of GIV at S1416 by Akt. Immunoprecipitated GIV was preincubated in the presence or absence of ∼5 μg GST (lane 3), GST-Gαi3wt (lane 4), Gαi3 Q204L (lane 5), or Gαi3 G203A (lane 6) and subsequently phosphorylated in vitro with recombinant Akt1, followed by SDS-PAGE. Phosphorylation was determined by immunoblotting with anti-pSer IgG. (B, bottom) Equal loading of preimmune or anti-GIV IgG and GST proteins was confirmed by Ponceau S staining. (C) Gαi3 binding to GIV increases its susceptibility to trypsin-mediated proteolysis. Immunoprecipitated GIV was incubated in the presence or absence of GST-Gαi3 proteins as in B and digested with increasing concentrations of trypsin at 37°C for 8 min. The amount of uncleaved (trypsin resistant) GIV was determined by immunoblotting (inset) and displayed as percentage of starting amount (y axis) plotted against trypsin concentration (x axis). (D) GST-Gαi3 interacts similarly with in vitro–translated GIV wild-type and phosphorylation mimic (S1416D) or nonphosphorylatable (S1416A) GIV mutants. Semiquantitative densitometry revealed that 14 ± 2, 13 ± 1, and 14 ± 3% of wild-type, S1416A, and S1416D, respectively, bound to GST-Gαi3 (n = 5). (E) Schematic representation of how binding of Gαi3 to GIV may mediate phosphorylation of GIV by bringing the C-terminal Akt binding site closer to the Akt phosphorylation site.
We also asked whether phosphorylation of GIV at S1416 affects its binding to Gαi3 and found that this is not the case as wild-type, phosphorylation mimic (S1416D), or nonphosphorylatable (S1416A) GIV all bound preferentially to the inactive G protein with similar strength (Fig. 7 D and Fig. S5, available at http://www.jcb.org/cgi/content/full/jcb.200712066/DC1). This indicates that the activation state of the G protein, and not phosphorylation of GIV at S1416, regulates the Gαi3–GIV interaction.
These results show that the Gαi3–GIV interaction facilitates phosphorylation of GIV by Akt. We propose that GIV bound to Gαi3 adopts a conformation that brings Akt (bound to its C terminus) closer to S1416 in the G binding domain and thus facilitates its phosphorylation (Fig. 7 E).
Gαi3 and GIV are necessary for macrophage chemotaxis and cancer tumor cell migration
We also investigated the roles of Gαi3 and GIV in other biological processes that require Akt enhancement during cell migration, i.e., macrophage chemotaxis and cancer cell migration. Previous studies have established that Gi and GPCRs are important for Akt activation during chemotaxis in macrophages and neutrophils (Thelen, 2001) and that cancer cell lines, like HeLa, use RTKs for Akt activation during migration in scratch wound assays (Tetreault et al., 2008). To find out how the Gαi3–GIV regulatory complex behaves during cell migration in macrophages, we analyzed THP1 human monocytes before and after tetradecanoyl-phorbol acetate (TPA)–induced differentiation (Collins, 1987) into macrophages. GIV expression increased ∼18-fold at 48 h after TPA induction compared with undifferentiated monocytes, whereas levels of Gαi3 remained unchanged (Fig. 8 A). We then asked if depletion of GIV would impair macrophage chemotaxis induced by activation the Gi-coupled fMLP receptor (Allen et al., 1988). Macrophages were monitored in real time during the rapid phase (0–25 min) of chemotaxis toward a pipette tip continuously releasing fMLP (Fig. 8 B, top; Chen et al., 2006). We found that depletion of either Gαi3 (Fig. 8 B, a–d) or GIV (Fig. 8 B, e and f) inhibited chemotaxis and impaired Akt activation (Fig. 8 C). We conclude that Gαi3 and GIV are essential for Akt signaling during GPCR-stimulated macrophage chemotaxis.
Figure 8.

The Gαi3–GIV signaling complex is necessary for macrophage chemotaxis and tumor cell migration. (A) GIV, but not Gαi3, expression is induced ∼18-fold upon differentiation of monocytes into macrophages. THP1 monocytes were treated with 5 nM TPA or DMSO carrier, and the expression of Gαi3 and GIV was followed by immunoblotting over 68 h. (B) Depletion of Gαi3 or GIV impairs macrophage chemotaxis. (Top) Schematic illustration of the chemotaxis assay in which macrophages migrate toward a pipette tip, continuously releasing fMLP to maintain a gradient. The dashed line denotes the edge of the monolayer just before the application of the chemotactic gradient. (Bottom) THP1-derived macrophages treated with scr (a and b), Gαi3 (c and d), or GIV (e and f) siRNA were imaged at the end of a fMLP chemotaxis assay. Arrow denotes direction of chemotaxis. Bars: (a, c, and e) 250 μm; (b, d, and f) 50 μm. (C) Immunoblotting performed on lysates harvested at the end of the chemotaxis assay (shown in B) demonstrating that depletion of Gαi3 or GIV impairs Akt activation (pAkt) in THP1-derived macrophages. (D) GIV is expressed in colon cancer cell lines with high (HCT-116, DLD1) but not low (HT-29p, LS-174T) in vivo metastatic potential. Gαi3 and GAIP (used as a control) expression are similar in all cell lines. (E) Depletion of Gαi3 or GIV impairs wound healing in highly metastatic colon cancer cells. DLD1 cells treated with scr (a and b), Gαi3 (c and d), or GIV (e and f) siRNA were monitored at 0 and 36 h after scratch-wounding. Bars, 1 mm. (F) Depletion of Gαi3 (left) or GIV (right) impairs Akt activation (pAkt) in highly metastatic DLD1 colon cancer cells. Immunoblots were performed on lysates harvested at the end of a wounding assay.
We also investigated the expression pattern of Gαi3 and GIV in cell lines derived from colon adenocarcinoma with variable in vivo metastatic potential. GIV was expressed exclusively in cells with high metastatic potential (HCT116 and DLD1) and was virtually undetectable in those with poor metastatic potential (HT29p and Ls174T; Fig. 8 D), whereas Gαi3 and other regulatory proteins of the G protein pathway, i.e., GAIP (Fig. 8 D), showed no such correlation. As in HeLa cells and macrophages, when highly metastatic DLD1 cells were treated with Gαi3 or GIV siRNA, they demonstrated inefficient migration in scratch wounding assays (Fig. 8 E) and impaired Akt activation (Fig. 8 F) compared with scr siRNA–treated cells. Because cell motility in scratch wound assays and Akt activity are validated predictors of the metastatic potential of tumor cells (Raz, 1988; Qiao et al., 2007), DLD1 cells depleted of Gαi3 or GIV might be expected to have poor metastatic potential compared with the parent cell line. Collectively, these results suggest a broader role for the Gαi3–GIV complex in migratory processes where direction sensing through different chemotactic receptors uses this complex for Akt enhancement, actin remodeling, and cell migration.
Discussion
Summary and working model
This paper describes a novel mechanism by which Gαi3 serves as a molecular switch that dictates the formation of the leading edge during cell migration via regulation of the distribution, phosphorylation, and functions of GIV. Without Gαi3, Akt amplification downstream of both RTK and GPCR failed to occur, actin remodeling was inhibited, and cells failed to undergo polarized migration after scratch wounding. We also showed that Gαi3 localizes preferentially within pseudopods at the leading edge and that activation of Gαi3 is essential for migration. Collectively, these results support a working model (Fig. 9) of how the switch operates in few key steps: inactive Gi3 heterotrimer interacts avidly with GIV and induces a change in the conformation of GIV. Upon a chemotactic stimulus (when Akt signaling is initiated) the Gαi3-bound conformation of GIV facilitates phosphorylation of GIV at a critical Ser residue that is necessary for its functions at the leading edge. Subsequently, activation of Gαi3 triggers dissociation of the Gi3-GIV macromolecular complex releasing Gβγ-subunits and GIV simultaneously. Released Gβγ participates in localized PI3K-Akt activation (Lilly and Devreotes, 1995), and released GIV amplifies and propagates this Akt signaling (Chen et al., 2003; Postma et al., 2004). Amplification of cellular Akt activity via sequential coupling and uncoupling of Gαi3 and GIV is likely to set up a positive feedback loop that mediates phosphorylation of further GIV molecules to remodel actin and form the leading edge. In this feedback loop, G proteins are presumably directly activated by GPCRs or indirectly transactivated via RTKs.
Figure 9.

Working model. (1) GIV preferentially and avidly binds to inactive GDP-bound Gαi3. Interaction with Gαi3 induces a change in conformation of GIV (dotted arrow). In a quiescent cell, this step is likely to occur predominantly on vesicles near the Golgi where Gαi3 and GIV were previously shown to colocalize. (2) Upon a chemotactic stimulus, Akt signaling is initiated and results in phosphorylation of GIV at S1416. This critical phosphorylation step is facilitated by the favorable conformation of GIV induced by direct interaction with Gαi3. Phosphorylation at S1416 was previously shown to be necessary for GIV's functions during cell migration (Enomoto et al., 2005). (3) Upon phosphorylation, GIV continues to preferentially and avidly bind to Gαi3; however, it selectively loses its affinity for PI4P (Enomoto et al., 2005), a phosphoinositide that is enriched in the Golgi, and redistributes from Golgi membranes to the peripheral actin bed near the PM. (4) Activation of Gαi3 occurs, likely downstream of ligand occupied receptors, and is the key event that mediates simultaneous dissociation of Gβγ and GIV from the Gi3–GIV complexes. (5) Released Gβγ activates PI3K-dependent Akt signaling (Lilly and Devreotes, 1995). (6) Released phospho-GIV enhances the initial Akt signaling (Anai et al., 2005), remodels actin, and promotes migration. (7) This second phase of Akt signal enhancement is critical for formation of the leading edge during polarized cell migration. Cyclical activation and inactivation of Gαi in vivo thus contributes to progressive Akt enhancement, which promotes further cycles of GIV phosphorylation (8 and 2), redistribution of phosphorylated GIV from Golgi to PM/actin (3), and subsequent release from the Gi3–GIV complexes upon activation of Gαi3 (4). This contributes to the previously observed accumulation of phosphorylated GIV at the leading edge (Enomoto et al., 2005) where GIV rapidly remodels actin to generate pseudopods.
Gαi3 and GIV directly interact with each other and share dual localizations on the Golgi and the PM (Enomoto et al., 2005; Le-Niculescu et al., 2005). Our results provide clues as to where in the cell this sequential Gαi3–GIV molecular coupling might occur. In quiescent cells, Gαi3 was predominantly found on the Golgi where it partially colocalizes with GIV (Fig. 1 A), and in migrating cells, Gαi3 redistributes to the cell periphery and is concentrated in pseudopods at the leading edge (Figs. 1 A and 2 A) where phosphorylated GIV accumulates during migration (Enomoto et al., 2005). Additionally, we showed that depletion of Gαi3 leads to accumulation of GIV on Golgi membranes and impairs phosphorylation of GIV at S1416. Previously, phosphorylation of GIV at S1416 by Akt has been demonstrated to specifically result in abolishing GIV's affinity toward PI4P (Enomoto et al., 2005), a lipid known to be enriched in Golgi membranes. Based on these findings, we postulate that GIV phosphorylation at S1416, which is facilitated by the Gαi3–GIV interaction, mediates the redistribution of GIV from the Golgi to the cell periphery. Mobilization of this internal pool of Gαi3-bound GIV to the cell periphery sets the stage for G protein activation and subsequent release of phosphorylated GIV.
Gαi3, a state-dependent molecular switch for cell migration
Because the active Q204L, but not the inactive G203A, Gαi3 mutant reversed the phenotype of Gαi3-depleted cells, activation of the G protein emerges as the key event in its functioning as a molecular switch. In the absence of Gαi3 or after expression of inactive Gαi3, Akt signaling does not occur (Figs. 4 A and 5 B), indicating that the most significant and direct downstream consequence of Gαi3 activation is Akt enhancement. As a consequence of this failure to enhance Akt signaling, phosphorylation of GIV on S1416, redistribution of GIV to the cell periphery, actin remodeling, and cell migration failed to occur (Figs. 4 and 5). Because activation of Gαi3 was necessary for migration, it came as a surprise that in in vitro binding assays the inactive G protein binds GIV ∼10–15-fold more than the active mutant. Collectively, our results suggest that the weaker interaction between the active Gαi3 mutant and GIV is sufficient to facilitate targeting, phosphorylation, and the functions of GIV in vivo. Conversely, our finding that a strong interaction between the inactive G protein and GIV has an overall inhibitory effect on GIV's functions indicates that reversible coupling is essential for normal functioning of the switch. We conclude that the Gαi3-GIV association constitutes an “on” and “off” switch that is regulated by cyclical G protein activation and is essential for phosphorylation, targeting, and subsequent release of GIV during cell migration.
Gαi3 regulates phosphorylation of GIV
We show here that the Gαi3–GIV association is required for phosphorylation of GIV at S1416 by Akt. Phosphorylation of GIV at this site was previously demonstrated to play a critical role in cell migration, but the mechanism was unclear (Enomoto et al., 2005). We provide evidence that GIV undergoes a change in conformation when bound to Gαi3. It is noteworthy that the Akt binding site on GIV (extreme C terminus) is separated from S1416 (which lies within the G binding domain) by ∼300 aa (Anai et al., 2005). We speculate that a major molecular rearrangement occurs when GIV binds Gαi3 to bring Akt bound to the carboxyl terminus closer to S1416 in the G binding domain and, thus, facilitates its phosphorylation. We also show that activation of Gαi3 rather than phosphorylation of GIV is the key trigger for dissociation of GIV from the Gαi–GIV complex.
In the context of when these events take place, our results provide evidence that the cycling of G protein between active and inactive states ensures that phosphorylation of Gαi3-bound GIV precedes its subsequent release from the complex. In a highly polarized chemotaxing cell, this is likely to occur on the PM at the leading edge where there is a concentration of ligand-occupied receptors, activated Akt, and activated Gαi3 (Ridley et al., 2003; Van Haastert and Devreotes, 2004). Thus, the G protein molecular switch contributes to the spatial bias in accumulation of phosphorylated GIV that was previously demonstrated to occur selectively at the leading edge (Enomoto et al., 2005).
Gαi3 dictates formation of the leading edge by simultaneous release of Gβγ and phosphorylated GIV
We found that Gαi3 through its interaction with GIV is required for Akt enhancement and actin remodeling during scratch wound–induced migration in epithelial cells and for rapid chemotaxis in macrophages. However, in D. discoideum the Gα-subunit is dispensable and only Gβγ-subunits are required for PI3K-Akt activation at the leading edge during GPCR-stimulated migration (Lilly and Devreotes, 1995; Brzostowski et al., 2004). It is noteworthy that there is only one Gβγ subunit in D. discoideum (Lilly and Devreotes, 1995) and, to the best of our knowledge, there is no homologue of GIV. Thus, the differences between HeLa cells and D. discoideum may represent an acquired function of Gαi in mammals, as the number of G proteins and their interacting partners expanded during evolution.
We found that during cell migration, Gαi3 preferentially localizes to the leading edge where enhancement of Akt signaling occurs (Merlot and Firtel, 2003). It is well established that to form a leading edge and migrate, cells must display biphasic Akt activation in response to a chemotactic stimulus in that a brief early phase of generalized Akt activation is followed by an enhanced and prolonged phase. The second phase of enhancement creates a steep PI3K-Akt signaling gradient that is restricted to the stretch of PM destined to form the leading edge (Chen et al., 2003; Postma et al., 2004). However, the uniformity of distribution of chemotactic receptors (RTKs and GPCRs; Servant et al., 1999; Bailly et al., 2000) and shallow anterior–posterior gradient of Gβ subunits (Jin et al., 2000) fails to account for this steep signaling gradient (Xiao et al., 1997; Janetopoulos et al., 2001; Ueda et al., 2001). Our observation of preferential accumulation of Gαi3 together with the localization of phospho-GIV at the leading edge (Enomoto et al., 2005) sets the stage for sequential signal amplification by placing the Gα-subunit in the immediate vicinity of the ligand-occupied receptors that can activate G proteins. Activation of Gαi3 accounts for a major part of Akt signaling (∼60% of the peak Akt activity upon insulin/EGF stimulation) via regulation of GIV, indicating that although Gβγ-subunits initiate Akt signaling through activation of PI3K (Lilly and Devreotes, 1995), accumulation of simultaneously released phosphorylated GIV is essential for localized enhancement of Akt at the leading edge via the PI3K–Akt pathway (Xiao et al., 1997; Anai et al., 2005; Enomoto et al., 2005). Thus, our work provides mechanistic insights into how activation of Gαi3 links direction sensing to GIV-mediated PI3K–Akt enhancement and actin remodeling at the leading edge.
Gαi3 is required for centrosome repositioning during migration
We found that both Gαi3 and GIV are localized on centrosomes and are necessary for polarized migration, whereas Gαi3, but not GIV, is required for repositioning the MTOC/centrosome. In contrast, GIV is required for polarized migration but is not essential for centrosome repositioning. This is in keeping with the fact that asymmetrical extension of lamellipodia and centrosome repositioning are not necessarily coupled during polarized migration of epithelial cells (Euteneuer and Schliwa, 1992). Our results suggest a distinct hierarchy within the Gαi3–GIV regulatory complex, in which Gαi3 regulates additional steps during cell migration besides those performed by GIV. The role of centrosomal GIV could be to nucleate microtubule tracks to the leading edge because, like other members of the Hook family, GIV can bind to microtubules (Simpson et al., 2005).
Direction sensing via different chemotactic receptors converge upon Gαi3 and GIV
GIV has been implicated in RTK-stimulated migration (Enomoto et al., 2005), and Gi is well known to be important for GPCR-stimulated chemotaxis (Thelen, 2001). Our results now demonstrate that activation of Gαi3 is required during scratch wound–induced migration where cross talk between GPCRs and RTKs are known to mediate chemotactic movements (Shan et al., 2006; Yin et al., 2007). Similarly, we have shown that upon direct stimulation with RTK ligands (insulin and EGF), activation of Gαi3 is required to elicit a full response in terms of Akt activation, suggesting that prominent transactivation of G proteins takes place. Additionally, we provide evidence supporting the necessity for GIV during GPCR-stimulated Akt signaling or chemotaxis. Although indirect stimulation of some RTKs by GPCR–G protein–dependent intermediates is well established (Luttrell et al., 1999), there is little mechanistic insight into how RTK stimulation might directly signal via G proteins to activate Akt (Waters et al., 2004; Dhanasekaran, 2006). In this paper, we show that in epithelial cells during wound healing, chemotaxing macrophages, and tumor cells, the state-dependent interaction between Gαi3 and GIV is essential, and upon depletion of either of these proteins the critical step of amplification of Akt signaling is abrogated.
We conclude that regardless of how the chemotactic signal is propagated from the cell surface to initiate Akt signaling, the common theme is the requirement of Gαi3 activation and GIV to promote cell migration. Although we cannot rule out that different biochemical events may occur depending on whether GPCRs or RTKs are activated, it is tempting to speculate that molecular coupling between Gαi3 and GIV could serve as a novel platform for receptor cross talk and that together they could be the long-sought missing link between chemotactic receptors and signal amplification.
Materials and methods
Reagents and antibodies
Unless otherwise indicated, all reagents were of analytical grade and obtained from Sigma-Aldrich, and cell culture media were purchased from Invitrogen. Antibodies against the coiled-coil region of GIV were raised in rabbits and purified as previously described (Le-Niculescu et al., 2005). Antibodies against Gαs and Gαi3 were obtained from EMD, and pan Gβ (M-14) and Gαi3 used for immunoblotting were purchased from Santa Cruz Biotechnology, Inc. Rabbit IgG against phospho-Akt (serine 473) was purchased from Cell Signaling Technology, and mAb against total Akt was purchased from BD Biosciences. MAbs against actin, γ-tubulin, and rabbit IgG against phosphoserine were purchased from Sigma-Aldrich. Anti–mouse and anti–rabbit Alexa 594– and Alexa 488–coupled goat secondary antibodies for IF, phalloidin-Texas Red, and anti-V5 were purchased from Invitrogen. Rabbit antiserum against mannosidase II (ManII) was prepared as described previously (Velasco et al., 1993). Goat anti–rabbit and goat anti–mouse Alexa Fluor 680 or IRDye 800 F(ab′)2 were obtained from LI-COR Biosciences, and DiD was obtained from Invitrogen. The autoimmune human serum against pericentrin (5051) and mAb against βGALT were gifts from S.J. Doxsey (University of Massachusetts, Worcester, MA) and E.G. Berger (University of Zurich, Zurich, Switzerland), respectively.
Plasmids, mutagenesis, and protein expression
Full-length GIV cloned into a pcDNA 3.1 vector was provided by M. Takahashi (Enomoto et al., 2005). GIV S1416A and S1416D mutants were generated according to the manufacturer's instructions (QuickChange II; Stratagene) and confirmed by sequencing. Primer sequences are available upon request. Wild-type rat Gαi3 cDNA, Gαi3 (Q204L), and Gαi3 (G203A) mutants, obtained from A. Spiegel (National Institutes of Health, Bethesda, MD), were subcloned into pcDNA 3.1 (Invitrogen) or pGEX-4T-1 (GE Healthcare) vectors. Cloning of Gαi3 tagged with YFP at the C terminus was described previously (Weiss et al., 2001). The plasmid encoding the mpYFP was a gift from R. Tsien (University of California, San Diego, La Jolla, CA). cDNA encoding the human Gαs long (L) and short (S) splicing variants were obtained from Guthrie cDNA Resource Center(Zheng et al., 2004) and were subcloned into pGEX-KG vector.
Plasmids encoding GST-Gαi3 wild type and mutants (Q204L or G203A) or GST-Gαs fusion proteins were used to express these proteins in Escherichia coli strain BL21(DE3) (Invitrogen), and protein expression was induced overnight at 25°C by IPTG. Pelleted bacteria from 1 liter of culture were resuspended in 10 ml of lysis buffer (Buffer A), sonicated four times for 20 s with 1 min between cycles, and centrifuged at 12,000 g at 4°C for 20 min to remove insoluble material. Solubilized proteins were affinity purified using glutathione Sepharose 4B beads (GE Healthcare). Proteins were eluted, dialyzed overnight against PBS, and stored at −80°C.
Cell culture, transfection, and lysis
Cos7, HeLa, and HeLa-C1 cells expressing Centrin1-GFP (Piel et al., 2000) were grown at 37°C in DME supplemented with 10% FBS, 100 U/ml penicillin, 100 μg/ml streptomycin, 1% l-glutamine, and 5% CO2. HCT116, HT29p, LS174T, and DLD1 cell lines were maintained as specified by American Type Culture Collection. THP1 human monocytic cells were obtained from C.K. Glass (University of California, San Diego, La Jolla, CA) and cultured in RPMI-1640 supplemented with l-glutamine and 10% heat-inactivated FBS (Collins, 1987). For all assays involving serum starvation, serum concentration was reduced to 0.2% for 6 h.
Plasmid DNA and siRNA transfection of HeLa, DLD1, or THP-1 (Kilpatrick et al., 2006) cells was performed using FUGENE 6 (Roche) or Oligofectamine (Invitrogen) according to the manufacturers' protocols. For Gαi3-YFP and mpYFP transfection, GeneJuice (EMD) was used. Oligos against human Gαi3 were obtained from Santa Cruz Biotechnology, Inc., and oligos against human GIV (Enomoto et al., 2005), Gαs long, and Gαs short (Zheng et al., 2004; Enomoto et al., 2005) were custom designed by Thermo Fisher Scientific. When reversal of phenotype was attempted, overexpression was performed 8–10 h after siRNA transfection, and cells were analyzed after ∼38–40 h. In those assays where siRNA was followed by plasmid overexpression, the efficiency of transfection was ∼45–55%.
Lysates used as a source for GIV were prepared by resuspending the cells in lysis buffer (20 mM Hepes, pH 7.2, 5 mM Mg-acetate, 125 mM K-acetate, 0.4% Triton X-100, and 1 mM DTT), supplemented with phosphatase (Sigma-Aldrich) and protease inhibitor cocktails (Roche), passed through a 28G needle at 4°C, and cleared at 10,000 g for 5 min before use in subsequent experiments.
Cell migration assays
Monolayer cell cultures (∼100% confluent) were wounded with a 1-ml sterile pipette tip creating a 1-mm wound, as previously described (Enomoto et al., 2005), and monitored by phase contrast or time-lapse video microscopy over the succeeding 12–16 h. For rapid chemotaxis assays, THP1 cells were differentiated using 5 nM TPA. Upon reaching confluency, half of the plate was scraped, and cells were monitored by phase-contrast microscopy during the succeeding 25 min as they migrated toward a steady chemoattractant gradient generated by releasing 100 μM fMLP (Sigma-Aldrich) from a micropipette tip placed on the opposite side of the plate.
Live-cell imaging
HeLa cells grown in chambered coverglass (Thermo Fisher Scientific) were scratch wounded to induce migration. Media was changed to Liebovitz L-15 supplemented with 2.5 mM Hepes, 4.5 g/liter glucose, and 100 mM sodium pyruvate as cells were placed on the stage of an inverted microscope (Axiovert 200M; Carl Zeiss, Inc.) equilibrated at 37°C (Incubator XL-3 [Carl Zeiss, Inc.] Heating Unit and TempControl 37–2 Digital). Images of many fields of cells along the wound edge were taken at 40× magnification (Plan Neofluar objective [Carl Zeiss, Inc.], 1.3 NA) in DIC and YFP channels every 10 min for 8 h using an XYZ moving stage (MS2000; Applied Scientific Instrumentation) and charge-coupled device camera (MicroMax 512 BFT; Princeton Instruments) with Slidebook 4.1 software (Intelligent Imaging Innovations, Inc.). Image processing was done using ImageJ software (National Institutes of Health).
In vitro binding
15–20 μg of purified GST fusion proteins or 30 μg GST alone were immobilized on glutathione Sepharose beads and resuspended in binding buffer (50 mM Tris-HCl, pH 7.4, 100 mM NaCl, 0.4% [vol/vol] NP-40, 10 mM MgCl2, 5 mM EDTA, 2 mM DTT, and protease inhibitor cocktail) containing ∼250 μg cell lysate. In some experiments, [35S]met (GE Healthcare)-labeled GIV was prepared using the TnT Quick Coupled Transcription/Translation System (Promega). Binding was performed overnight at 4°C with constant tumbling, and the beads were washed (4.3 mM Na2HPO4, 1.4 mM KH2PO4, pH 7.4, 137 mM NaCl, 2.7 mM KCl, 0.1% [vol/vol] Tween 20, 10 mM MgCl2, 5 mM EDTA, and 2 mM DTT) and boiled in sample buffer for SDS-PAGE. In the experiments using nucleotide loading, G proteins were preincubated with 30 μM GDP or 30 μM GDP, 30 μM AlCl3, and 10 mM NaF in binding buffer for 90 min at room temperature before binding, and the washing buffer was supplemented with GDP or GDP, AlCl3, and NaF as during binding. Bound proteins were either immunoblotted or exposed for autoradiography.
Immunoprecipitation
Cell lysates (∼1–2 mg of protein) were incubated overnight at 4°C with 2 μl of preimmune or anti-GIV serum in PBS. Protein A agarose beads (Invitrogen) were added and incubated at 4°C for an additional 90 min. Beads were either resuspended and boiled in SDS sample buffer or used for in vitro phosphorylation or trypsinization assays.
In vitro phosphorylation and limited proteolysis with trypsin
GIV was immunoprecipitated from Cos7 lysates, subdivided into equal aliquots, and preincubated with equal amounts (5 μg) of purified GST or GST-Gαi3 constructs (wt, Q204L, and G203A) for 4 h at 4°C. Phosphorylation was performed in 20 mM Hepes, pH 7.5, 5 mM MgCl2, 20 mM β-glycerophosphate, 1 mM EDTA, 0.1% β-mercaptoethanol, phosphatase, and protease inhibitor cocktail for 90 min at 30°C. The reaction was initiated by adding 50 μM ATP and 1,000 mU human recombinant activated Akt1 (EMD) and terminated by boiling in SDS sample buffer. Trypsin digestion was performed as described previously (Ghosh and Kornfeld, 2003).
IF
All the steps for IF were performed at room temperature as described previously (Zheng et al., 2004). In brief, cells were fixed with 3% PFA for 30 min, permeabilized with 0.2% Triton X-100 for 45 min, and incubated for 1 h with primary and secondary antibodies. Antibody dilutions were as follows: affinity purified anti-GIV, 1:10; anti-Gαi3 (EMD), 1:30; anti-V5 (Invitrogen), 1:200; anti-ManII, 1:500; anti-pericentrin, 1:1,000; anti–γ-tubulin (Sigma-Aldrich), 1:500; anti-βGALT, 1:20; Phalloidin-Texas Red, 1:1,000; secondary Alexa-conjugated antibodies, 1:500; and DAPI, 1:2,000 (Invitrogen). To visualize endogenous GIV or Gαi3, cells were permeabilized with 0.05% (weight/vol) saponin and 0.2 mg/ml BSA in PBS for 1 min before fixation. Images were acquired with a microscope (Axioimager M1; Carl Zeiss, Inc.) using a 100× aperture (Plan Neofluar; 1.3 NA), camera (Orca ER; Hamamatsu Photonics), and Openlab software (Improvision). For the centrosome repositioning assay, HeLa-C1 monolayers were scratch wounded, and 8–10 h after wounding the number of cells with centrosomal (GFP-centrin) and Golgi (ManII) positioning within the 120° sector facing the wound were counted (Fig. 2; Kupfer et al., 1982; Etienne-Manneville and Hall, 2001; Grande-Garcia et al., 2007).
For centrosomal localization studies, wide-field microscopy was performed using the 100× 1.3 N.A Neofluor oil immersion objective lenses on an inverted microscope (IX-70 DeltaVision Restoration; Olympus). The microscope was equipped with DAPI (360/40 excitation, 457/50 emission), FITC (490/20 excitation, 528/38 emission), and TRITC (555/28 excitation, 617/73 emission) band pass filter sets, a motorized stage (FCS2; Bioptechs), and a charge-coupled device camera (Photometrics CH350; Hamamatsu Photonics). Optical sections were collected at 0.2-μm intervals along the apical–basal axis. Applied Precision software (DeltaVision) was used to deconvolve z-section series of images. All individual images were processed using Image J software and assembled for presentation using Photoshop and Illustrator software (both Adobe).
Immunoblotting
Proteins samples were separated on 10% SDS-PAGE and transferred to PVDF membranes (Millipore). Membranes were blocked with PBS supplemented with 5% nonfat milk and then incubated sequentially with primary and secondary antibodies. Infrared imaging with two-color detection and quantification of Western blots was performed according to the manufacturer's protocols using an Odyssey imaging system (Li-Cor Biosciences). When anti-phosphoprotein antibodies (anti-pSer/Thr or anti-pAkt) were used, nonfat milk was replaced by BSA throughout the process. The dilution of the primary antibodies was as follows: anti-GIV serum, 1:500; anti-Gαi3, 1:200; anti-Gαs, 1:250; anti-actin, 1:2,000; anti-Akt total, 1:250; anti-pAkt, 1:250; anti-pSer, 1:250; anti-Gα, 1:200.
Statistical analysis
Experiments were repeated at least three times and results are expressed as mean ± SEM. Statistical significance between various conditions was assessed with Student's t test. P < 0.001 was considered significant.
Online supplemental material
Fig. S1 shows validation that Gαi3 is preferentially localized within pseudopods at the leading edge during cell migration using DiD as a PM marker. Fig. S2 shows that depletion of Gαi3 impairs EGF-stimulated Akt activation. Fig. S3 shows that insulin-stimulated actin remodeling is inhibited in Gαi3-depleted cells. Fig. S4 shows that GIV is occasionally distributed along actin stress fibers in epithelial cells. Fig. S5 shows that activation status of the G protein, and not phosphorylation of GIV at S1416, regulates the Gαi3–GIV interaction. Video 1 shows that HeLa cells expressing rGαi3-YFP demonstrate directional migration toward the wound whereas Gαi3-depleted cells show random motility. Video 2 shows that Gαi3-YFP preferentially localizes within pseudopods at the leading edge of a migrating HeLa cell. Video 3 shows that mp-YFP is distributed along the PM during polarized cell migration, with no preference for the leading edge. Online supplemental material is available at http://www.jcb.org/cgi/content/full/jcb.200712066/DC1.
Supplementary Material
Acknowledgments
We thank Masahide Takahashi for the GIV/Girdin construct and Roger Tsien for use of his microscopy equipment for live cell imaging.
This work was supported by National Institutes of Health grants (CA100768 and DKI7780) to M.G. Farquhar. Salary support for P. Ghosh and M. Garcia-Marcos were from National Institutes of Health (T32 DK07202) and a Basque Government Postdoctoral fellowship (BFI06.300), respectively.
P. Ghosh and M. Garcia-Marcos contributed equally to this paper.
Abbreviations used in this paper: β-GALT, β1-4 galactosyltransferase; DiD, 1,1′-Dioctadecyl-3,3,3′,3′-tetramethyllindodicarbocyanine perchlorate; GPCR, G protein–coupled receptor; IF, immunofluorescence; mp-YFP, myristoyl-palmitoyl–modified YFP; MTOC, microtubule-organizing center; PI3K, phosphoinositide 3-kinase; PM, plasma membrane; RTK, receptor tyrosine kinase; scr siRNA, scrambled siRNA; TPA, tetradecanoyl-phorbol acetate.
References
- Allen, R.A., A.E. Traynor, G.M. Omann, and A.J. Jesaitis. 1988. The chemotactic peptide receptor. A model for future understanding of chemotactic disorders. Hematol. Oncol. Clin. North Am. 2:33–59. [PubMed] [Google Scholar]
- Anai, M., N. Shojima, H. Katagiri, T. Ogihara, H. Sakoda, Y. Onishi, H. Ono, M. Fujishiro, Y. Fukushima, N. Horike, et al. 2005. A novel protein kinase B (PKB)/AKT-binding protein enhances PKB kinase activity and regulates DNA synthesis. J. Biol. Chem. 280:18525–18535. [DOI] [PubMed] [Google Scholar]
- Bailly, M., J. Wyckoff, B. Bouzahzah, R. Hammerman, V. Sylvestre, M. Cammer, R. Pestell, and J.E. Segall. 2000. Epidermal growth factor receptor distribution during chemotactic responses. Mol. Biol. Cell. 11:3873–3883. [DOI] [PMC free article] [PubMed] [Google Scholar]
- Brzostowski, J.A., C.A. Parent, and A.R. Kimmel. 2004. A G alpha-dependent pathway that antagonizes multiple chemoattractant responses that regulate directional cell movement. Genes Dev. 18:805–815. [DOI] [PMC free article] [PubMed] [Google Scholar]
- Chen, L., C. Janetopoulos, Y.E. Huang, M. Iijima, J. Borleis, and P.N. Devreotes. 2003. Two phases of actin polymerization display different dependencies on PI(3,4,5)P3 accumulation and have unique roles during chemotaxis. Mol. Biol. Cell. 14:5028–5037. [DOI] [PMC free article] [PubMed] [Google Scholar]
- Chen, Y., R. Corriden, Y. Inoue, L. Yip, N. Hashiguchi, A. Zinkernagel, V. Nizet, P.A. Insel, and W.G. Junger. 2006. ATP release guides neutrophil chemotaxis via P2Y2 and A3 receptors. Science. 314:1792–1795. [DOI] [PubMed] [Google Scholar]
- Coleman, D.E., E. Lee, M.B. Mixon, M.E. Linder, A.M. Berghuis, A.G. Gilman, and S.R. Sprang. 1994. Crystallization and preliminary crystallographic studies of Gi alpha 1 and mutants of Gi alpha 1 in the GTP and GDP-bound states. J. Mol. Biol. 238:630–634. [DOI] [PubMed] [Google Scholar]
- Collins, S.J. 1987. The HL-60 promyelocytic leukemia cell line: proliferation, differentiation, and cellular oncogene expression. Blood. 70:1233–1244. [PubMed] [Google Scholar]
- Denker, S.P., J.M. McCaffery, G.E. Palade, P.A. Insel, and M.G. Farquhar. 1996. Differential distribution of α subunits and βγ subunits of heterotrimeric G proteins on Golgi membranes of the exocrine pancreas. J. Cell Biol. 133:1027–1040. [DOI] [PMC free article] [PubMed] [Google Scholar]
- Dhanasekaran, D.N. 2006. Transducing the signals: a G protein takes a new identity. Sci. STKE. 2006:pe31. [DOI] [PubMed] [Google Scholar]
- Enomoto, A., H. Murakami, N. Asai, N. Morone, T. Watanabe, K. Kawai, Y. Murakumo, J. Usukura, K. Kaibuchi, and M. Takahashi. 2005. Akt/PKB regulates actin organization and cell motility via Girdin/APE. Dev. Cell. 9:389–402. [DOI] [PubMed] [Google Scholar]
- Etienne-Manneville, S., and A. Hall. 2001. Integrin-mediated activation of Cdc42 controls cell polarity in migrating astrocytes through PKCzeta. Cell. 106:489–498. [DOI] [PubMed] [Google Scholar]
- Etienne-Manneville, S., and A. Hall. 2002. Rho GTPases in cell biology. Nature. 420:629–635. [DOI] [PubMed] [Google Scholar]
- Euteneuer, U., and M. Schliwa. 1992. Mechanism of centrosome positioning during the wound response in BSC-1 cells. J. Cell Biol. 116:1157–1166. [DOI] [PMC free article] [PubMed] [Google Scholar]
- Ghosh, P., and S. Kornfeld. 2003. AP-1 binding to sorting signals and release from clathrin-coated vesicles is regulated by phosphorylation. J. Cell Biol. 160:699–708. [DOI] [PMC free article] [PubMed] [Google Scholar]
- Grande-Garcia, A., A. Echarri, J. de Rooij, N.B. Alderson, C.M. Waterman-Storer, J.M. Valdivielso, and M.A. del Pozo. 2007. Caveolin-1 regulates cell polarization and directional migration through Src kinase and Rho GTPases. J. Cell Biol. 177:683–694. [DOI] [PMC free article] [PubMed] [Google Scholar]
- Hermouet, S., J.J. Merendino Jr., J.S. Gutkind, and A.M. Spiegel. 1991. Activating and inactivating mutations of the alpha subunit of Gi2 protein have opposite effects on proliferation of NIH 3T3 cells. Proc. Natl. Acad. Sci. USA. 88:10455–10459. [DOI] [PMC free article] [PubMed] [Google Scholar]
- Janetopoulos, C., T. Jin, and P. Devreotes. 2001. Receptor-mediated activation of heterotrimeric G-proteins in living cells. Science. 291:2408–2411. [DOI] [PubMed] [Google Scholar]
- Jin, T., N. Zhang, Y. Long, C.A. Parent, and P.N. Devreotes. 2000. Localization of the G protein betagamma complex in living cells during chemotaxis. Science. 287:1034–1036. [DOI] [PubMed] [Google Scholar]
- Kilpatrick, L.M., R.L. Harris, K.A. Owen, R. Bass, C. Ghorayeb, A. Bar-Or, and V. Ellis. 2006. Initiation of plasminogen activation on the surface of monocytes expressing the type II transmembrane serine protease matriptase. Blood. 108:2616–2623. [DOI] [PubMed] [Google Scholar]
- Kupfer, A., D. Louvard, and S.J. Singer. 1982. Polarization of the Golgi apparatus and the microtubule-organizing center in cultured fibroblasts at the edge of an experimental wound. Proc. Natl. Acad. Sci. USA. 79:2603–2607. [DOI] [PMC free article] [PubMed] [Google Scholar]
- Le-Niculescu, H., I. Niesman, T. Fischer, L. DeVries, and M.G. Farquhar. 2005. Identification and characterization of GIV, a novel Galpha i/s-interacting protein found on COPI, endoplasmic reticulum-Golgi transport vesicles. J. Biol. Chem. 280:22012–22020. [DOI] [PubMed] [Google Scholar]
- Lilly, P.J., and P.N. Devreotes. 1995. Chemoattractant and GTPγS-mediated stimulation of adenylyl cyclase in Dictyostelium requires translocation of CRAC to membranes. J. Cell Biol. 129:1659–1665. [DOI] [PMC free article] [PubMed] [Google Scholar]
- Luttrell, L.M., Y. Daaka, and R.J. Lefkowitz. 1999. Regulation of tyrosine kinase cascades by G-protein-coupled receptors. Curr. Opin. Cell Biol. 11:177–183. [DOI] [PubMed] [Google Scholar]
- Merlot, S., and R.A. Firtel. 2003. Leading the way: directional sensing through phosphatidylinositol 3-kinase and other signaling pathways. J. Cell Sci. 116:3471–3478. [DOI] [PubMed] [Google Scholar]
- Piel, M., P. Meyer, A. Khodjakov, C.L. Rieder, and M. Bornens. 2000. The respective contributions of the mother and daughter centrioles to centrosome activity and behavior in vertebrate cells. J. Cell Biol. 149:317–330. [DOI] [PMC free article] [PubMed] [Google Scholar]
- Postma, M., J. Roelofs, J. Goedhart, H.M. Loovers, A.J. Visser, and P.J. Van Haastert. 2004. Sensitization of Dictyostelium chemotaxis by phosphoinositide-3-kinase-mediated self-organizing signalling patches. J. Cell Sci. 117:2925–2935. [DOI] [PubMed] [Google Scholar]
- Qiao, M., J.D. Iglehart, and A.B. Pardee. 2007. Metastatic potential of 21T human breast cancer cells depends on Akt/protein kinase B activation. Cancer Res. 67:5293–5299. [DOI] [PubMed] [Google Scholar]
- Raz, A. 1988. Actin organization, cell motility, and metastasis. Adv. Exp. Med. Biol. 233:227–233. [DOI] [PubMed] [Google Scholar]
- Ridley, A.J., H.F. Paterson, C.L. Johnston, D. Diekmann, and A. Hall. 1992. The small GTP-binding protein rac regulates growth factor-induced membrane ruffling. Cell. 70:401–410. [DOI] [PubMed] [Google Scholar]
- Ridley, A.J., M.A. Schwartz, K. Burridge, R.A. Firtel, M.H. Ginsberg, G. Borisy, J.T. Parsons, and A.R. Horwitz. 2003. Cell migration: integrating signals from front to back. Science. 302:1704–1709. [DOI] [PubMed] [Google Scholar]
- Servant, G., O.D. Weiner, E.R. Neptune, J.W. Sedat, and H.R. Bourne. 1999. Dynamics of a chemoattractant receptor in living neutrophils during chemotaxis. Mol. Biol. Cell. 10:1163–1178. [DOI] [PMC free article] [PubMed] [Google Scholar]
- Shan, D., L. Chen, D. Wang, Y.C. Tan, J.L. Gu, and X.Y. Huang. 2006. The G protein G alpha(13) is required for growth factor-induced cell migration. Dev. Cell. 10:707–718. [DOI] [PubMed] [Google Scholar]
- Simpson, F., S. Martin, T.M. Evans, M. Kerr, D.E. James, R.G. Parton, R.D. Teasdale, and C. Wicking. 2005. A novel hook-related protein family and the characterization of hook-related protein 1. Traffic. 6:442–458. [DOI] [PubMed] [Google Scholar]
- Stephens, L.R., A. Eguinoa, H. Erdjument-Bromage, M. Lui, F. Cooke, J. Coadwell, A.S. Smrcka, M. Thelen, K. Cadwallader, P. Tempst, and P.T. Hawkins. 1997. The G beta gamma sensitivity of a PI3K is dependent upon a tightly associated adaptor, p101. Cell. 89:105–114. [DOI] [PubMed] [Google Scholar]
- Stow, J.L., J.B. de Almeida, N. Narula, E.J. Holzman, L. Ercolani, and D.A. Ausiello. 1991. A heterotrimeric G protein, Gαi-3, on Golgi membranes regulates the secretion of a heparan sulfate proteoglycan in LLC-PK1 epithelial cells. J. Cell Biol. 114:1113–1124. [DOI] [PMC free article] [PubMed] [Google Scholar]
- Tetreault, M.P., P. Chailler, J.F. Beaulieu, N. Rivard, and D. Menard. 2008. Epidermal growth factor receptor-dependent PI3K-activation promotes restitution of wounded human gastric epithelial monolayers. J. Cell. Physiol. 214:545–557. [DOI] [PubMed] [Google Scholar]
- Thelen, M. 2001. Dancing to the tune of chemokines. Nat. Immunol. 2:129–134. [DOI] [PubMed] [Google Scholar]
- Ueda, M., Y. Sako, T. Tanaka, P. Devreotes, and T. Yanagida. 2001. Single-molecule analysis of chemotactic signaling in Dictyostelium cells. Science. 294:864–867. [DOI] [PubMed] [Google Scholar]
- Van Haastert, P.J., and P.N. Devreotes. 2004. Chemotaxis: signalling the way forward. Nat. Rev. Mol. Cell Biol. 5:626–634. [DOI] [PubMed] [Google Scholar]
- Velasco, A., L. Hendricks, K.W. Moremen, D.R. Tulsiani, O. Touster, and M.G. Farquhar. 1993. Cell type–dependent variations in the subcellular distribution of α-mannosidase I and II. J. Cell Biol. 122:39–51. [DOI] [PMC free article] [PubMed] [Google Scholar]
- Waters, C., S. Pyne, and N.J. Pyne. 2004. The role of G-protein coupled receptors and associated proteins in receptor tyrosine kinase signal transduction. Semin. Cell Dev. Biol. 15:309–323. [DOI] [PubMed] [Google Scholar]
- Weiss, T.S., C.E. Chamberlain, T. Takeda, P. Lin, K.M. Hahn, and M.G. Farquhar. 2001. Galpha i3 binding to calnuc on Golgi membranes in living cells monitored by fluorescence resonance energy transfer of green fluorescent protein fusion proteins. Proc. Natl. Acad. Sci. USA. 98:14961–14966. [DOI] [PMC free article] [PubMed] [Google Scholar]
- Xiao, Z., N. Zhang, D.B. Murphy, and P.N. Devreotes. 1997. Dynamic distribution of chemoattractant receptors in living cells during chemotaxis and persistent stimulation. J. Cell Biol. 139:365–374. [DOI] [PMC free article] [PubMed] [Google Scholar]
- Yin, J., K. Xu, J. Zhang, A. Kumar, and F.S. Yu. 2007. Wound-induced ATP release and EGF receptor activation in epithelial cells. J. Cell Sci. 120:815–825. [DOI] [PMC free article] [PubMed] [Google Scholar]
- Zacharias, D.A., J.D. Violin, A.C. Newton, and R.Y. Tsien. 2002. Partitioning of lipid-modified monomeric GFPs into membrane microdomains of live cells. Science. 296:913–916. [DOI] [PubMed] [Google Scholar]
- Zheng, B., C. Lavoie, T.D. Tang, P. Ma, T. Meerloo, A. Beas, and M.G. Farquhar. 2004. Regulation of epidermal growth factor receptor degradation by heterotrimeric Galphas protein. Mol. Biol. Cell. 15:5538–5550. [DOI] [PMC free article] [PubMed] [Google Scholar]
Associated Data
This section collects any data citations, data availability statements, or supplementary materials included in this article.