Abstract
Oxidative stress occurs where there is an imbalance between the production and scavenging of free radicals. Pregnancy per se is a state of oxidative stress due to the increased metabolic activity of placental mitochondria and reduced scavenging ability of antioxidant systems. Overproduction of reactive oxygen species may be associated with impaired fetal growth. However, the physiological influence of antioxidant systems on fetal growth is not well understood. In this study we assessed the effects of antioxidant systems on fetal growth using human thioredoxin (hTRX)-1 overexpressing transgenic (Tg) mice. Tg or C57BL/6 [wild-type (WT)] male mice were mated with WT female mice, and dams were killed to obtain the fetuses and placentas on gestational d 15. Tg fetuses were significantly heavier than WT fetuses, whereas placental weight did not differ significantly between the two groups. Immunohistochemically, hTRX-1 was localized to the nuclei of labyrinthine trophoblasts in Tg mice. In addition, placental expression of 8-hydroxy-2′-deoxyguanosine, which reflects DNA damage caused by oxidative stress, was reduced in Tg mice compared with WT mice. Placental expression of glucose transporter-1 mRNA and protein was significantly higher in Tg mice than WT mice, whereas no significant differences were observed for glucose transporter-3, IGF, and IGF-binding protein mRNA expression. These results suggest that placental and/or systemic antioxidant systems can influence fetal growth. In particular, increased hTRX-1 activity and the resulting modified placental redox state may play an important role in fetal growth by increasing the availability of glucose.
OXIDATIVE STRESS is provoked by an imbalance between the production of oxidative substances (reactive oxygen species) and the ability of antioxidant defenses to scavenge them. Pregnancy per se is a state of oxidative stress due to the increased metabolic activity of placental mitochondria and the reduced scavenging ability of antioxidants (1,2). Excessive production of reactive oxygen species may occur physiologically during certain periods of placental development and pathologically in association with conditions such as preeclampsia, diabetes, smoking, nutritional deficiency, infection, or inflammation, in which fetal growth can be impaired (3). Myatt et al. (4) suggested that oxidative stress may cause vascular dysfunction in the placenta that compromises fetal health and viability. However, the physiological influence of antioxidant systems on fetal growth is not well understood.
Thioredoxin (TRX) is an endogenous 12-kDa antioxidant protein with two redox active half-cysteine residues (-Cys-Gly-Pro-Cys-), the disulfide form of which is reduced by reduced nicotinamide adenine dinucleotide phosphate and TRX reductase. TRX is expressed ubiquitously in plants, bacteria, and mammalian cells, and has various actions, including protection against oxidative stress, control of growth, and regulation of apoptosis (5). TRX acts as a growth factor and is produced by a variety of cells, including Epstein-Barr virus-transformed B cells (6), MP6 T-cell hybridoma cells (7), and hepatoma cells (8). It stimulates the growth of lymphocytes (6), normal fibroblasts (9), and various tumor cell lines (8). TRX has also been detected in human decidua and trophoblasts, where it may protect the fertilized egg and placental trophoblasts from the cytotoxic effects of oxygen radicals (10,11). Di Trapani et al. (12) demonstrated the localization and secretion of TRX in transformed human trophoblast cells, and suggested that intracellular TRX may be involved in preventing cellular damage due to oxidative stress, whereas extracellular TRX may have an integrating role in the cytokine network operating at the fetomaternal interface, thereby assisting with implantation and the successful establishment of pregnancy. Moreover, TRX is involved in the maintenance of normal pregnancy. It is a component of early pregnancy factor (13), and it releases mouse embryos from two-cell block in vitro (14). Fujii et al. (15) examined the localization of TRX in human fetal tissues and suggested that it may play a significant role in redox regulation during the development of the fetus. In fact, homozygous knockout of the TRX gene in mice leads to spontaneous abortion and absorption before gastrulation (16). Thus, TRX has a major role in implantation as well as in fetal growth during later pregnancy (17,18).
The purpose of this study was to investigate the influence of regulation of the fetoplacental redox state by TRX on fetal growth during pregnancy. To analyze the biological significance of TRX-controlled redox systems during fetal growth, we compared placentas and fetuses from human TRX (hTRX)-1 overexpressing transgenic (Tg) mice and non-Tg [wild-type (WT)] mice as controls.
Materials and Methods
Animals
This study was conducted in accordance with the principles and procedures outlined by the Ethics Committee for Animal Research of Mie University Graduate School of Medicine. C57BL/6 mice purchased from CLEA Japan, Inc. (Tokyo, Japan) and raised in our laboratory were used as the WT controls. Tg mice overexpressing the hTRX-1 gene on a C57BL/6 background were purchased from Oriental Yeast Co. (Tokyo, Japan). To create the hTRX-1 Tg mice, hTRX-1 cDNA was inserted between the β-actin promoter and the β-actin terminator, and the transgene was microinjected into the pronucleus of fertilized eggs from C57BL/6 mice (19). The presence of the hTRX-1 transgene was confirmed by performing the PCR with mouse genomic DNA as a template and the following oligonucleotide primers: forward primer, 5′-CCGCTCGTCAGACTCCAGC-3′; reverse primer, 5′-CTGGTTATATTTTCAGAAAACATG-3′ (Sigma- Genosys; Sigma-Aldrich, St. Louis, MO).
Tissue preparation
For this study, 8-wk-old virgin WT female mice were bred with either homozygous hTRX-1 Tg or WT males. The day of detecting a vaginal plug was defined as embryonic d 0. Dams were housed individually in a specific-pathogen-free facility with a 12-h light, 12-h dark cycle. Animals were allowed free access to water and standard rodent chow (CLEA Japan). Daily energy intake was calculated from the measurement of the food intake. On embryonic d 15, food was withdrawn, and animals were weighed 14 h before dissection. The wet weights of the placenta and fetus were recorded after removal of fluid from the specimens with absorbent paper. To eliminate the potential influences of litter size on fetal and placental growth, only litters of similar size (i.e. eight to nine fetuses) were studied. Placental tissues were fixed in 4% paraformaldehyde (Nakarai Tesque, Kyoto, Japan) in 0.01 m sodium phosphate buffer (PBS) (pH 7.4) and then were embedded in paraffin (Merck Ltd. Japan, Tokyo, Japan) using standard procedures. The paraffin blocks were cut into 5-μm sections and placed onto glass slides coated with triethoxyaminopropylsilane (Dako ChemMate; Dako, Kyoto, Japan). The remaining placental tissues and fetal livers were washed with 0.9% NaCl to remove adherent blood and then were stored at −80 C until use.
Immunohistochemistry of the placentas
For immunohistochemical detection of human and mouse TRX-1 (mTRX-1) proteins, deparaffinized and rehydrated sections were immersed in 0.3% H2O2 in PBS for 30 min to block endogenous peroxidase. The sections were then preincubated with skim milk (1%, wt/vol) in PBS for 30 min to block nonspecific antibody binding, followed by overnight incubation with the primary antibodies diluted with PBS at room temperature in a humidified atmosphere. The primary antibodies were anti-hTRX-1 mouse IgG (1:50) or anti-mTRX-1 rabbit IgG (1:50) (Redox Bioscience Inc., Kyoto, Japan). After three washings for 15 min each in PBS, the sections were incubated with horseradish peroxidase (HRP)-labeled goat antimouse IgG or HRP-labeled goat antirabbit IgG (Medical and Biological Laboratories, Nagoya, Japan) diluted 1:50 with PBS for 2 h at room temperature. Localization of HRP was visualized by reaction with 3,3′-diaminobenzidine (0.2 mg/ml) and 0.01% H2O2.
To evaluate oxidative stress in the placenta, tissue sections (5 μm thick) were incubated with a mouse monoclonal anti-8-hydroxy-2′-deoxyguanosine (8-OHdG) antibody (5 μg/ml; Japan Institute for the Control of Aging, Fukuroi, Japan) overnight at room temperature. The sections were then incubated for 2 h with HRP-labeled goat antimouse IgG (1:100) (Medical and Biological Laboratories). Localization of HRP was visualized by reacting the sections with 3,3′-diaminobenzidine and H2O2, as described previously. Immunostaining for 8-OHdG was then performed as described previously, and specimens were subjected to densitometric analysis. Immunohistochemical findings (8-OHdG index) were analyzed as described previously with slight modifications (20). The following equation was used to calculate the 8-OHdG index: index = Σ [(X − threshold) × area (μm2)]/total cell number, where X is the staining density indicated by a number between zero and 124 on the gray scale, and X is above the threshold. Briefly, digitized color images of placental sections were obtained using a microscope (BX-50; Olympus, Hamburg, Germany) with a digital imaging system (DXM1200F; Nikon Corp., Tokyo, Japan). The images were opened in gray-scale mode using ImageJ version 1.33 software (available by ftp from http://rsb.info.nih.gov/ij/). Toyokuni et al. (20) have confirmed a close association between the 8-OHdG index and the 8-OHdG level determined by HPLC with electrochemical detection. The 8-OHdG index was expressed as the means ± sem for three dams in the case of both WT and Tg mice.
RNA isolation and RT-PCR
Two randomly chosen placentas and fetal livers were pooled from each of the pregnant mice, and total RNA was isolated using Sepasol-RNA1 Super according to the manufacturer’s instructions (Nakarai Tesque). RT of total RNA was conducted according to the manufacturer’s instructions with TaqMan Reverse Transcription Reagents and a TaqMan Gold RT-PCR kit (Applied Biosystems, Foster City, CA).
Quantitative real-time PCR
RT-PCR products were analyzed by quantitative real-time PCR using TaqMan Gene Expression Assays of several target genes as follows: glucose transporter (GLUT)-1 (Mm01192272_g1), GLUT-2 (Mm00446230_g1), GLUT-3 (Mm00627579_m1), IGF-I (Mm00439561_m1), IGF-II (Mm00580426_m1), IGF-binding protein (IGFBP)-1 (Mm00833447_m1), IGFBP-2 (Mm00492632_m1), mTRX reductase-1 (Mm01233076_m1), p53 (Mm00441964_g1), Bcl2-associated X protein (Bax) (Mm00432050_m1), caspase-3 (Mm01195085_m1), glucocorticoid receptor (GR) (Mm00433833_mH), 11β-hydroxysteroid dehydrogenase (11bHSD) type 1 (11bHSD-1) (Mm00476182_m1), and 11bHSD-2 (Mm00492541_g1) (Applied Biosystems). Primers and probes for detection of hTRX-1 and mTRX-1 were designed using Primer Express 1.0 (PerkinElmer Applied Biosystems, Norwalk, CT) from available sequences [hTRX-1 (NM_003329), mTRX-1 (NM_01160)] as follows: hTRX-1 forward, 5′-ccatttccatcggtccttaca-3′ and reverse, 5′-gctctcgatctgcttcaccat-3′; TaqMan Probe, 5′-cgctcgtcagactccagcagcca-3′; and mTRX-1 forward, 5′-cattgcctgttcttgcagagg-3′ and reverse, 5′-ccctggaactggaggaacaa-3′; TaqMan Probe, 5′-tcagttctcagcatccatacggcagc-3′. The level of gene expression was normalized for that of acidic ribosomal phosphoprotein P0 (36B4) RNA (Mm01974474_gH). All PCRs were performed using a real-time PCR 7300 system. Gene expression was quantitated as the second step of a two-step RT-PCR. Assays were done in 50 μl singleplex reaction mixture containing TaqMan Universal PCR Master Mix, 20× TaqMan Gene Expression Assay Mix, and cDNA according the manufacturer’s instructions (Applied Biosystems). Reaction conditions consisted of preincubation at 50 C for 2 min and 95 C for 10 min, followed by 40 cycles of 95 C for 15 sec and 60 C for 1 min. The CT values were recorded automatically (21). Quantitative RT-PCR data are presented as the mean ± sem (arbitrary units) of seven independent dams for both WT and Tg mice.
SDS-PAGE and Western blot analysis of the placentas
One randomly chosen placenta was collected from each pregnant mouse. These placentas were homogenized in the presence of Protease Inhibitor Cocktail for Use with Mammalian Cell and Tissue Extracts (Nakarai Tesque), and 100 mm HEPES (pH 7.4), 1.5 m NaCl, and 0.5% Triton X-100. After centrifugation at 13,000 g at 4 C for 20 min, protein concentrations were determined with a Lowry protein assay kit (Bio-Rad, Tokyo, Japan). Protein standards (Invitrogen, Tokyo, Japan) and 40 μg protein were separated by electrophoresis on NuPAGE 4–12% Bis-Tris gels with NuPAGE 2-(N-morpholino) ethanesulfonic acid sodium dodecyl sulfate running buffer (Invitrogen) at 150 V until the dye front reached the bottom of the gel. Proteins were transferred to nitrocellulose membranes with iBlot Dry Blotting System (Invitrogen). Nonspecific binding was blocked with 10% (wt/vol) skim milk and 0.5% Tween 20 in PBS. The blotted membranes were probed with antibodies for hTRX-1 (1:2000), mTRX-1 (1:2000; Redox Bioscience), or GLUT-1 (1:1000; Alpha Diagnostics International Inc., San Antonio, TX). After incubation with the appropriate secondary antibodies conjugated to HRP (Medical and Biological Laboratories), positive immunoreactivity was visualized with ECL Plus Western Blotting Detection Reagent (GE Healthcare, Tokyo, Japan) and was detected using an LAS-3000mini (Fujifilm Corp., Tokyo, Japan). For quantification of the Western blotting data, the immunoreactive bands were quantified by densitometric analysis with an imaging densitometer (ImageJ version 1.33 software). The fold changes relative to values in the control group were represented as the mean ± sem for three independent dams in the case of both WT and Tg mice.
Measurement of blood glucose, serum insulin, and corticosterone
On embryonic d 15, the fasting blood glucose, serum insulin, and corticosterone concentrations were measured in duplicate for the dams using a Glucometer (Glucocard; Arkray Co., Kyoto, Japan), mouse insulin ELISA kit (AKRIN-031; Shibayagi, Gunma, Japan), and corticosterone ELISA kit (Assaypro, St. Charles, MO), respectively. The sensitivity of the insulin and corticosterone assays was 39 and 40 pg/ml, respectively.
Data presentation and statistical analysis
Results are expressed as the mean ± sem. As indicated in the tables and figure legends, differences between the hTRX-1 Tg and WT mice were analyzed by the unpaired Student’s t test and the Mann-Whitney U test where appropriate. P values less than 0.05 were considered statistically significant.
Results
Effect of hTRX-1 overexpression on fetal and placental development
During pregnancy (from embryonic d 0–15), the maternal weight gain (WT, n = 15: 12.6 ± 0.4 g; hTRX-1 Tg, n = 10: 12.8 ± 0.5 g; P = 0.69) and energy intake per unit body weight (WT, n = 15: 11.2 ± 0.3 kcal/g; hTRX-1 Tg, n = 10: 10.9 ± 0.4 kcal/g; P = 0.56) of Tg mice were lower than those of WT mice, but there were no significant differences. Fasting maternal blood glucose and serum insulin concentrations on embryonic d 15 (glucose: WT, n = 15: 60.3 ± 1.4 mg/dl and hTRX-1 Tg, n = 10: 57.4 ± 4.8 mg/dl, P = 0.53; insulin: WT, n = 5: 262.6 ± 60.7 pg/ml and hTRX-1 Tg, n = 4: 183.8 ± 85.5 pg/ml, P = 0.45) were not affected by the fetal genotype. On embryonic d 15, the body weight of hTRX-1 Tg fetuses was significantly greater than that of WT mice, whereas the placental weight did not differ between the groups (Table 1). The fetal to placental weight ratio of hTRX-1 Tg mice was significantly greater than that of WT mice. Thus, whereas the maternal energy intake of hTRX-1 Tg mice tended to be lower than that of WT mice, the weight of hTRX-1 Tg fetuses was significantly greater than that of WT fetuses.
Table 1.
Effects of hTRX-1 overexpression: growth morphometry of WT and hTRX-1 Tg fetuses on embryonic d 15
| WT (n = 15) | Tg (n = 10) | |
|---|---|---|
| Fetal weight (mg) | 370.3 ± 17.1 | 447.3 ± 26.3a |
| Placental weight (mg) | 86.8 ± 0.8 | 87.2 ± 1.5 |
| Fetal to placental weight ratios | 4.3 ± 0.2 | 5.2 ± 0.3a |
The litter was considered an experimental unit in the statistical analyses. Therefore, the averages of fetal and placental weights for the litter were calculated. Data are presented as means ± sem and compared statistically using the unpaired Student’s t test. n, Number of pregnant mice.
Statistically different from WT mice (P < 0.05).
Reduced oxidative stress in the placentas of hTRX-1 Tg mice
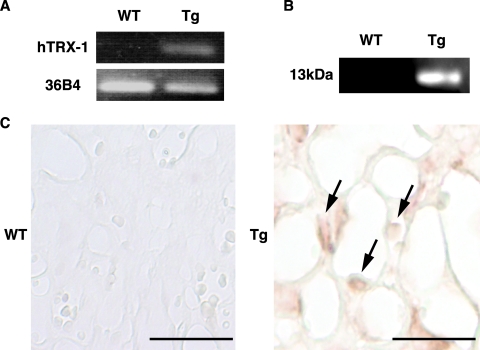
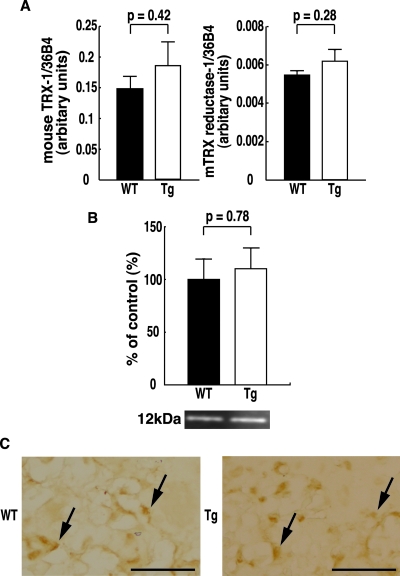
To assess the effect of placental overexpression of hTRX-1, the level of expression of hTRX-1 and mTRX-1 mRNA and protein in the placenta was confirmed by quantitative real-time PCR, Western blot analysis, and immunohistochemistry. Placental expression of hTRX-1 mRNA and protein was only detected in hTRX-1 Tg mice (Fig. 1, A and B). Moreover, hTRX-1 was primarily localized in the nuclei of decidual cells, spongiotrophoblasts, and labyrinthine trophoblasts (Fig. 1C). In contrast, mTRX-1 was observed in the decidual and basal zones of the placenta in both hTRX-1 Tg and WT mice (Fig. 2C), and there were no differences in the placental levels of mTRX-1 mRNA and protein between WT mice and hTRX-1 Tg mice (Fig. 2, A and B). mTRX reductase-1 mRNA levels were not significantly different between hTRX-1 Tg and WT mice (Fig. 2A).
Figure 1.
RT-PCR (A), Western blotting (B), and immunohistochemical analysis (C) of hTRX-1 expression in the placentas of WT mice and hTRX-1 Tg mice. A and B, In hTRX-1 Tg mice, a strong signal for hTRX-1 is detected, whereas no signal for hTRX-1 is seen in WT mice. The hTRX-1 mouse antibody recognized hTRX-1 as a single band of 13 kDa. C, Expression of hTRX-1 protein was detected in hTRX-1 Tg mice (arrows), but not in WT mice. Scale bars, 50 μm.
Figure 2.
Quantitative RT-PCR (A) analysis of mTRX-1 and mTRX reductase-1 mRNA expression in the placenta, and Western blot (B) and immunohistochemical (C) analysis of mTRX-1 protein expression in the placentas of WT and hTRX-1 Tg mice. A and B, WT placentas are indicated by the closed column, and Tg placentas are indicated by the open column. Comparisons were made by the unpaired Student’s t test. The mTRX-1 rabbit antibody recognized mTRX-1 as a single band of 12 kDa. C, Expression of mTRX-1 protein was observed in both hTRX-1 Tg and WT placentas (arrows). Scale bar, 50 μm.
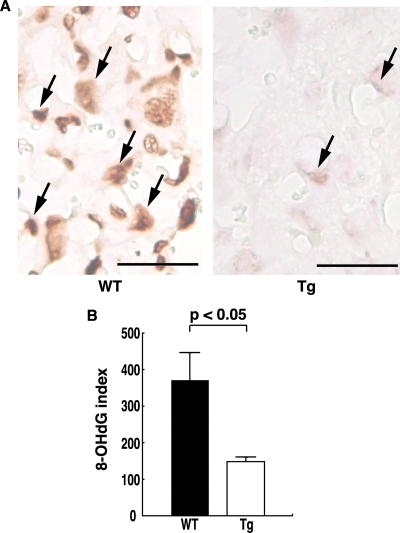
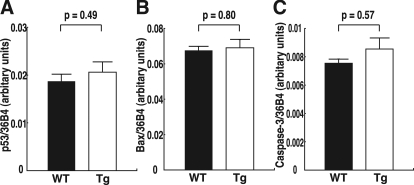
Oxidative stress in the placenta was assessed by measuring the production of 8-OHdG, which reflects DNA damage due to oxidative stress. Using immunohistochemistry, 8-OHdG was detected in the placenta, particularly in the labyrinthine trophoblasts that are involved in the exchange of gasses, nutrients, and waste products between the maternal and fetal circulations. 8-OHdG expression was prominent in the placentas of WT mice, but it was weak in the placentas of hTRX-1 Tg mice (Fig. 3A). The 8-OHdG index was significantly higher in WT mice than hTRX-1 Tg mice (Fig. 3B). Thus, the oxidative stress acting on labyrinthine trophoblasts was significantly weaker in hTRX-1 Tg mice compared with WT mice. In contrast, there were no significant differences in the expression of mRNA for molecules associated with apoptosis in the placenta (Fig. 4).
Figure 3.
Immunostaining of labyrinthine trophoblasts for 8-OHdG. A, 8-OHdG expression was prominent in the placentas of WT mice, whereas it was weak in the placentas of hTRX-1 Tg mice (arrows). Scale bar, 50 μm. B, The 8-OHdG index of each group. Columns represent the mean ± sem for three dams determined by scanning densitometry data after immunohistochemistry. WT placentas are indicated by the closed columns, and Tg placentas are indicated by the open columns. P values were calculated by the Mann-Whitney U test.
Figure 4.
Placental expression of mRNA for molecules associated with apoptosis. A, p53 mRNA expression. B, Bax mRNA expression. C, Caspase-3 mRNA expression. WT placentas are indicated by the closed columns, and Tg placentas are indicated by the open columns. Comparisons were made by the unpaired Student’s t test.
Increased placental GLUT-1 mRNA and protein expression in hTRX-1 Tg mice
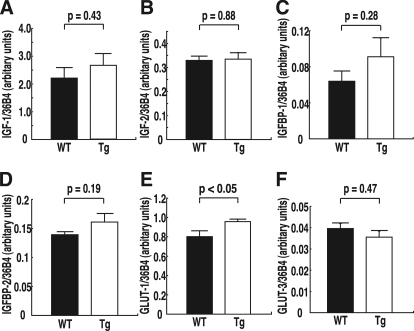
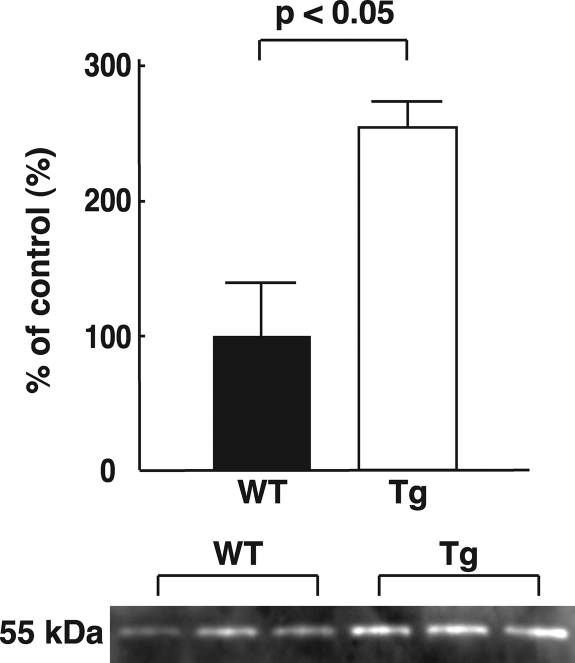
To understand the molecular basis of the decrease of oxidative stress in the placenta, quantitative real-time PCR was used to analyze the expression of mRNA for molecules associated with fetal growth in the placenta and the fetal liver. In the placenta, GLUT-1 mRNA levels were significantly increased in hTRX-1 Tg mice, whereas there was no significant change of GLUT-3 mRNA (Fig. 5). No significant differences of GLUT-1 and GLUT-2 mRNA expression in the fetal liver were observed. Furthermore, the expression of IGF-I, IGF-II, IGFBP-1, and IGFBP-2 mRNA in the placenta and the fetal liver did not show any significant differences between hTRX-1 Tg and WT mice (Fig. 5 and Table 2). Placental GLUT-1 protein expression was also significantly increased in hTRX-1 Tg mice (Fig. 6).
Figure 5.
Placental expression of mRNA for molecules associated with fetal growth. A, IGF-I mRNA expression. B, IGF-II mRNA expression. C, IGFBP-1 mRNA expression. D, IGFBP-2 mRNA expression. E, GLUT-1 mRNA expression. F, GLUT-3 mRNA expression. WT placentas are indicated by the closed columns, and Tg placentas are indicated by the open columns. Comparisons were made by the unpaired Student’s t test.
Table 2.
The expression of mRNA for molecules associated with fetal growth in the fetal liver
| WT | Tg | P value | |
|---|---|---|---|
| IGF-I | 0.48 ± 0.03 | 0.52 ± 0.08 | 0.67 |
| IGF-II | 0.14 ± 0.01 | 0.13 ± 0.01 | 0.83 |
| IGFBP-1 | 0.18 ± 0.04 | 0.32 ± 0.09 | 0.20 |
| IGFBP-2 | 0.023 ± 0.004 | 0.036 ± 0.010 | 0.26 |
| GLUT-1 | 0.14 ± 0.01 | 0.15 ± 0.01 | 0.69 |
| GLUT-2 | 0.15 ± 0.02 | 0.19 ± 0.03 | 0.18 |
Quantitative RT-PCR data are presented as mean ± sem (arbitrary units) of seven independent dams for both WT and Tg mice. The expression levels were normalized to those of acidic ribosomal phosphoprotein P0 (36B4) RNA.
Figure 6.
Western blot analysis of GLUT-1 protein expression in the placentas of WT and hTRX-1 Tg mice. WT placentas are indicated by the closed columns, and Tg placentas are indicated by the open columns. Statistical analysis was performed by the unpaired Student’s t test.
Alteration of placental 11bHSD-1 and 11bHSD-2 mRNA expression in hTRX-1 Tg mice
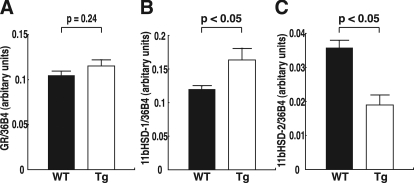
To increase our understanding of how TRX influences GLUT-1 expression by altering the redox state, quantitative real-time PCR analysis of molecules associated with glucocorticoid signaling in the placenta was performed. Although there were no differences of GR mRNA levels between the two groups, 11bHSD-1 mRNA levels were significantly increased, and 11bHSD-2 mRNA levels were significantly decreased in hTRX-1 Tg mice (Fig. 7). On the other hand, the maternal serum corticosterone concentrations on embryonic d 15 (WT, n = 5: 528.6 ± 187.5 ng/ml; and hTRX-1 Tg, n = 5: 519.2 ± 128.9 ng/ml; P = 0.97) were not affected by the fetal genotype.
Figure 7.
Placental expression of mRNA for molecules associated with glucocorticoid signaling. A, GR mRNA expression. B, 11bHSD-1 mRNA expression. C, 11bHSD-2 mRNA expression. WT placentas are indicated by the closed columns, and Tg placentas are indicated by the open columns. Comparisons were made by the unpaired Student’s t test.
Discussion
The present study showed that, on d-15 gestation, hTRX-1 Tg fetuses were significantly heavier than WT fetuses, whereas placental weight did not differ between the two groups. Because Ishikawa et al. (22) reported that the fetal weight of mice is mainly regulated by the litter size during late gestation, only litters of a similar size were studied. Preliminary experiments confirmed that litter size was not affected by the fetal genotype (data not shown). Other factors, such as maternal age, parity, and nutritional status, also did not produce a significant difference between the two groups. In hTRX-1 Tg mice, the placental level of 8-OHdG was significantly lower than in WT mice. These results suggest that hTRX-1 expression in the placenta may play a significant physiological role during fetal growth. Burdon et al. (23) have also demonstrated oxidative stress in the murine placenta during normal pregnancy and have suggested that the mouse may provide a useful genetic model to investigate the role of antioxidant systems. The placental environment is one of enhanced oxidative stress that induces protective mechanisms against free radicals as gestation progresses. Overall, plasma free radical trapping and antioxidants are able to counteract oxidative stress in normal pregnancy (24). All of the major antioxidant systems, including superoxide dismutase, catalase, glutathione, and TRX, are present in the placenta (2).
In the present study, 8-OHdG was used to assess the intensity of oxidative stress in the placenta. An increase of oxidative stress can lead to free radical attack on nutritionally and physiologically important molecules, such as lipids, proteins, and DNA (25,26,27). Consequent damage to purines and pyrimidines can result in the oxidative modification of DNA. Among the oxidized bases, 8-OHdG is the most abundant (28,29) and is considered to be an important biomarker of oxidative DNA damage (30). It has been reported that hTRX-1 is induced by various oxidative stresses and that it translocates from the cytoplasm to the nucleus in response to oxidative stress (31,32,33). Moreover, systemic hTRX-1 Tg mice were more resistant to oxidative stress than WT mice (19,34). We showed by immunohistochemistry that hTRX-1 was located in the nuclei of labyrinthine trophoblasts, and mTRX-1 was localized in the placentas of hTRX-1 Tg mice. The distribution of mTRX-1 and mTRX reductase-1 did not differ between hTRX-1 Tg and WT mice, as previously reported for mTRX-1 expression in liver and bone marrow cells (35,36). Takagi et al. (19) reported the levels of hTRX-1 in various tissues of hTRX-1 Tg mice and showed that hTRX-1 protein levels are 3- to 6-fold higher than the levels of endogenous mTRX-1 protein. In this study, WT female mice were mated with either homozygous hTRX-1 Tg males or WT males. Thus, the results of the present study are supported by previous reports, and indicate that changes of the fetoplacental redox state are caused by hTRX-1 overexpression, but not the maternal redox state. Together, the data suggest that an increase of hTRX-1 modulates the cellular redox state, thereby protecting the placenta from oxidative DNA damage.
Takagi et al. (37) reported that the 8-OHdG level was positively correlated with the hTRX-1 level in the placenta during normal human pregnancy. Based on the present findings, it appears that the role of placental hTRX-1 is to protect against DNA damage caused by oxidative stress that occurs in the placenta during normal pregnancy. Sahlin et al. (38) demonstrated that placental expression of hTRX-1 mRNA was significantly decreased in preeclamptic and/or growth restricted pregnancies compared with normal pregnancy. In contrast, Shibata et al. (39) reported a 2- to 3-fold increase of hTRX-1 in placentas from preeclampsia patients compared with normal placentas. Although the exact reason for the incompatible results of the two studies remains unknown, it is possible that these findings may reflect different phases of the adaptive response to oxidative stress during preeclampsia. In any case, intrauterine growth restriction due to pathological conditions, such as preeclampsia, may be related to impairment of placental antioxidant systems, including hTRX-1.
To assess further the role of hTRX-1 in fetal growth, the expression of several genes that are associated with fetal growth was examined in the placenta and fetal liver. Placental levels of GLUT-1 mRNA and protein expression were significantly increased in hTRX-1 Tg mice, whereas no significant change was observed in the expression of other molecules in the placenta and the fetal liver. Glucose is the primary substrate for fetal energy metabolism, and, in the absence of appreciable gluconeogenesis (40), placental transport constitutes the only source for the fetus. Net transport of glucose across the placenta is strongly influenced by the maternal blood glucose concentration (41), but blood glucose levels were not significantly different between the two groups in the present study. Glucose transport across the placenta involves facilitated diffusion that is mediated by members of the facilitated GLUT family. Yamaguchi et al. (42) reported that GLUT-1 and GLUT-3 mRNA is expressed in the mouse placenta. In addition, the level of GLUT-1 mRNA increases after midpregnancy, a change that may occur to meet the increased glucose requirement of the fetus. Although placental regulation of GLUT is not completely understood, Hahn et al. (43) suggested that dysfunction of GR may alter GLUT expression in the murine placenta. They showed that Tg mice bearing an antisense GR gene construct that reduced placental GR expression had altered fetal growth that resulted in the birth of intrauterine growth restriction offspring accompanied by a decrease of GLUT-1 and a compensatory increase of GLUT-3. Previous studies have demonstrated that GR function is sensitive to the redox state in vitro, most likely due to reversible modification of cysteine residues in the receptor. Makino et al. (44,45) demonstrated that overexpression of TRX can overcome H2O2-mediated suppression of the ligand binding activity of GR. The effects of glucocorticoid on several target organs are regulated by local, tissue-specific expression of the two forms of 11bHSD-1 and -2 that interconvert active and inactive glucocorticoids, and both enzymes are expressed in the mouse placenta (46). It has been proposed that placental 11bHSD may be an important determinant of local glucocorticoid activity within the placenta by regulating the access of glucocorticoids to their intracellular receptors (47,48). In the present study, placental 11bHSD-1 mRNA levels were significantly increased, and 11bHSD-2 mRNA levels were significantly decreased in hTRX-1 Tg mice, whereas there were no differences of the maternal serum corticosterone concentration and placental level of GR mRNA between the groups. Our preliminary observation showed that hTRX-1 Tg mice were significantly heavier than WT mice at 3.5 d after birth (WT, n = 83: 2.11 ± 0.02 g; and hTRX-1 Tg, n = 79: 2.21 ± 0.03 g; P < 0.01; T.U. and T.S., unpublished data). Therefore, the results of the present study, supported by previous reports, suggest that increased hTRX-1 expression and subsequent alterations of the cellular redox state in the placenta modulate GLUT-1 expression via local effects of glucocorticoids, thereby supporting fetal growth.
In contrast, GLUT-1 mRNA levels in the fetal liver were not significantly different between the two groups. This discrepancy of GLUT-1 mRNA expression between the placenta and fetal liver appears to reflect a difference of the cellular redox state of the two tissues. In our preliminary experiments, there was no difference in the oxidative stress acting on the fetal liver between hTRX-1 Tg and WT mice (Y.K. and T.S., unpublished data). Oxidative stress has been implicated in the induction of apoptosis because many oxidants or activators of cellular oxidative metabolism induce apoptosis (49). Because TRX is involved in intracellular signaling that combats oxidative stress and apoptosis (31) through the regulation of a class of transcription factors related to growth and programmed cell death (50,51), it is possible that apoptotic pathways may be involved in the modulation of fetal growth by TRX. Levy et al. (52) reported an increase of placental p53 expression in growth-restricted pregnancies compared with normal pregnancies. p53 is a ubiquitous transcription factor that is activated by DNA damage, and the transcriptional and apoptotic potential of p53 in placental cells has been demonstrated in rodent models (53). p53 has been shown to up-regulate Bax in human trophoblasts cultured under hypoxic conditions (54). In vivo studies of the effects of DNA-damaging agents on placentation in the rat have shown that cells within the labyrinth are most susceptible to p53-mediated apoptosis, as evidenced by an increase of active caspase-3 (53). In the present study, there were no differences in the placental levels of mRNA for molecules associated with apoptosis between the two groups. However, other TRX-mediated mechanisms that could have an influence on fetal growth cannot be excluded.
In summary, placental and/or systemic antioxidant systems play a role in influencing fetal growth. In particular, increased TRX expression and subsequent changes of the placental redox state play an important role in fetal growth by protecting against oxidative stress and increasing placental glucose availability through up-regulation of GLUT-1 expression based on local changes of glucocorticoid metabolism.
Acknowledgments
We thank Mrs. Harumi Noro for her secretarial and technical assistance.
Footnotes
This work was partly supported by Grants-In-Aid for Scientific Research from the Ministry of Education, Science, and Culture, Japan (Nos. 18791150 and 19390428), and by grants from the Kanzawa Medical Research Foundation and the Smoking Research Foundation.
Disclosure Statement: The authors have nothing to disclose.
First Published Online May 1, 2008
Abbreviations: Bax, Bcl2-associated X protein; GLUT, glucose transporter; GR, glucocorticoid receptor; HRP, horseradish peroxidase; hTRX, human thioredoxin; 8-OHdG, 8-hydroxy-2′-deoxyguanosine; 11bHSD, 11β-hydroxysteroid dehydrogenase; IGFBP, IGF-binding protein; mTRX, mouse thioredoxin; Tg, transgenic; TRX, thioredoxin; WT, wild type.
References
- Wisdom SJ, Wilson R, McKillop JH, Walker JJ 1991 Antioxidant systems in normal pregnancy and in pregnancy-induced hypertension. Am J Obstet Gynecol 165(6 Pt 1):1701–1704 [DOI] [PubMed] [Google Scholar]
- Myatt L, Cui X 2004 Oxidative stress in the placenta. Histochem Cell Biol 122:369–382 [DOI] [PubMed] [Google Scholar]
- Luo ZC, Fraser WD, Julien P, Deal CL, Audibert F, Smith GN, Xiong X, Walker M 2006 Tracing the origins of “fetal origins” of adult diseases: programming by oxidative stress? Med Hypotheses 66:38–44 [Google Scholar]
- Myatt L, Kossenjans W, Sahay R, Eis A, Brockman D 2000 Oxidative stress causes vascular dysfunction in the placenta. J Matern Fetal Med 9:79–82 [DOI] [PubMed] [Google Scholar]
- Arner ES, Holmgren A 2000 Physiological functions of thioredoxin and thioredoxin reductase. Eur J Biochem 267:6102–6109 [DOI] [PubMed] [Google Scholar]
- Wakasugi N, Tagaya Y, Wakasugi H, Mitsui A, Maeda M, Yodoi J, Tursz T 1990 Adult T-cell leukemia-derived factor/thioredoxin, produced by both human T-lymphotropic virus type I- and Epstein-Barr virus-transformed lymphocytes, acts as an autocrine growth factor and synergizes with interleukin 1 and interleukin 2. Proc Natl Acad Sci USA 87:8282–8286 [DOI] [PMC free article] [PubMed] [Google Scholar]
- Ericson ML, Horling J, Wendel-Hansen V, Holmgren A, Rosen A 1992 Secretion of thioredoxin after in vitro activation of human B cells. Lymphokine Cytokine Res 11:201–207 [PubMed] [Google Scholar]
- Nakamura H, Masutani H, Tagaya Y, Yamauchi A, Inamoto T, Nanbu Y, Fujii S, Ozawa K, Yodoi J 1992 Expression and growth-promoting effect of adult T-cell leukemia-derived factor. A human thioredoxin homologue in hepatocellular carcinoma. Cancer 69:2091–2097 [DOI] [PubMed] [Google Scholar]
- Oblong JE, Berggren M, Gasdaska PY, Powis G 1994 Site-directed mutagenesis of active site cysteines in human thioredoxin produces competitive inhibitors of human thioredoxin reductase and elimination of mitogenic properties of thioredoxin. J Biol Chem 269:11714–11720 [PubMed] [Google Scholar]
- Kobayashi F, Sagawa N, Nanbu Y, Kitaoka Y, Mori T, Fujii S, Nakamura H, Masutani H, Yodoi J 1995 Biochemical and topological analysis of adult T-cell leukaemia-derived factor, homologous to thioredoxin, in the pregnant human uterus. Hum Reprod 10:1603–1608 [DOI] [PubMed] [Google Scholar]
- Perkins AV, Di Trapani G, McKay MS, Clarke FM 1995 Immunocytochemical localization of thioredoxin in human trophoblast and decidua. Placenta 16:635–642 [DOI] [PubMed] [Google Scholar]
- Di Trapani G, Perkins A, Clarke F 1998 Production and secretion of thioredoxin from transformed human trophoblast cells. Mol Hum Reprod 4:369–375 [DOI] [PubMed] [Google Scholar]
- Clarke FM, Orozco C, Perkins AV, Cock I, Tonissen KF, Robins AJ, Wells JR 1991 Identification of molecules involved in the ‘early pregnancy factor’ phenomenon. J Reprod Fertil 93:525–539 [DOI] [PubMed] [Google Scholar]
- Natsuyama S, Noda Y, Narimoto K, Umaoka Y, Mori T 1992 Release of two-cell block by reduction of protein disulfide with thioredoxin from Escherichia coli in mice. J Reprod Fertil 95:649–656 [DOI] [PubMed] [Google Scholar]
- Fujii S, Nanbu Y, Konishi I, Mori T, Masutani H, Yodoi J 1991 Immunohistochemical localization of adult T-cell leukaemia-derived factor, a human thioredoxin homologue, in human fetal tissues. Virchows Arch A Pathol Anat Histopathol 419:317–326 [DOI] [PubMed] [Google Scholar]
- Matsui M, Oshima M, Oshima H, Takaku K, Maruyama T, Yodoi J, Taketo MM 1996 Early embryonic lethality caused by targeted disruption of the mouse thioredoxin gene. Dev Biol 178:179–185 [DOI] [PubMed] [Google Scholar]
- Sahlin L, Stjernholm Y, Holmgren A, Ekman G, Eriksson H 1997 The expression of thioredoxin mRNA is increased in the human cervix during pregnancy. Mol Hum Reprod 3:1113–1117 [DOI] [PubMed] [Google Scholar]
- Ejima K, Nanri H, Toki N, Kashimura M, Ikeda M 1999 Localization of thioredoxin reductase and thioredoxin in normal human placenta and their protective effect against oxidative stress. Placenta 20:95–101 [DOI] [PubMed] [Google Scholar]
- Takagi Y, Mitsui A, Nishiyama A, Nozaki K, Sono H, Gon Y, Hashimoto N, Yodoi J 1999 Overexpression of thioredoxin in transgenic mice attenuates focal ischemic brain damage. Proc Natl Acad Sci USA 96:4131–4136 [DOI] [PMC free article] [PubMed] [Google Scholar]
- Toyokuni S, Tanaka T, Hattori Y, Nishiyama Y, Yoshida A, Uchida K, Hiai H, Ochi H, Osawa T 1997 Quantitative immunohistochemical determination of 8-hydroxy-2′-deoxyguanosine by a monoclonal antibody N45.1: its application to ferric nitrilotriacetate-induced renal carcinogenesis model. Lab Invest 76:365–374 [PubMed] [Google Scholar]
- Liang Z, Wu H, Reddy S, Zhu A, Wang S, Blevins D, Yoon Y, Zhang Y, Shim H 2007 Blockade of invasion and metastasis of breast cancer cells via targeting CXCR4 with an artificial microRNA. Biochem Biophys Res Commun 363:542–546 [DOI] [PubMed] [Google Scholar]
- Ishikawa H, Seki R, Yokonishi S, Yamauchi T, Yokoyama K 2006 Relationship between fetal weight, placental growth and litter size in mice from mid- to late-gestation. Reprod Toxicol 21:267–270 [DOI] [PubMed] [Google Scholar]
- Burdon C, Mann C, Cindrova-Davies T, Ferguson-Smith AC, Burton GJ 2007 Oxidative stress and the induction of cyclooxygenase enzymes and apoptosis in the murine placenta. Placenta 28:724–733 [DOI] [PMC free article] [PubMed] [Google Scholar]
- Casanueva E, Viteri FE 2003 Iron and oxidative stress in pregnancy. J Nutr 133(Suppl 2):1700S–1708S [DOI] [PubMed] [Google Scholar]
- Halliwell B, Gutteridge JM 1990 Role of free radicals and catalytic metal ions in human disease: an overview. Methods Enzymol 186:1–85 [DOI] [PubMed] [Google Scholar]
- McCord JM 2000 The evolution of free radicals and oxidative stress. Am J Med 108:652–659 [DOI] [PubMed] [Google Scholar]
- Redman CW, Sargent IL 2000 Placental debris, oxidative stress and pre-eclampsia. Placenta 21:597–602 [DOI] [PubMed] [Google Scholar]
- Ames BN 1989 Endogenous oxidative DNA damage, aging, and cancer. Free Radic Res Commun 7:121–128 [DOI] [PubMed] [Google Scholar]
- Kuchino Y, Mori F, Kasai H, Inoue H, Iwai S, Miura K, Ohtsuka E, Nishimura S 1987 Misreading of DNA templates containing 8-hydroxydeoxyguanosine at the modified base and at adjacent residues. Nature 327:77–79 [DOI] [PubMed] [Google Scholar]
- Kakimoto M, Inoguchi T, Sonta T, Yu HY, Imamura M, Etoh T, Hashimoto T, Nawata H 2002 Accumulation of 8-hydroxy-2′-deoxyguanosine and mitochondrial DNA deletion in kidney of diabetic rats. Diabetes 51:1588–1595 [DOI] [PubMed] [Google Scholar]
- Nakamura H, Nakamura K, Yodoi J 1997 Redox regulation of cellular activation. Annu Rev Immunol 15:351–369 [DOI] [PubMed] [Google Scholar]
- Tanaka T, Nishiyama Y, Okada K, Hirota K, Matsui M, Yodoi J, Hiai H, Toyokuni S 1997 Induction and nuclear translocation of thioredoxin by oxidative damage in the mouse kidney: independence of tubular necrosis and sulfhydryl depletion. Lab Invest 77:145–155 [PubMed] [Google Scholar]
- Ueno M, Masutani H, Arai RJ, Yamauchi A, Hirota K, Sakai T, Inamoto T, Yamaoka Y, Yodoi J, Nikaido T 1999 Thioredoxin-dependent redox regulation of p53-mediated p21 activation. J Biol Chem 274:35809–35815 [DOI] [PubMed] [Google Scholar]
- Shioji K, Matsuura Y, Iwase T, Kitaguchi S, Nakamura H, Yodoi J, Hashimoto T, Kawai C, Kishimoto C 2002 Successful immunoglobulin treatment for fulminant myocarditis and serial analysis of serum thioredoxin: a case report. Circ J 66:977–980 [DOI] [PubMed] [Google Scholar]
- Okuyama H, Nakamura H, Shimahara Y, Araya S, Kawada N, Yamaoka Y, Yodoi J 2003 Overexpression of thioredoxin prevents acute hepatitis caused by thioacetamide or lipopolysaccharide in mice. Hepatology 37:1015–1025 [DOI] [PubMed] [Google Scholar]
- Li GX, Hirabayashi Y, Yoon BI, Kawasaki Y, Tsuboi I, Kodama Y, Kurokawa Y, Yodoi J, Kanno J, Inoue T 2006 Thioredoxin overexpression in mice, model of attenuation of oxidative stress, prevents benzene-induced hemato-lymphoid toxicity and thymic lymphoma. Exp Hematol 34:1687–1697 [DOI] [PubMed] [Google Scholar]
- Takagi Y, Nikaido T, Toki T, Kita N, Kanai M, Ashida T, Ohira S, Konishi I 2004 Levels of oxidative stress and redox-related molecules in the placenta in preeclampsia and fetal growth restriction. Virchows Arch 444:49–55 [DOI] [PubMed] [Google Scholar]
- Sahlin L, Ostlund E, Wang H, Holmgren A, Fried G 2000 Decreased expression of thioredoxin and glutaredoxin in placentae from pregnancies with pre-eclampsia and intrauterine growth restriction. Placenta 21:603–609 [DOI] [PubMed] [Google Scholar]
- Shibata E, Ejima K, Nanri H, Toki N, Koyama C, Ikeda M, Kashimura M 2001 Enhanced protein levels of protein thiol/disulphide oxidoreductases in placentae from pre-eclamptic subjects. Placenta 22:566–572 [DOI] [PubMed] [Google Scholar]
- Jones C, Rolph T 1985 Metabolism during fetal life: a functional assessment of metabolic development. Physiol Rev 65:357–430 [DOI] [PubMed] [Google Scholar]
- Jones HN, Powell TL, Jansson T 2007 Regulation of placental nutrient transport–a review. Placenta 28:763–774 [DOI] [PubMed] [Google Scholar]
- Yamaguchi M, Sakata M, Ogura K, Miyake A 1996 Gestational changes of glucose transporter gene expression in the mouse placenta and decidua. J Endocrinol Invest 19:567–569 [DOI] [PubMed] [Google Scholar]
- Hahn T, Barth S, Graf R, Engelmann M, Beslagic D, Reul JM, Holsboer F, Dohr G, Desoye G 1999 Placental glucose transporter expression is regulated by glucocorticoids. J Clin Endocrinol Metab 84:1445–1452 [DOI] [PubMed] [Google Scholar]
- Makino Y, Okamoto K, Yoshikawa N, Aoshima M, Hirota K, Yodoi J, Umesono K, Makino I, Tanaka H 1996 Thioredoxin: a redox-regulating cellular cofactor for glucocorticoid hormone action. Cross talk between endocrine control of stress response and cellular antioxidant defense system. J Clin Invest 98:2469–2477 [DOI] [PMC free article] [PubMed] [Google Scholar]
- Makino Y, Yoshikawa N, Okamoto K, Hirota K, Yodoi J, Makino I, Tanaka H 1999 Direct association with thioredoxin allows redox regulation of glucocorticoid receptor function. J Biol Chem 274:3182–3188 [DOI] [PubMed] [Google Scholar]
- Thompson A, Han VK, Yang K 2002 Spatial and temporal patterns of expression of 11β-hydroxysteroid dehydrogenase types 1 and 2 messenger RNA and glucocorticoid receptor protein in the murine placenta and uterus during late pregnancy. Biol Reprod 67:1708–1718 [DOI] [PubMed] [Google Scholar]
- Burton PJ, Smith RE, Krozowski ZS, Waddell BJ 1996 Zonal distribution of 11β-hydroxysteroid dehydrogenase types 1 and 2 messenger ribonucleic acid expression in the rat placenta and decidua during late pregnancy. Biol Reprod 55:1023–1028 [DOI] [PubMed] [Google Scholar]
- Karalis K, Goodwin G, Majzoub JA 1996 Cortisol blockade of progesterone: a possible molecular mechanism involved in the initiation of human labor. Nat Med 2:556–560 [DOI] [PubMed] [Google Scholar]
- Jacobson MD 1996 Reactive oxygen species and programmed cell death. Trends Pharmacol Sci 21:83–86 [PubMed] [Google Scholar]
- Sonenshein GE 1997 Rel/NF-κB transcription factors and the control of apoptosis. Semin Cancer Biol 8:113–119 [DOI] [PubMed] [Google Scholar]
- Karin M, Liu Z, Zandi E 1997 AP-1 function and regulation. Curr Opin Cell Biol 9:240–246 [DOI] [PubMed] [Google Scholar]
- Levy R, Smith SD, Yusuf K, Huettner PC, Kraus FT, Sadovsky Y, Nelson DM 2002 Trophoblast apoptosis from pregnancies complicated by fetal growth restriction is associated with enhanced p53 expression. Am J Obstet Gynecol 186:1056–1061 [DOI] [PubMed] [Google Scholar]
- Jurisicova A, Detmar J, Caniggia I 2005 Molecular mechanisms of trophoblast survival: from implantation to birth. Birth Defects Res C Embryo Today 75:262–280 [DOI] [PubMed] [Google Scholar]
- Levy R, Smith SD, Chandler K, Sadovsky Y, Nelson DM 2000 Apoptosis in human cultured trophoblasts is enhanced by hypoxia and diminished by epidermal growth factor. Am J Physiol Cell Physiol 278:C982–C988 [DOI] [PubMed] [Google Scholar]


