Abstract
Thermoplasma acidophilum HO-62 was grown at different pHs and temperatures, and its polar lipid compositions were determined. Although the number of cyclopentane rings in the caldarchaeol moiety increased when T. acidophilum was cultured at high temperature, the number decreased at low pHs. Glycolipids, phosphoglycolipids, and phospholipids were analyzed by high-performance liquid chromatography with an evaporative light-scattering detector. The amount of caldarchaeol with more than two sugar units on one side increased under low-pH and high-temperature conditions. The amounts of glycolipids increased and those of phosphoglycolipids decreased under these conditions. The proton permeability of the liposomes obtained from the phosphoglycolipids that contained two or more sugar units was lower than that of the liposomes obtained from the phosphoglycolipids that contained one sugar unit. From these results, we propose the hypothesis that T. acidophilum adapts to low pHs and high temperatures by extending sugar chains on their cell surfaces, as well as by varying the number of cyclopentane rings.
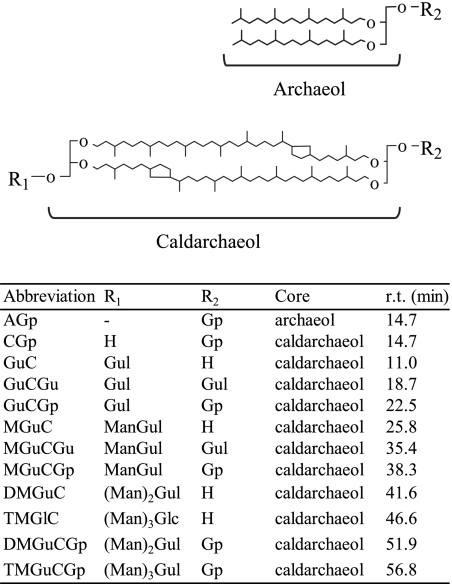
Archaea have unique plasma membranes made of isoprenoid glycerol ether (14, 19). The isoprenoid chains of archaeal membrane lipids consist of the hydrocarbons C20, C25, and C40. The C20 and/or C25 chain is linked to glycerol to form 2,3-di-O-alkyl-sn-glycerol diether (archaeol and its variants [10, 20]), and the C40 (biphytanyl) chains are connected to two glycerols to form dibiphytanyl diglyceryl tetraether (caldarchaeol [10, 19, 22]), as shown in Fig. 1. Other analogues (e.g., macrocyclic archaeol and glycerol-trialkyl-glycerol tetraether) have also been reported (7, 12). Various archaeal lipid structures have been summarized by Koga and Morii (21). The basic structure of an ether lipid in a hydrocarbon chain consisting of branched C5 units attached to glycerol by an ether linkage is conserved in archaea. Because of the unique structural features of archaeal lipids, the properties of the membrane consisting of these lipids have been compared with those of the widely distributed ester-type lipids consisting of fatty acids and glycerol (2, 6, 23).
FIG. 1.
Structures of polar lipids found in T. acidophilum HO-62 (26). In the far right column, the HPLC retention times (r.t.) of the polar lipids obtained under the conditions described in Materials and Methods are shown. H, Gp, Gul, Man, and Glc represent the proton, glycerophosphate, gulose, mannose and glucose, respectively. Abbreviations of the polar lipids used are as follows: AGp, archaetidylglycerol; CGp, caldarchaetidylglycerol; GuC, gulopyranosyl-(β1-1)-caldarchaeol; GuCGu, gulopyranosyl-(β1-1)-(gulopyranosyl-(β1′-1′)-)-caldarchaeol; GuCGp, gulopyranosyl-(β1-1)-caldarchaetidylglycerol; MGuC, mannopyranosyl-(α1-3)-gulopyranosyl-(β1-1)-caldarchaeol; MGuCGu, mannopyranosyl-(α1-3)-gulopyranosyl-(β1-1)-(gulopyranosyl-(β1′-1′)-)-caldarchaeol; MGuCGp, mannopyranosyl-(α1-3)-gulopyranosyl-(β1-1)-caldarchaetidylglycerol; DMGuC, mannopyranosyl-(α1-3)-mannopyranosyl-(α1-3)-gulopyranosyl-(β1-1)-caldarchaeol; DMGuCGp, mannopyranosyl-(α1-3)-mannopyranosyl-(α1-3)-gulopyranosyl-(β1-1)-caldarchaetidylglycerol; TMGlC, trimannopyranosylglucosylcaldarchaeol; TMGuCGp, mannopyranosyl-(α1-3)-(mannopyranosyl)2-(α1-3)-gulopyranosyl-(β1-1)-caldarchaetidylglycerol. The number of cyclopentane rings in a caldarchaeol molecule varies from zero to six.
The function of glycolipids is generally considered to be the stabilization of the membrane against environmental stresses such as osmotic stress and temperature alterations, through hydrogen bonding via glycosyl head groups (8). Because the amount of glycolipids increases under elevated growth temperature conditions in the thermophilic eubacterium Thermus aquaticus (25) and the algae Cyanidium caldarium (1), sugar residues were thought to be important for growth under high-temperature conditions. The structural features of polar head groups of archaea have also been discussed in relation to chemotaxonomic purposes (for a review, see reference 14).
Thermoplasma acidophilum is a facultative anaerobic, thermophilic, and acidophilic archaeon which grows optimally at pHs ranging from 1 to 2 and 55 to 59°C. This microorganism does not have a cell wall outside its cell membrane. Previously, we developed an analytical method for determining the structures of several newly discovered polar lipids of T. acidophilum HO-62 (26). The structures and abbreviations of polar lipids of T. acidophilum are listed in Fig. 1. There are two types of core lipids, archaeol and caldarchaeol. Glycolipids have different combinations of gulose, mannose, and glucose, which form mono- or oligosaccharides on one or both sides of caldarchaeol. Phosphoglycolipids with two polar head groups on both sides of the caldarchaeol have glycerophosphate as the phosphoester moiety on one side and gulose alone or gulose and mannose, which form mono- or oligosaccharides as the sugar moieties, on the other side. Both the archaeol and the caldarchaeol types of phospholipids have a glycerophosphate group on one side.
These lipids may contribute to the organisms' adaptation to extremely low pHs and high temperatures. The number of cyclopentane rings in the caldarchaeol moiety in a thermophilic archaeon varies with growth temperature (11, 30, 31). The variation is considered to be an adaptation to different temperatures by adjusting membrane fluidity (15). The investigation of the variations in lipid profiles in archaea grown under different conditions may reveal the responses of polar lipids and determine how archaea can adapt to extreme environments.
The liposome made of polar lipid from T. acidophilum 122-1B3 (ATCC 27658), which contains mainly caldarchaeol as the hydrocarbon core, showed low permeability to protons, water, and some solutes compared to that of the liposome made of lipid from Escherichia coli (23). Bagatolli et al. showed that the liposomes made of archaeal lipid from Sulfolobus acidocaldarius are rigid and tightly packed (3). Since many archaea live in extreme environments, their cells may require particularly tough membranes. These studies are based on the analysis of the physical properties of liposomes and are focused mainly on the hydrocarbon core, although many types of polar head groups have been reported (14, 27).
The analysis of polar head groups from thermophilic and acidophilic archaea has been difficult, because archaeal polar residues are diverse, and residues have portions with unique structures such as those of calditol (28) and gulose. We have shown that archaeal lipids without UV absorbance can be separated and detected using ELSD-HPLC (26). In this study, to determine the contribution of polar lipids to the organism's adaptation to extreme environments, we grew T. acidophilum HO-62 in a medium at different pHs and temperatures. Each polar lipid of T. acidophilum was quantified. The number of cyclopentane rings in caldarchaeol in the lipids of the archaeon grown under different conditions was also determined using ELSD-HPLC. Furthermore, the proton permeability of the liposome obtained from phosphoglycolipids that contained two, three, and four sugar units was compared with that of the liposome obtained from phosphoglycolipids that contained one sugar unit.
MATERIALS AND METHODS
Abbreviations.
EI-MS, electron impact mass spectrometry; ELSD, evaporative light-scattering detector; GC, gas chromatography; HPLC, high-performance liquid chromatography; liquid SIMS, liquid secondary ion mass spectrometry; MS, mass spectrometry; TMS, trimethylsilyl; the legend to Fig. 1 lists abbreviations of the names of polar lipids.
Chemicals.
HPLC grade chloroform and methanol were obtained from Nacalai Tesque, Inc. (Kyoto, Japan). l-Gulose was purchased from Tokyo Chemical Industry Co., Ltd. (Tokyo, Japan). All the other chemicals used were of analytical grade.
Organism and cultivation.
T. acidophilum HO-62 was statically grown at the desired temperatures in 1 liter of the medium described by Yasuda et al. (32); the pH of the medium was adjusted to the desired pHs by using sulfuric acid. Cultivation was repeated three times under each condition. Lipids were extracted from cells from each culture independently.
Extraction of polar lipids.
The polar lipid extraction process using the Bligh and Dyer method (4) was described previously (26). Lyophilized cells were suspended in chloroform-methanol-water (4:1:5 [vol/vol/vol]), and then chloroform-water (1:1 [vol/vol]) was added to the suspension. The lower chloroform phase was collected. The upper aqueous phase, including the fluff layer and the insoluble sediment, was extracted two times with chloroform. The chloroform extracts were pooled and evaporated. The residue was designated TPL1. The aqueous layer was lyophilized. Polar lipids that remained in the lyophilized aqueous layer were reextracted using chloroform-methanol (2:1 [vol/vol]). The reextraction was repeated five times. The pooled solution was evaporated and designated TPL2. The proportions of TPL1 and TPL2 in the total polar lipids were about 75% dry weight and 25% dry weight, respectively.
Separation of polar lipids by ELSD-HPLC.
TPL1 and TPL2 were separately applied to a Capcellpak silica SG80 column (2.0 mm [inside diameter] by 250 mm [length]; 5-μm particle size; Shiseido, Tokyo, Japan) at 35°C, attached to an LC10A HPLC system (Shimadzu, Kyoto, Japan) and were monitored with an Alltech model 500 ELSD (Deerfield, IL). Nebulization was carried out with compressed air at a flow rate of 2.0 liters/min at 80°C. The eluents used were as follows: H1, chloroform; H2, chloroform-methanol-trifluoroacetic acid (50:50:1 [vol/vol/vol]); and H3, chloroform-methanol-trifluoroacetic acid (10:10:1 [vol/vol/vol]). The polar lipids were separated with gradients of H1 and H2, with the program H2 %(min) 0(0)-10(2)-50(42)-100(62), at a flow rate of 0.25 ml/min. After each analysis, the column was washed with H3.
Quantification of polar lipids.
GuCGp, the main polar lipid of T. acidophilum, purified from the total amount of polar lipid from a 50-liter culture (26), was used as the polar lipid standard. GuCGp was diluted, and 10 μl of the appropriate dilution was subjected to ELSD-HPLC. The peak area of GuCGp in the HPLC chromatogram was plotted and used as the standard curve.
Analysis of core lipids.
TPL1 and TPL2 were mixed, and polar lipids were decomposed to methylglycosides and caldarchaeol by acid methanolysis, according to the methods described by Yang and Haug (31). The caldarchaeol remaining in the hexane layer after acid methanolysis was applied directly to the ELSD-HPLC system, as described above. ELSD nebulization was performed with compressed air at a flow rate of 1.6 liters/min at 55°C. An Adsorbosphere NH2 column (2.0 mm [inside diameter] by 250 mm [length]; 3-μm particle size; Alltech, Deerfield, IL) was used, and the column temperature was maintained at 30°C. The eluent used was J1 (n-hexane-1-propanol; 99:1 [vol/vol]). Caldarchaeol samples containing different numbers of cyclopentane rings were separated with J1 at a flow rate of 0.4 ml/min. To identify the HPLC peaks, caldarchaeols were collected by splitting the solvent line before the detector. The mass number of the component in each HPLC fraction was measured by liquid SIMS. Liquid SIMS was performed at an acceleration voltage of 7 keV, using an Autospec E mass spectrometer (Micromass Inc., Manchester, England) equipped with a SIMS probe. Dithiothreitol-dithioerythritol (3:1 [vol/vol]) was used as the matrix.
Biphytanyl chains in caldarchaeol were investigated by GC. Each caldarchaeol collected from the HPLC peaks was decomposed to two biphytanyl alcohols, which were converted to their TMS derivatives and analyzed by GC with a flame ionization detector as described previously (26). Each GC peak was identified by GC-MS using a Hewlett-Packard model HP5890 gas chromatograph (Avondale, PA) attached to an Autospec E mass spectrometer (Micromass Inc., Manchester, England) equipped with an EI-MS probe operated at a 70 eV ionization voltage. The GC procedure is described in the legend to Fig. 3.
FIG. 3.
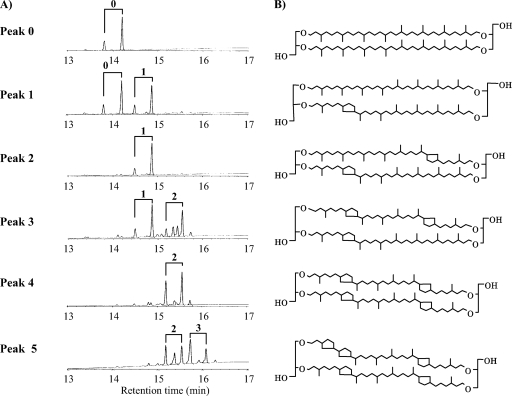
(A) GC chromatograms of TMS derivatives obtained from caldarchaeols corresponding to HPLC peaks shown in Fig. 2. (B) Structures corresponding to caldarchaeols shown in panel A. Caldarchaeols collected from the HPLC peaks in Fig. 2 were decomposed to biphytanyl alcohols and then converted to their TMS derivatives. TMS-biphytanyl alcohols were analyzed by GC using an HP-5ht capillary column (0.3 mm inside diameter by 30 m; thickness of film [df] = 0.1 μm) at a temperature gradient of 200°C to 350°C with an incremental step of 10 degrees/min and monitored with a flame ionization detector. The number of cyclopentane rings in the biphytanyl chains shown in the GC chart was identified previously (26).
Chemical stability of GuCGp.
GuCGp was put into a screw-cap test tube and dried under a flow of nitrogen gas. The residue was overlaid with distilled water adjusted to pH 1.8 with sulfuric acid and incubated at 56°C for 3 days. Lipids were extracted with chloroform-methanol (2:1 [vol/vol]) and analyzed by ELSD-HPLC.
Liposome preparation.
The polar lipid in the TPL2 fraction was applied to a silica gel (Wakogel C200, 100/200 mesh; Wako Pure Chemical Industries, Ltd., Osaka, Japan) column (10 mm [inside diameter] by 100 mm [length]) equilibrated with chloroform. After the elution of low-polarity lipids with chloroform, GuCGP was eluted with chloroform-methanol (3:2 [vol/vol]). GuCCp is a phosphoglycolipid that contains one sugar unit in the structure. The other phosphoglycolipids, named MGuCGp, DMGuCGp, and TMGuCGp, that contain two, three, and four sugar units, respectively, were eluted with methanol. The chloroform-methanol (3:2 [vol/vol]) and methanol fractions were dried with nitrogen gas, dissolved separately in chloroform-methanol (2:1 [vol/vol]), and designated chloroform-methanol fractions (Fr. CM) and methanol fractions (Fr. M), respectively.
Each fraction corresponding to 100 μg of lipid was put into a glass test tube, and valinomycin was added to the solution to make 1 nmol/mg lipid. The solutions were dried with nitrogen gas. A buffer solution containing 2 mM pyranine, 5 mM potassium phosphate (pH 7.0), and 0.1 M potassium chloride was then added to the residue, and the mixture was preheated at 70°C for 30 min to hydrate the lipids. A liposome suspension was prepared by sonication using an ultrasonicator VS-100 machine (Asone, Osaka, Japan) for 2.5 min at 70°C. The size of the liposomes was then adjusted to about 0.1 μm by using a Mini-Extruder (Avanti, Alabaster, AL). The resulting lysate was dialyzed against a pyranine-free buffer (5 mM potassium phosphate and 0.1 M potassium chloride [pH 7.0]). The internal pH of the liposomes was estimated by the method described by Kano and Feneler (18). Standard solutions containing 0.33 μM pyranine, 5 mM potassium phosphate, and 0.1 M potassium chloride at pHs of 5.0, 5.5, 6.0, 7.0, and 7.5 were prepared. The fluorescence of pyranine was measured with an RF-5300PC model (Shimadzu, Kyoto, Japan) spectrophotofluorometer at 50°C in a thermostatted holder. For the calibration curve, the logarithm of the ratios of the emission intensities (I) at 510 nm on excitation at 460 and 400 nm, log (I460 nm/I400 nm), was plotted against the pHs of the standard solutions. The internal pH of the liposomes was estimated from the calibration curve. The liposome suspension was diluted with the buffer (pH 7.0). The diluted liposome suspension (60 μl) was then mixed with the buffer (540 μl) containing 5 mM potassium phosphate and 0.1 M potassium chloride (pH 3.6). Fluorescence was measured for 30 min at 50°C.
RESULTS
Effects of pH and temperature on the number of cyclopentane rings in caldarchaeol of T. acidophilum HO-62.
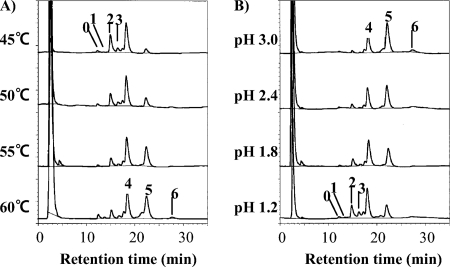
Caldarchaeol obtained from acid methanolysis of the total amount of polar lipid of T. acidophilum HO-62 was analyzed by ELSD-HPLC (Fig. 2). Caldarchaeols containing different numbers of cyclopentane rings were separated by normal phase HPLC (17). Each peak observed in the chromatogram (Fig. 2) was collected and analyzed by MS and GC. The relative masses of the protonated molecular ions ([M+H]+) of the HPLC peaks were measured by liquid SIMS (using a positive ion mode). Peaks 0, 1, 2, 3, 4, 5, and 6, shown in Fig. 2, showed [M+H]+ at m/z ratios of 1,302, 1,300, 1,298, 1,296, 1,294, 1,292, and 1290, respectively. These molecular ion masses agreed well with those of previously identified caldarchaeols that contained zero, one, two, three, four, five, and six cyclopentane rings, respectively (17). Although components with m/z ratios of 1,308, 1,306, and 1,304 were also observed in peaks 4, 5, and 6, respectively, they could not be identified.
FIG. 2.
HPLC chromatograms of caldarchaeols with different numbers of cyclopentane rings, which are indicated beside their respective peaks. The caldarchaeols obtained from the cultures grown at different temperatures at pH 1.8 (A) and at 55°C at different pHs (B) are shown. The analytical conditions shown are described in Materials and Methods.
Liquid SIMS provides only the molecular mass of caldarchaeol; it does not clearly show the number of cyclopentane rings in each biphytanyl chain. To clarify the number of cyclopentane rings in each biphytanyl chain, the caldarchaeol in each HPLC peak was decomposed to biphytanyl alcohols, which were converted to their TMS derivatives. TMS-biphytanyl alcohols were analyzed by GC. The GC profiles and structures of caldarchaeols in the respective HPLC peaks are shown in Fig. 3. The GC peaks have been identified previously (26). Peak 0 contained only the biphytanyl alcohol without cyclopentane rings. Peaks 1, 2, 3, 4, and 5 contained biphytanyl alcohols with zero and one, one and one, one and two, two and two, and two and three cyclopentane rings, respectively. The EI-MS fragment pattern of each TMS-biphytanyl alcohol (data not shown) was similar to that reported previously (31) and consistent with the ring position shown in Fig. 3B. The amounts of caldarchaeols with high numbers of cyclopentane rings increased at high temperatures (Fig. 2A) and at high pHs (Fig. 2B).
Effects of pH and temperature on polar lipid composition in T. acidophilum HO-62.
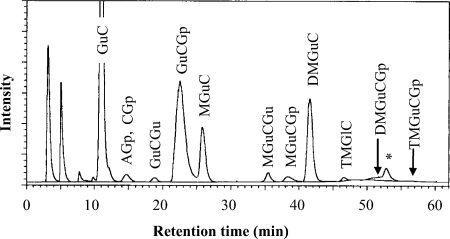
TPL1 and TPL2 extracted from T. acidophilum grown at different pHs and temperatures were analyzed by ELSD-HPLC. A typical chromatogram is shown in Fig. 4. The peaks observed with the chromatogram have been identified previously (26), and the structures of polar lipids are summarized in Fig. 1. The retention time of each component is also listed in Fig. 1. GuCGp, a main polar lipid of T. acidophilum, eluted at 22.5 min. MGuCGp and DMGuCGp, phosphoglycolipids in which one and two mannose residues, respectively are attached to gulose of GuCGp, eluted at 38.3 and 47.3 min, respectively. Polar lipids with more polar residues tended to elute at later times.
FIG. 4.
HPLC chromatogram of TPL1, the chloroform extract obtained from T. acidophilum grown in medium at pH 1.2. Figure 1 shows the abbreviations and structures of the polar lipids. The asterisk (*) indicates the peak of an unknown component. HPLC was performed with a Capcellpak silica SG80 column (2.0 mm [inside diameter] by 250 mm [length]) and monitored by ELSD. The eluents used were H1, chloroform, and H2, chloroform-methanol-trifluoroacetic acid (50:50:1 [vol/vol/vol]). The gradient program was H2 %(min) 0(0)-10(2)-50(42)-100(62) at 35°C at a flow rate of 0.25 ml/min.
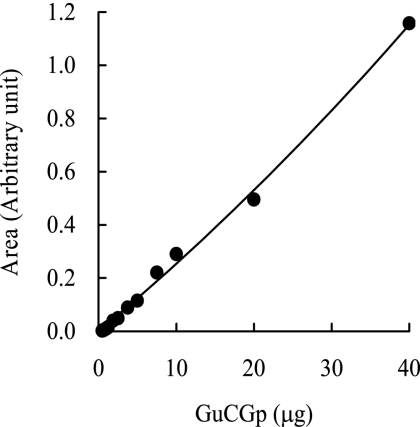
Polar lipids were quantified by using a calibration curve plotted with GuCGp as the standard (Fig. 5). Because the response of ELSD does not depend on the molecular structure but on the number and size of the analyte particles in a drift tube, the response is not expected to depend on the type of analyte (16). The relative deviation of the ELSD signal was 13% when eight different compounds of the same amount were tested, while that of the refractive index detector was 23% (16). The calibration curve obtained from ELSD is not always linear (5, 16), as was the calibration curve obtained in this study (Fig. 5). Glycolipids, phospholipids, and part of phosphoglycolipids were detected in TPL1 obtained from the first extraction using chloroform, methanol, and water. Phosphoglycolipids were found in the TPL2 obtained from the second extraction using chloroform-methanol (2:1 [vol/vol]). Since some lipids were found in both TPL1 and TPL2, the amounts of all the components in TPL1 and TPL2 were added. The weighted percentage of each polar lipid in the cells grown under different conditions is shown in Table 1.
FIG. 5.
Calibration curves for GuCGp. Analytical conditions are described in Materials and Methods. The area under the peak of ELSD-HPLC was plotted against the weight of the standard GuCGp injected.
TABLE 1.
Composition of polar lipids in T. acidophilum HO-62a
| Growth conditionb | % (by wt) of total polar lipids (mean ± SD)c
|
||||||||||
|---|---|---|---|---|---|---|---|---|---|---|---|
| GuCGu | GuCGp | CGp + AGp | GuC | MGuC | MGuCGu | DMGuC | TMGlC | MGuCGp | DMGuCGp | TMGuCGp | |
| pH | |||||||||||
| 3.0 | 6.9 ± 1.7 | 71.2 ± 3.0 | ND | 7.8 ± 1.4 | ND | ND | ND | ND | 3.3 ± 0.8 | 7.4 ± 2.6 | 3.3 ± 3.0d |
| 2.4 | 6.5 ± 0.7 | 69.8 ± 1.8 | ND | 7.6 ± 0.4 | ND | ND | ND | ND | 4.1 ± 1.0 | 7.0 ± 2.1 | 4.9 ± 2.5 |
| 1.8 | 4.7 ± 1.7 | 61.9 ± 3.7 | 2.6 ± 0.8 | 9.5 ± 2.6 | 2.0 ± 0.6 | 2.0 ± 0.7 | 2.4 ± 0.8 | 0.8 ± 0.3 | 5.5 ± 0.9 | 6.3 ± 1.4 | 2.3 ± 2.1d |
| 1.2 | 3.1 ± 0.8 | 36.9 ± 10.5 | 1.0 ± 1.7 | 23.4 ± 3.6 | 6.1 ± 1.9 | 3.1 ± 0.4 | 8.1 ± 3.1 | 1.7 ± 0.2 | 6.8 ± 0.5 | 5.6 ± 0.7 | 4.3 ± 2.1 |
| Temp (°C) | |||||||||||
| 45 | 6.2 ± 2.0 | 63.9 ± 7.3 | 2.8 ± 0.3 | 10.9 ± 1.7 | 1.2 ± 1.1d | 1.0 ± 0.9d | 0.9 ± 0.9d | 0.2 ± 0.4d | 6.8 ± 2.0 | 4.5 ± 2.2 | 1.8 ± 0.5 |
| 50 | 4.7 ± 0.9 | 64.4 ± 2.1 | 2.9 ± 0.4 | 8.9 ± 1.0 | 0.9 ± 0.8d | 1.5 ± 0.1 | 1.5 ± 0.1 | 0.9 ± 1.1d | 6.2 ± 0.6 | 4.9 ± 0.6 | 3.3 ± 1.3 |
| 55 | 4.7 ± 1.7 | 61.9 ± 3.7 | 2.6 ± 0.8 | 9.5 ± 2.6 | 2.0 ± 0.6 | 2.0 ± 0.7 | 2.4 ± 0.8 | 0.8 ± 0.3 | 5.5 ± 0.9 | 6.3 ± 1.4 | 2.3 ± 2.1d |
| 60 | 3.4 ± 0.5 | 54.1 ± 4.1 | 4.5 ± 0.6 | 16.0 ± 3.7 | 4.1 ± 0.6 | 2.1 ± 0.5 | 5.0 ± 0.7 | 0.9 ± 0.7d | 2.9 ± 2.5d | 6.7 ± 0.2 | 0.4 ± 0.7d |
Each value indicates the weighted percentage of each component with respect to the total weight of polar lipids quantified by ELSD-HPLC. Each datum is an average of three independent cultures, consisting of means ± standard deviations (SD). The total amount of polar lipid analyzed in each measurement varied from 20 to 40 μg.
T. acidophilum HO-62 was grown at different pHs at 55°C (Temp) and at pH 1.8 at different temperatures (pH).
ND, all estimates in three independent cultures had values lower than that of the detection limit (less than 1.4% [weighted %]) for GuCGp.
One or two data were below the detection limit and were assumed to be 0 for the calculation of an average.
The amount of the main polar lipid GuCGp was low at low pHs and high temperatures. The amount of GuCGu showed a similar trend. However, the amounts of most of the glycolipids, namely, GuC, MGuC, MGuCGu, DMGuC, and TMGlC, and the sum of the amounts of the phospholipids CGp and AGp were high at low pHs and high temperatures. The other phosphoglycolipids, namely, MGuCGp, DMGuCGp, and TMGuCGp, showed a trend that was different from those of both types.
The general trends in the polar lipid compositions against pH and temperature can be seen in Table 2. The total amount of phosphoglycolipids was low at low pHs and high temperatures, whereas the total amounts of glycolipids and phospholipids were high at low pHs and high temperatures. The relative amounts of the polar lipids with zero to one sugar unit were low at low pHs and high temperatures, whereas those of the polar lipids with two to four sugar units were high under these conditions.
TABLE 2.
Effects of pH and temperature on lipid composition
| Growth conditiona | % (by wt) of lipid type detectedb
|
% (by wt) of lipids withc:
|
Avg no. of cyclopentane ringsd | |||
|---|---|---|---|---|---|---|
| Phospholipid | Glycophospholipid | Glycolipid | 0-1 sugar unit | 2-4 sugar units | ||
| pH | ||||||
| 3.0 | NDe | 85.3 | 14.7 | 86.0 | 14.0 | 5.1 |
| 2.4 | NDe | 85.9 | 14.1 | 83.9 | 16.1 | 4.8 |
| 1.8 | 2.6 | 75.9 | 21.5 | 78.7 | 21.3 | 4.1 |
| 1.2 | 1.0 | 53.6 | 45.4 | 64.4 | 35.6 | 4.0 |
| Temp (°C) | ||||||
| 45 | 2.8 | 76.9 | 20.3 | 83.8 | 16.2 | 3.6 |
| 50 | 2.9 | 78.8 | 18.4 | 80.8 | 19.2 | 3.9 |
| 55 | 2.6 | 75.9 | 21.5 | 78.7 | 21.3 | 4.1 |
| 60 | 4.5 | 64.1 | 31.4 | 77.9 | 22.1 | 4.5 |
The upper section (pH) shows the effects of different pHs of the culture medium at 55°C, and the lower section (Temp) shows the effects of different growth temperatures at pH 1.8.
The polar lipids were divided into three lipid types, phospholipid, glycophospholipid, and glycolipid. Data show weighted percentages of the three types with respect to the total weight of polar lipids, calculated from the data shown in Table 1.
Values show weighted percentages of polar lipids with sugar chain lengths of 0 to 1 and 2 to 4.
The average number of cyclopentane rings in caldarchaeol was calculated as follows: (Area% monocyclic + 2 × area% bicyclic + 3 × area% tricyclic + 4 × area% tetracyclic + 5 × area% pentacyclic + 6 × area% hexacyclic) × 10−2. Area% was estimated from the HPLC peaks shown in Fig. 2. Values were determined from three experiments.
Chemical stability of GuCGp.
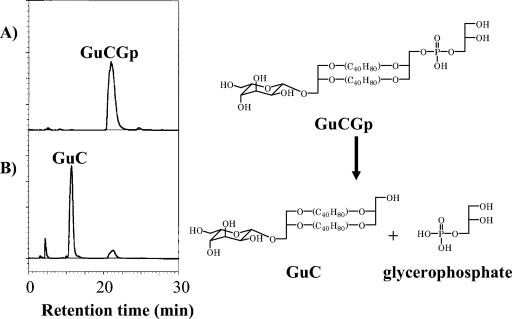
GuCGp was exposed to water adjusted to pH 1.8 with sulfuric acid and incubated at 56°C for 3 days. These are the optimal growth conditions for T. acidophilum HO-62. Since GuCGp has a sugar moiety and a phosphate moiety on both ends of caldarchaeol, the differences in the chemical stabilities of these polar residues can be tested. The HPLC profiles before and after the incubation are shown in Fig. 6. GuCGp was decomposed mainly to GuC under these conditions. A phosphoester linkage was unstable under these conditions, whereas a sugar moiety was stable. The ether linkages in the caldarchaeol were also stable under these conditions.
FIG. 6.
Hydrolysis of GuCGp. The chromatograms were obtained from the GuCGp that was exposed to distilled water adjusted to pH 1.8 and incubated at 56°C for 3 days. Panels A and B show the chromatograms before and after incubation, respectively.
Proton permeability of liposomes.
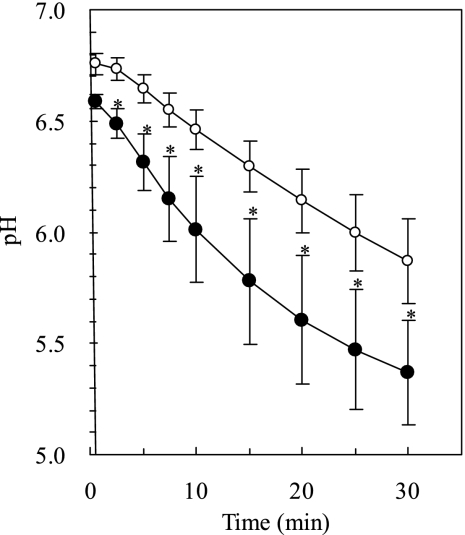
Proton permeability was investigated by monitoring the internal pH of two liposomes made of Fr. CM (consisting of glycophospholipids containing one sugar unit) and Fr. M (consisting of glycophospholipids containing two to four sugar units). After the size of the liposome was adjusted to 0.1 μm, external pyranine of the liposomes was removed by dialysis, using a pyranine-free buffer. Pyranine is a pH-sensitive fluorescence compound. The lipid compositions of Fr. CM and Fr. M before and after the preparation of liposome were investigated using a thin layer chromatography (26). Lipid composition did not change significantly during the preparation of liposome for both liposomes made of Fr. CM and Fr. M (see Fig. S1 in the supplemental material). The calibration curve obtained from the pH standard solutions (pHs 5.0, 5.5, 6.0, 7.0, and 7.5) was linear (y = 0.8011 x = 5.5806, r2 = 0.999). Fluorescence was measured after the liposome suspension was mixed with the buffer at pH 3.6. When the liposome suspension (60 μl; pH 7.0) was mixed with the bulk of the buffer (540 μl; pH 3.6), the solution pH was about 4.6. Figure 7 shows the internal pHs of the liposomes made of Fr. CM and the liposomes made of Fr. M. The internal pHs of the liposomes decreased after the suspension was mixed with the bulk of the buffer. The pH-decreasing speed of the liposomes made of Fr. M was lower than that of the liposomes made of Fr. CM. This result shows that the proton permeability of the liposomes made of phosphoglycolipids that contained two or more sugar units was lower than that of the liposomes made of phosphoglycolipids that contained one sugar unit.
FIG. 7.
Internal pH of liposomes obtained from different phosphoglycolipid fractions. Fluorescence was measured after 60 μl of the liposome suspension (pH 7.0) was mixed with 540 μl of the buffer (pH 3.6). The ratio of emission intensities at 510 nm with excitation at 460 and 400 nm, I460/I400, was plotted. The internal pH of liposomes was estimated from the calibration curve (as described in Results). Closed circles indicate the liposomes obtained from Fr. CM, consisting of GuCGp. Open circles indicate the liposomes obtained from Fr. M, consisting of MGuCGp, DMGuCGp, and TMGuCGp. Each bar indicates the means ± standard deviations (n = 6). Unpaired Student's t test was used to determine the significance between the liposomes made of Fr. CM and Fr. M. Asterisks indicate a significant difference between corresponding data (P < 0.05).
DISCUSSION
The core lipids of archaea consist of archaeol and caldarchaeol as nonpolar moieties. Although there are diversities in the polar head groups among archaeal species, the structures of the hydrocarbon cores of archaea are fundamentally the same. The caldarchaeol of thermophilic archaea contains several cyclopentane rings in two biphytanyl moieties. The cyclopentane rings in caldarchaeol are thought to contribute to the regulation of membrane fluidity, since the number of such rings in Sulfolobus increases with growth temperature (11). The effect of cyclopentane rings in caldarchaeol has been studied by molecular modeling (13). The membrane of caldarchaeol with eight cyclopentane rings was thought to be packed tighter than that of caldarchaeol without cyclopentane rings. The combination of a number of cyclopentane rings in two biphytanyl chains may be important for tight packing. Although Yang and Haug reported that the number of cyclopentane rings in the lipids of T. acidophilum decreases at high growth temperatures (31), Uda et al. reported that it increases at high growth temperatures (30). The numbers of cyclopentane rings obtained from the cells grown under different conditions in this study are summarized in Table 2. The numbers of rings are high at high temperatures, supporting the results reported by Uda et al.; however, they are low at low pHs (at 55°C). The organism's response to extremely low pH is the opposite of that to high temperature. The discrepancy in the results of Yang and Haug (31) might have occurred by an unexpected drop in growth pH as the temperature was increased.
T. acidophilum grows optimally at pH 1 to 2 and at 55 to 59°C. The plasma membrane of T. acidophilum is directly exposed to the extracellular environment owing to the lack of a cell wall. When GuCGp, the main component of lipids of T. acidophilum, was exposed to pH 1.8 and 56°C, the glycerophosphate residue was hydrolyzed but the sugar residue was not (Fig. 6). The ether linkages in caldarchaeol were chemically stable under these conditions, as expected, but the phosphoester linkage was not. Asymmetry of archaeal polar lipids has been investigated in Sulfolobus solfataricus (formerly Caldariella acidophila) (9) and Methanobacterium thermoautotrophicum (24). The sugar moieties of such lipids are outside the cells of these archaea.
To examine the amount of glycolipids under extreme environments, T. acidophilum was grown at different pHs and temperatures, and the lipid composition was investigated. The amount of glycolipids was high at low pHs and high temperatures. The number of sugar units of glyco(phospho)lipids increased under these conditions (Table 2). Sugar residues are expected to increase on the membrane surface. The proton permeability of the liposomes obtained from Fr. M was lower than that of the liposomes obtained from Fr. CM. Because the Fr. M liposomes contain phosphoglycolipids with longer sugar chains than those of Fr. CM, these lipids are thought to have higher resistance to proton permeability when a membrane is formed.
Although gulose is an unusual sugar in nature, it is the main component of polar lipids of T. acidophilum (29). Gulose, which is directly attached to the caldarchaeol part, was found in most glycolipids in this organism. A low amount of glucose that is also directly attached to caldarchaeol was found in the polar lipids. The ratio of glucose/gulose in the polar lipids was maintained at about 0.1 at the different pHs and temperatures tested (data not shown). The reason a large quantity of gulose is presented in polar lipids of T. acidophilum remains unknown. The lateral diffusion coefficient of liposome membranes made of glycolipids is lower than that of membranes made of phospholipids (2). This was thought to be due to the lateral hydrogen bond network of sugar head groups (2). The sugar chains of lipids of T. acidophilum may also interact with each other via hydrogen bonding. The network with increased sugar units of polar lipids at low pHs may have decreased membrane fluidity. The number of cyclopentane rings may have decreased to increase membrane fluidity at low pHs and to counteract the effect of an increased amount of sugar moieties.
Glycolipids of T. acidophilum are expected to protect the membrane from chemically unstable conditions. It is considered that T. acidophilum can adapt to extreme environments by extending the sugar chains on the cells' surfaces. Because the total number of sugar units is high at low pHs and high temperatures, sugar units have to be added to lipids under these conditions. However, no enzyme directly participating in this process and its regulation has yet been reported. Further investigation is needed to elucidate the adaptation of T. acidophilum to low pH.
In conclusion, the number of sugar units of glyco(phospho)-lipids increased under low pHs and high temperatures in T. acidophilum. Liposomes made of phosphoglycolipids that contain two or more sugar units showed lower proton permeability than those made of phosphoglycolipids that contain one sugar unit. From these results, we propose the hypothesis that T. acidophilum cells adapt to low pH and high temperature by increasing the number of sugar units in their glyco(phospho)lipids.
Supplementary Material
Footnotes
Published ahead of print on 6 June 2008.
Supplemental material for this article may be found at http://jb.asm.org/.
REFERENCES
- 1.Adams, B. L., V. McMahon, and J. Seckbach. 1971. Fatty acids in the thermophilic alga, Cyanidium caldarium. Biochem. Biophys. Res. Commun. 42359-365. [DOI] [PubMed] [Google Scholar]
- 2.Baba, T., H. Minamikawa, M. Hato, and T. Handa. 2001. Hydrogen and molecular motions in synthetic phytanyl-chained glycolipid vesicle membranes. Biophys. J. 813377-3386. [DOI] [PMC free article] [PubMed] [Google Scholar]
- 3.Bagatolli, L., E. Gratton, T. K. Khan, and P. L.-G. Chong. 2000. Two-photon fluorescence microscopy studies of bipolar tetraether giant liposomes from thermoacidophilic archaebacteria Sulfolobus acidocaldarius. Biophys. J. 79416-425. [DOI] [PMC free article] [PubMed] [Google Scholar]
- 4.Bligh, E. G., and W. J. Dyer. 1959. A rapid method of total lipid extraction and purification. Can. J. Biochem. Physiol. 37911-917. [DOI] [PubMed] [Google Scholar]
- 5.Charlesworth, J. M. 1978. Evaporative analyzer as a mass detector for liquid chromatography. Anal. Chem. 501414-1420. [Google Scholar]
- 6.Choquet, C. G., G. B. Patel, and G. D. Sprott. 1996. Heat sterilization of archaeal liposomes. Can. J. Microbiol. 42183-186. [Google Scholar]
- 7.Comita, P. B., R. B. Gagosian, H. Pang, and C. E. Costello. 1984. Structural elucidation of unique macrocyclic membrane lipid from a new, extremely thermophilic, deep-sea hydrothermal vent archaebacterium, Methanococcus jannaschii. J. Biol. Chem. 25915234-15241. [PubMed] [Google Scholar]
- 8.Curatolo, W. 1987. Glycolipid function. Biochim. Biophys. Acta 906137-160. [DOI] [PubMed] [Google Scholar]
- 9.de Rosa, M., A. Gambacorta, and B. Nicolaus. 1983. A new type of cell membrane, in thermophilic archaebacteria, based on bipolar ether lipids. J. Membr. Sci. 16287-294. [Google Scholar]
- 10.de Rosa, M., and A. Gambacorta. 1986. Lipid biogenesis in archaebacteria. Syst. Appl. Microbiol. 7278-285. [Google Scholar]
- 11.de Rosa, M., E. Esposito, A. Gambacorta, B. Nicolaus, and J. D. Bu'Lock. 1980. Effect of temperatures on ether lipid composition of Caldariella acidophila. Phytochemistry 19827-831. [Google Scholar]
- 12.de Rosa, M., and A. Gambacorta. 1988. The lipids of archaebacteria. Prog. Lipid Res. 27153-175. [DOI] [PubMed] [Google Scholar]
- 13.Gabriel, J. L., and L. G. C. Parkson. 2000. Molecular modeling of archaebacterial bipolar tetraether lipid membranes. Chem. Phys. Lipids 105193-200. [DOI] [PubMed] [Google Scholar]
- 14.Gambacorta, A., A. Trincone, B. Nicolaus, L. Lama, and M. de Rosa. 1994. Unique features of lipids of archaea. Syst. Appl. Microbiol. 16518-527. [Google Scholar]
- 15.Gliozzi, A., A. Relini, and P. L.-G. Chong. 2002. Structure and permeability properties of biomimetic membranes of bolaform archaeal tetraether lipids. J. Membr. Sci. 206131-147. [Google Scholar]
- 16.Hopia, A. I., and V.-M. Ollilainen. 1993. Comparison of evaporative light scattering detector (ELSD) and refractive index detector (RID) in lipid analysis. J. Liq. Chromatogr. 162469-2482. [Google Scholar]
- 17.Hopmans, E. C., S. Schouten, R. D. Pancost, M. T. J. van der Meer, and J. S. S. Damsté. 2000. Analysis of intact tetraether lipids in archaeal cell material and sediments by high performance liquid chromatography/atmospheric pressure chemical ionization mass spectrometry. Rapid Commun. Mass Spectrom. 14585-589. [DOI] [PubMed] [Google Scholar]
- 18.Kano, K., and J. H. Feneler. 1978. Pyranine as a sensitive pH probe for liposome interiors and surfaces. Biochim. Biophys. Acta 509289-299. [DOI] [PubMed] [Google Scholar]
- 19.Kates, M. 1993. Membrane lipids of archaea, p. 261-295. In M. Kates, D. J. Kushner, and A. T. Matheson (ed.), The biochemistry of archaea, vol. 26. Elsevier, New York, NY. [Google Scholar]
- 20.Kates, M., L. S. Yengoyan, and P. S. Sastry. 1965. A diether analog of phosphatidyl glycerophosphate in Halobacterium cutirubrum. Biochim. Biophys. Acta 98252-268. [DOI] [PubMed] [Google Scholar]
- 21.Koga, Y., and H. Morii. 2005. Recent advances in structural research on ether lipids from archaea including comparative and physiological aspects. Biosci. Biotechnol. Biochem. 692019-2034. [DOI] [PubMed] [Google Scholar]
- 22.Langworthy, T. A., and J. L. Pond. 1986. Archaeal ether lipids and chemotaxonomy. Syst. Appl. Microbiol. 7253-257. [Google Scholar]
- 23.Matai, J. C., G. D. Sprott, and M. L. Zeidel. 2001. Molecular mechanisms of water and solute transport across archaebacterial lipid membranes. J. Biol. Chem. 27627266-27271. [DOI] [PubMed] [Google Scholar]
- 24.Morii, H., and Y. Koga. 1994. Asymmetrical topology of diether- and tetraether-type polar lipids in membrane of Methanobacterium thermoautotrophicum cells. J. Biol. Chem. 26910492-10497. [PubMed] [Google Scholar]
- 25.Ray, P. H., D. C. White, and T. D. Brock. 1971. Effect of growth temperature on lipid composition on Thermus aquaticus. J. Bacteriol. 108227-235. [DOI] [PMC free article] [PubMed] [Google Scholar]
- 26.Shimada, H., Y. Shida, N. Nemoto, T. Oshima, and A. Yamagishi. 2002. Complete polar lipid composition of Thermoplasma acidophilum HO-62 determined by high-performance liquid chromatography with evaporative light-scattering detection. J. Bacteriol. 184556-563. [DOI] [PMC free article] [PubMed] [Google Scholar]
- 27.Sprott, G. D. 1992. Structures of archaebacterial membrane lipids. J. Bioenerg. Biomembr. 24555-566. [DOI] [PubMed] [Google Scholar]
- 28.Sugai, A., R. Sakuma, I. Fukuda, N. Kurosawa, Y. H. Itoh, K. Kon, S. Ando, and T. Itoh. 1995. The structure of the core polyol of the ether lipids from Sulfolobus acidocaldarius. Lipids 30339-344. [DOI] [PubMed] [Google Scholar]
- 29.Swain, M., J. R. Brisson, G. D. Sprott, F. P. Cooper, and G. B. Patel. 1997. Identification of β-l-gulose as the sugar moiety of the main polar lipid of Thermoplasma acidophilum. Biochim. Biophys. Acta 134556-64. [DOI] [PubMed] [Google Scholar]
- 30.Uda, I., A. Sugai, Y. H. Itoh, and T. Itoh. 2001. Variation in molecular species of polar lipids from Thermoplasma acidophilum depends on growth temperature. Lipids 36103-105. [DOI] [PubMed] [Google Scholar]
- 31.Yang, L. L., and A. Haug. 1979. Structure of membrane lipids and physico-biochemical properties of the plasma membrane from Thermoplasma acidophilum, adapted to growth at 37°C. Biochim. Biophys. Acta 573308-320. [DOI] [PubMed] [Google Scholar]
- 32.Yasuda, M., H. Oyaizu, A. Yamagishi, and T. Oshima. 1995. Morphological variation of new Thermoplasma acidophilum isolates from Japanese hot springs. Appl. Environ. Microbiol. 613482-3485. [DOI] [PMC free article] [PubMed] [Google Scholar]
Associated Data
This section collects any data citations, data availability statements, or supplementary materials included in this article.


