

Abstract
As much as a quarter of the human genome has been reported to vary in copy number between individuals, including regions containing about half of the members of the olfactory receptor (OR) gene family. We have undertaken a detailed study of copy-number variation of ORs to elucidate the selective and mechanistic forces acting on this gene family and the true impact of copy-number variation on human OR repertoires. We argue that the properties of copy-number variants (CNVs) and other sets of large genomic regions violate the assumptions of statistical methods that are commonly used in the assessment of gene enrichment. Using more appropriate methods, we provide evidence that OR enrichment in CNVs is not due to positive selection but is because of OR preponderance in segmentally duplicated regions, which are known to be frequently copy-number variable, and because purifying selection against CNVs is lower in OR-containing regions than in regions containing essential genes. We also combine multiplex ligation-dependent probe amplification (MLPA) and PCR to assay the copy numbers of 37 candidate CNV ORs in a panel of ∼50 human individuals. We confirm copy-number variation of 18 ORs but find no variation in this human-diversity panel for 16 other ORs, highlighting the caveat that reported intervals often overrepresent true CNVs. The copy-number variation we describe is likely to underpin significant variation in olfactory abilities among human individuals. Finally, we show that both homology-based and homology-independent processes have played a recent role in remodeling the OR family.
Introduction
A first step in the perception of smells is recognition of odorants by olfactory receptors, or odorant receptors (ORs). ORs are seven-transmembrane G protein-coupled receptors that are expressed in the nasal olfactory epithelium.1 ORs comprise one of the largest gene families in mammalian genomes, with ∼400 apparently functional members in the human genome2,3 and ∼1200 apparently functional members in mice.4,5 An exquisite yet mysterious transcriptional regulatory regime ensures that each neuron in the olfactory epithelium expresses only a single allele of a single member of the OR gene family.6–8 The axons of neurons that have chosen to express the same OR gene converge in the olfactory bulb of the brain,9 thus allowing integration of signals elicited in functionally identical neurons and highly sensitive odorant detection. It has been difficult to comprehensively determine the odorant ligands that activate each OR, but from initial studies, it is clear that a combinatorial code operates, whereby one receptor type can respond to several different odorant molecules (perhaps with varying affinities) and a single odorous compound can be recognized by a number of different receptor types.8 This combinatorial coding regime allows the detection and discrimination of far more odorant molecules than the number of distinct receptors in the genome, explaining how humans can detect thousands of odorants despite possessing only ∼400 distinct functional OR genes. In this study, we investigate human genotypic variation in functional OR repertoire size. This variation could explain some of the observed phenotypic variation in our sense of smell.
In addition to containing apparently functional ORs, the gene family also contains many members that have acquired inactivating mutations, rendering them pseudogenes.2 The proportion of the OR family that appears functional differs greatly among species, with about 50% in human and chimp,10 70% in rat,11 and 80% in mouse and dog.5,12 The proportion of intact ORs is also known to vary between human individuals, because at least 26 OR genes are known “segregating pseudogenes,” containing single-nucleotide polymorphisms (SNPs) in which one allele encodes an apparently functional product and the other encodes a pseudogene.13 The relatively low proportion of intact genes among human ORs and those of other primates as compared to rodents and dogs suggests that selective pressure to maintain a large functional repertoire is less strong in primates than in dogs and rodents. Several investigators have speculated that acquisition of trichromatic vision contributed to the declining importance of olfaction in primate ecology.14–16 Here, we examine the selective pressures acting on copy-number variation in the human OR repertoire.
Mammalian OR genes are arranged in a number of genomic clusters that arose via numerous tandem duplications, as well as less frequent interchromosomal duplications, that seeded new clusters.2,5 The human genome contains ∼100 OR clusters, containing between one and 105 genes. Some human ORs have multiplied to relatively high copy number as part of a recent burst of segmental duplications (SDs) in the human genome,17 including several ORs in subtelomeric regions18 and pericentromeric regions,5 as well as a large number of members of the 7E subfamily of OR pseudogenes.2,19 Comparative genomic analyses of mammalian OR repertoires show that duplications and deletions that occurred after the divergence of various lineages explain the varying repertoire sizes of different species,3,5,20 a mode of evolution known as birth-and-death evolution.21
Each genetic difference between species initially arose in the genome of a single individual and went through a period of polymorphism before becoming fixed in the population, either by genetic drift or through the action of selection.22 It is therefore likely that the same duplication and deletion processes that have altered the OR family over the course of mammalian evolution are still at work today, resulting in OR repertoires that vary between members of a single species, with the likely phenotypic consequence of interindividual variation in olfactory abilities. Indeed, we previously showed that several subtelomeric ORs are polymorphic in both copy number and genomic location in the human population.18,23 Furthermore, numerous studies that report copy-number-variable regions in the human genome include many intervals that contain OR genes (e.g.,24–26). Some studies report that genes involved in chemosensory perception are statistically significantly enriched in copy-number variant (CNV) regions.26–28 These whole-genome studies used microarray technology, SNP data, and high-throughput sequencing methods to identify thousands of regions, spread throughout the human genome, that contain deletions or duplications of several kilobases of DNA sequence in some individuals but not in others; these polymorphisms are known as copy-number variants.
We undertook a detailed study of OR-containing candidate CNVs in order to answer the following questions: Does OR enrichment in CNVs remain statistically significant after genomic clustering of ORs is accounted for? Is OR enrichment in CNVs merely a consequence of the fact that about a quarter of ORs reside in segmental duplications, regions that are themselves enriched in CNVs?29,30 Can copy-number-variation data provide evidence for selective pressures on OR genes? Are ORs that are reported in candidate CNVs in genome-wide studies truly variable in copy number? Do reported OR-containing CNVs represent genomic deletions or duplications? What is the true range of functional OR repertoire size in the human population? And, lastly, what is the mechanism of the mutational events that result in OR copy-number variation?
Material and Methods
CNV, Segmental Duplication, OR and V1R Data Sets
We obtained a set of 29,107 candidate copy-number-variable regions (CNVRs) (after excluding inversions) and their coordinates in NCBI's Build 36.1 of the human genome assembly from the Database of Genomic Variants (The Centre for Applied Genomics, The Hospital for Sick Children, University of Toronto, updated Nov. 29th, 2007).31 Many variants in this data set overlap one another, so we condensed the data set to a nonredundant collection of 15,376 candidate CNVRs with custom perl scripts. Segmental-duplication coordinates17 were obtained through the UCSC Genome Browser.
We identified the coordinates of OR and vomeronasal receptor family 1 (V1R) genes in the human genome assembly (NCBI Build 36.1) or in alternative genomic-sequence sources with the use of previously described procedures.5,32 Our previous V1R study involved manual elimination of sequences that matched V1Rs very poorly; we modified the procedure to allow automated elimination of such sequences. Our modifications consisted of (1) using RepeatMasker with default settings (in addition to our usual run with the −nolow setting) and eliminating candidate V1Rs that fall entirely within a repeat and (2) eliminating any candidate V1R without a BLAST match of E > 10−5 in the NR protein database. The remaining 116 candidate V1Rs had a BLAST match of at least E = 10−5 that contained either “pheromone,” “vomeronasal,” or “V1R” in the description, implying that filtering was successful. An acedb database was used to help track relationships between OR and V1R genes and CNVRs.33
We also determined the officially approved “HORDE” names for each of the identified OR genes by performing a BLAST search of each sequence to the HORDE database (kindly supplied in fasta format by Tsviya Olender, Weizmann Institute). In ambiguous cases in which more than one HORDE gene was identical to an OR that we found, we matched genomic coordinates to choose the correct gene name. In some cases, our assignment of a gene as intact or disrupted (pseudogene) disagreed with the HORDE assignment—analysis of these cases is provided in Table S1 (available online). One such case, OR56B2, is one of the genes we found to be copy-number polymorphic. HORDE assigns this gene as a pseudogene because it is missing a start codon in the typical place; we assign this gene as intact because it is known that some ORs encode the start codon in an upstream exon,23 so that lack of a start codon in the main exon might not be sufficient to call a gene disrupted. We therefore refer to this gene as OR56B2, rather than as OR56B2P. Two V1R genes previously described as intact appear to be pseudogenes in the reference assembly, as discussed in detail elsewhere.32
Simulation Studies
In order to determine the approximate statistical significance of OR enrichment in CNVRs and the number of ORs expected in CNVRs by chance (Table 1), we simulated 5000 data sets of genomic regions with the same characteristics as the real CNVR data set. A single simulated data set was generated as follows, and the entire process was repeated 5000 times. First, we sorted the sizes of the real CNVRs in descending order. We then imagined an artificial genome, consisting of one copy of each chromosome, in an order that we shuffled randomly before generating each of the 5000 simulated data sets. Each chromosome's length reflects its length in the Build 36.1 genome assembly. A single imaginary, linear genome was formed by joining of all chromosomes laid end-to-end. A large number of possible start positions were picked randomly within that single imaginary genome, with the use of the runif function of R to sample from a uniform distribution, rounding positions to the nearest base pair. Next, we paired a randomly chosen start position with the size of the largest real region and generated start and end coordinates of that simulated region within the single linear genome. If the simulated region spanned one or more boundaries between chromosomes in the artificial single genome, we converted the coordinates of the region to two or more smaller regions that together span the same parts of the artificial genome as the larger region, split at chromosome boundaries (a possible alternative strategy of rejecting regions spanning more than one chromosome would bias simulated regions away from chromosome ends). We continued by pairing another randomly chosen start position with the size of the next-largest real region. If that simulated region overlapped by any amount with any region(s) previously simulated, new start position(s) were selected until a region was generated that did not overlap with any previously chosen region. We continued until we had simulated nonoverlapping regions corresponding to all real-region sizes and thus had produced a data set of simulated regions with the same characteristics as our real data set in terms of size distribution and total nonoverlapping genomic extent covered.
Table 1.
ORs and V1Rs Are Statistically Significantly Enriched in CNVRs
| No. of Genes in CNVRsa | Mean no. of Genes in Simulated CNVR Sets | Gene Enrichmentb | No. of CNVRs Containing Genes | Mean no. of CNVRs Containing Genes in Simulated Sets | CNVR Enrichmentb | p Valuec | |
|---|---|---|---|---|---|---|---|
| all ORs | 140 (16%) | 28 | 5.00× | 24 | 6 | 4.21× | < 0.0002 |
| intact ORs | 62 (15%) | 13 | 4.67× | 13 | 3 | 4.11× | < 0.0002 |
| OR pseudogenes | 78 (17%) | 15 | 5.30× | 20 | 5 | 4.19× | < 0.0002 |
| ORs in SDs | 77 (36%) | 7 | 11.08× | 19 | 3 | 6.71× | < 0.0002 |
| ORs outside SDs | 63 (10%) | 21 | 2.99× | 10 | 4 | 2.69× | 0.0040 |
| Intact ORs outside SDs | 40 (12%) | 11 | 3.59× | 8 | 3 | 3.05× | 0.0044 |
| OR pseudogenes outside SDs | 23 (8%) | 10 | 2.32× | 9 | 3 | 3.01× | 0.0034 |
| V1Rs | 23 (20%) | 4 | 6.26× | 10 | 2 | 4.60× | < 0.0002 |
| V1Rs in SDs | 14 (29%) | 2 | 8.84× | 7 | 1 | 6.75× | < 0.0002 |
| V1Rs outside SDs | 9 (14%) | 2 | 4.30× | 6 | 1 | 4.38× | 0.0022 |
Number of genes overlapping CNVRs in a data set comprising 453 regions reported by Redon et al.28 in more than one individual, ascertained with high-resolution arrays.
Enrichment levels reflect how many more genes were in CNVRs (or how many more CNVRs contained genes) in the real data set than occurred in the mean of 5000 simulations.
p values reflect the proportion of simulations in which at least as many CNVRs contained genes as were observed in the real data.
Sequence Analysis
To identify possible additional OR-containing candidate CNVs, we performed bioinformatic analyses, as outlined in the text. We used each of the 4121 OR sequences identified from alternative genomic-sequence sources as BLAST queries against the set of ORs that we identified from the Build 36.1 reference genome assembly, and we performed simple filtering of BLAST results to determine that 47 of the alternative-source ORs did not have a match of at least 98% nucleotide identity over at least 95% of the length of the shorter of the two matching sequences and were thus candidate copy-number-variable ORs. Manual inspection revealed that 11 of the “nonmatching” ORs were likely to be derived from poor quality sequence, given that they mapped close to a gap between contigs in the BAC sequence. Another 11 nonmatching ORs had a good match with overall identity percentage below 98% (e.g., the alignment included a single < 50 bp insertion/deletion difference)—these were eliminated from further analysis. At this point, multiple computational tools were used for comparing genomic sequences surrounding the candidate variable ORs to identify possible alternative structural alleles and to examine their breakpoints. These tools included Dotter,34 BLASTZ,35 BLAST,36 CLUSTAL W,37 cross_match, RepeatMasker, and BOXSHADE. For one OR, we found that the absence of a BLAST match was merely due to unusually high sequence divergence of the ORs and did not appear to represent an alternative structural allele. Although this case might represent a set of interesting sequence polymorphisms, it is outside the scope of this study. The remaining nonmatching ORs represent candidate copy-number-variable genes and are further discussed in the text and detailed in Table 2 and Tables S3 and S4.
Table 2.
Summary of Experimentally Validated CNVs and SNPs that Affect Functional Copy Number
| OR(s) Affected | Chr. Location | Description of Alternative Structural Allelesa | Allele Frequencies | Rearrangement Mechanism |
|---|---|---|---|---|
| OR2G6 | 1q44 | - Presumed ancestral, unduplicated (b36.1). OR is in unique sequence flanked by a recent inverted ∼100 kb duplication | 99% | Not determined |
| - Presumed duplicated (MLPA) | 1% | |||
| OR2T11 | 1q44 | - Presumed ancestral, undeleted (b36.1). OR in one arm of recent inverted ∼100 kb duplication (OR deleted from other arm) | 91% | Not determined |
| - Presumed deleted (MLPA) | 9% | |||
| OR51A2 | 11p15.4 | - Undeleted (b36.1) | 72% | NAHR within ORs |
| - 8.6 kb deletion (fosmid AC193108) removes OR51A2 (also noted by Korbel et al.57) | 28% | |||
| OR56B2, OR52N5, OR52N1 | 11p15.4 | - Undeleted (b36.1) | 79% | NHEJ between Alu repeat and OR52N1 |
| - 24.7 kb deletion (fosmid AC193144) removes OR56B2, OR52N5, and half of OR52N1 | 21% | |||
| OR52E8 | 11p15.4 | - Undeleted structural allele (b36.1) also exhibits SNPs that can inactivate OR52E8 (dbSNP: rs12419602 and ss99307947) | Intact 56% Pseud. 37% | NHEJ |
| - 9.5 kb deletion (fosmid AC206475) removes OR52E8 | 7% | |||
| OR4C45 | 11p11.2 | - SNP: TAT | 46% | T→G SNP |
| - SNP: TAG stop codon (dbSNP: rs3898634) | 54% | |||
| OR4C11, OR4P4, OR4S2, OR4V1P, OR4P1P | 11q11 | - Undeleted (b36.1) | 65% | NHEJ, but see text, Figure S1 |
| - Fosmids AC193142 and AC210900 contain complex alternate structure, with four deletions and some inversions (Figure S1) | 35% | |||
| OR8U8, OR8U9, OR8U1 | 11q11 | - Undeleted (Celera) | 88% | NAHR within ORs |
| - 7.6 kb deletion (b36.1) joins parts of OR8U8 and OR8U9, creating hybrid gene OR8U1 | 12% | |||
| OR9G9 | 11q11 | - Undeleted (Celera) | 99% | NAHR outside ORs |
| - 11.1 kb deletion (b36.1) removes OR9G9 | 1% | |||
| OR8G1 | 11q24.2 | - Undeleted (Celera) | 55% | NHEJ between OR and unique sequence |
| - 851 bp deletion (b36.1) near end of OR. SNP on same haplotype also creates premature stop (dbSNP: rs4268525) | 45% | |||
| OR4K2 | 14q11.2 | - Presumed ancestral, unduplicated | 63% | Not determined |
| - Presumed duplicated | 37% | |||
b36.1 indicates reference human genome assembly, NCBI Build 36.1.
DNA Samples
We obtained human BAC CTD1-2361F20 from BAC/PAC Resources (CHORI). Human genomic DNA was purified from lymphoblast cell cultures, obtained from the NIGMS Coriell Cell Repositories (Camden, NJ) or purchased as DNA from the same source. Samples were from 52 individuals of various geographic origins: eight African Pygmies, including three Mbuti (GM10492-4) and five Biaka (GM10469-73); five Middle Eastern Druze (GM11521-5); nine Southeast Asians, including five Melanesians (GM10539-43) and four Cambodians (GM11373, GM11375-7); five South American Indians (Karitiana, GM10965-9); four Central American Indians (Mayan, GM10975-6, GM10978-9); ten African-Americans (GM10731-40); and eleven individuals of European ancestry (GM00893, GM00946, GM01310, GM01805-6, GM01814, GM01953, GM08428, GM09948, GM10534, GM14492).
MLPA Assays and Interpretation
Multiplex ligation-dependent probe amplification (MLPA)38 was performed with the use of custom probes (Table S5) with MRC Holland's EK1 kit, according to the manufacturer's “DNA Detection/Quantification” protocol. We were careful not to include known SNPs near the ligation sites of our MLPA probes because these can interfere with hybridization and ligation.38 Our probe mixes consisted of 0.8 pmol of each half probe plus 7.8 μl SALSA DQ control mix (MRC Holland), diluted to a total volume of 200 μl with TE. Denaturation, hybridization, ligation, and PCR were performed according to protocol, except that samples were placed on ice while probe mix, MLPA buffer, ligation-buffer mix, and polymerase mix (MRC Holland) were added. Completed MLPA reactions were diluted 1:11 in water, and 1 μl of each diluted product was combined with 0.05 μl GeneScan 500 LIZ Size Standard and 10 μl Hi-Di formamide (Applied Biosystems). Products were separated and quantified with the use of an ABI-3730 DNA Analyzer with 2 kV injection voltage and 2 s injection time. GeneMapper 3.7 or 4.0 software (Applied Biosystems) was used to determine peak heights and areas and fragment sizes in base pairs, with the use of a peak window size of 11.
Custom perl and R scripts were used for processing of peak heights, which we found to be a more reliable measure of copy number than peak areas. For each sample we ran, the peak heights for OR probe pairs were normalized in order to enable interindividual comparisons by division of each peak height by the averaged peak-height value for two control genes that should not vary in copy number, EXT1 and EP300. We eliminated a small number of samples for which large peaks (normalized height > 0.2) were observed for any of three DNA quality-control probes provided by MRC Holland (DQ64, DQ70, and DQ76)—when sample DNA quality is high, peaks for these probes are either absent or very small. After these steps, peak heights for each probe were combined across the three replicates for each DNA sample and average and standard-deviation values were calculated. A minority of peaks whose coefficient of variation between triplicate measurements from a single individual (standard deviation / average) exceeded 0.3 were considered unreliable, and the peak in that individual was excluded from further analysis. The final averaged values were then plotted and sorted by peak height to facilitate the assessment of copy-number variation. If variation appeared to be present, samples were manually grouped into individuals with the same allelic state. We investigated the use of statistical methods that could replace this manual analysis step, but we found that with only ∼50 samples and experimental noise, no simple, reliable method exists that could solve this problem. Peak heights were then averaged for all individuals with the same allelic state, and relative copy numbers were inferred by comparing these averages.
Our assay included two probe pairs, each of which we deliberately designed to recognize two almost-identical OR sequences (i.e., in a “normal” diploid individual would recognize four copies), due to the difficulty of finding sequence differences that would enable the design of specific probes. Our intentional use of probes that recognize multiple ORs was not always effective. In one case, a probe pair that recognizes OR51A2 and OR51A4, we efficiently detected a polymorphic deletion (four copies versus three or two). However, in the second case, a probe pair that recognized both OR2A42 and OR2A1, results were ambiguous. No clear grouping of samples into different copy numbers was evident, yet the peak heights for this probe were much more variable among individuals than for most invariant control and OR probe pairs that we have surveyed (coefficient of variation [CV] 0.19, whereas most invariant probes have CV < 0.075). Polymorphic duplications are likely to be present for one or both of these genes, increasing the number of gene copies that this probe pair would recognize to 5, 6, or higher, but experimental noise (which can be worse for some probe pairs than for others) makes it difficult to distinguish groups with different copy numbers when the initial copy number is high (e.g., four copies compared to five would result in a 1:1.25 peak-height ratio, which is more difficult to detect than two copies compared to three; a 1:1.5 ratio).
Interpretation of results for a second probe pair (OR13C2) was also difficult, although the sequence of the reference assembly suggests that the MLPA probes should match only one genomic location. Two samples appear to have lower peak heights than those of the other samples, but the mean peak heights for the two groups of samples do not have the proportions expected for a true copy-number-variable gene (e.g., 1:2, 3:4, etc.). In addition, the main group of samples has a rather variable peak height, suggesting that results for this probe pair are subject to experimental noise.
PCR and Sequencing
PCR was performed with the use of standard protocols, with Biolase DNA Polymerase and buffer (BIOLINE). Primer sequences are given in Table S8. Annealing temperatures and detailed conditions for each reaction will be provided on request. For DNA sequencing, PCR products were purified with Sephacryl S-300 (Amersham Biosciences) and subjected to sequencing, with the use of a custom primer (Table S8), Applied Biosystems' BigDye Terminator v3.1, and an ABI3730, according to the manufacturer's recommendations.
Results
Over 400 Human ORs are Reported to Be Variable in Copy Number
We were intrigued by reports of the enrichment of OR genes in regions of copy-number variation (e.g., 27,28). Therefore, we obtained coordinates of 15,376 nonoverlapping candidate CNVRs from the Database of Genomic Variants, a collation of data from 46 publications (The Centre for Applied Genomics, The Hospital for Sick Children, University of Toronto).31 Note that each region in the database may represent several overlapping CNVs found in one or more studies—here, we use the abbreviations CNVR (copy-number-variable region), to denote an interval containing one or more variants, and CNV (copy-number variant), to denote a particular segregating variant. Together, the 15,376 CNVRs span a total of 810 Mbp, ∼25% of the genome. We also used our bioinformatics tools to locate all 896 OR genes and pseudogenes in the same version of the genome assembly (NCBI Build 36.1). We eliminated 44 ORs derived from redundant sequence (the assembly contains three alternate haplotype sequences for the major histocompatibility complex region) or whose chromosomal assignment is not precisely known (e.g., chr8_random). There remained 852 mapped ORs, of which 405 (48%) appear to be intact and 447 (52%) are pseudogenes (Table S1).
Comparing the coordinates of the ORs and candidate CNVRs, we found that 429 of the 852 (50.4%) human ORs overlap 68 candidate CNVRs, a remarkably high proportion. However, our experimental studies indicate that not all of these ORs truly vary in copy number, which probably reflects both reported CNVR boundaries that overestimate the truly variable region and false-positive CNVRs (see below). Therefore, we restricted our computational analyses of copy-number variation to a subset of more reliable regions whose boundaries are defined at higher resolution. The Database of Genomic Variants31 contains 453 CNVRs, defined by Redon et al.28 with the use of high-resolution arrays (“500K EA”) that showed copy-number gain or loss in at least two individuals sampled and, thus, are less likely to represent false-positive CNVRs. These 453 CNVRs comprise 102 Mbp (∼3% of the genome) and overlap 140 (16.4%) of the 852 mapped ORs (Table 1), still a very significant proportion of the gene family. Similar fractions of intact ORs (62/405, 15.3%) and OR pseudogenes (78/447, 17.5%) appear to be in CNVRs.
Some studies have examined the statistical significance of the enrichment of ORs and other functional categories of genes in CNVRs with the use of hypergeometric tests (e.g., 27,28,39). We were concerned that the clustered genomic arrangement of ORs (and other tandemly duplicated gene families) can result in individual CNVRs affecting multiple family members at once, resulting in a “jackpot” effect30 that invalidates the assumption, made by hypergeometric tests, that all members of a gene category behave independently.40 Therefore, we used simulation studies to assess the statistical significance of the observed large overlap between ORs and CNVRs (Table 1, Material and Methods). Other investigators have used a similar approach to determine the significance of some properties of CNVR data sets, such as GC and repeat content.27 In brief, we simulated 5000 artificial CNVR data sets with the same length distribution as the real CNVR data set and determined the overlap between each simulated CNVR set and the real OR coordinates. We used the mean overlap found in simulations as a baseline for determining the fold enrichment of ORs in the real CNVR data set and obtained a p value for the observed data by determining the proportion (if any) of simulated data sets with the same or higher level of enrichment as that observed in the real data. We find that 4.21 times as many CNVRs contain ORs as would be expected if CNVRs were distributed randomly in the genome and that such enrichment is highly unlikely to happen by chance (p < 0.0002).
OR Enrichment in CNVRs due to Segmental Duplications and Diminished Purifying Selection, Not Positive Selection
We sought to distinguish between alternative explanations for the enrichment of ORs in CNVRs. One possible explanation is that CNVs are not randomly distributed in the genome, as assumed by our simulations. CNVRs are known to frequently coincide with regions of segmental duplication, perhaps because SDs are inherently unstable regions of the genome.29,30 Furthermore, many ORs are found in regions of segmental duplication, perhaps explaining their enrichment in CNVRs. SDs are sequences duplicated in more than one genomic location and can span as much as several hundred kilobases.17 They are found in many genomic locations, are enriched near telomeres and centromeres, and together make up ∼5% of the human genome.17 To determine the role of SDs in OR-CNV enrichment, we separately analyzed the 213 ORs found in SDs and the remaining 639 ORs. ORs in SDs indeed showed a greater CNVR enrichment (6.71-fold more CNVRs than expected contain SD ORs, p < 0.0002) than did other ORs (Table 1). However, ORs outside of SD regions were still significantly enriched in CNVRs (2.69-fold more CNVRs than expected contained these ORs, p = 0.004). These findings argue that the frequent presence of ORs in SD regions is largely, but not solely, responsible for OR enrichment in CNVRs.
A second possible explanation offered by some authors (e.g., Nguyen et al.27) is that positive selective pressures could favor copy-number variation in ORs if changes in the OR repertoire provide enhanced olfactory capabilities and are thus selected for as humans adapt to new environments (and new odors). If positive selection operates, we would expect intact ORs to be more highly enriched in CNVRs than are OR pseudogenes, given that variation in intact ORs could have phenotypic consequences that selection might act upon whereas variation in OR pseudogenes could not. However, the similarity in CNVR-enrichment levels between intact ORs and OR pseudogenes (15.3% versus 17.5%, Table 1) indicates that positive selection has not driven OR CNVR enrichment. This comparison between intact ORs and pseudogenes oversimplifies a complex issue: because intact ORs and pseudogenes are interspersed with one another, most CNVs affect several genes, including ORs of both categories, and it is therefore not possible to distinguish which OR(s) within the CNV might have been the target of presumptive selection. It remains possible that OR-containing CNVs rose to high frequency due to positive selection on the intact genes within them, carrying along neighboring pseudogenes by a “hitchhiking” effect and resulting in approximately equal rates of intact-OR and pseudogene enrichment in CNVRs. We therefore looked for CNVRs that contain solely intact ORs or solely OR pseudogenes. Although too few CNVRs remain for statistical analyses, we find that CNVRs that contain only OR pseudogenes are more common than those that contain only intact ORs (data not shown), supporting our conclusion that it is quite possible for OR-containing CNVs to accumulate in the absence of positive selection.
We also examined the CNVR enrichment of the 116-member human V1R vomeronasal receptor gene family (Table S2). Like ORs, V1Rs also have a clustered genomic arrangement and are often found in SD regions. Unlike ORs, the V1R family consists almost entirely of pseudogenes32 and so can serve as a neutrally evolving “negative control” gene family. The vomeronasal system appears to have been dysfunctional since before the ape and Old-World-monkey lineages diverged;41 thus, it is very unlikely that selection acts to favor or repress human CNVs that include V1Rs. The enrichment of V1Rs in CNVRs is at least as high as that for ORs (4.60-fold more CNVRs contain V1Rs than expected, p < 0.0002, Table 1), despite the impossibility of positive selection favoring V1R-containing human CNVs. The fact that such high levels of enrichment in CNVRs are observed for a neutrally evolving gene family demonstrates that CNVR enrichment alone cannot be taken as an argument for positive selection being involved in that enrichment. We conclude that the observed enrichment of ORs and V1Rs in CNVRs probably reflects a combination of (a) their frequent presence in SDs (see above) and (b) a depletion of CNVs in other regions of the genome as a result of purifying selection against copy-number change of dosage-sensitive genes, rather than the result of selection having favored OR- or V1R-containing CNVs. Moreover, our analyses hint that OR-containing CNVs might be weakly selected against, given that CNVRs show a slightly higher level of V1R enrichment (which presumably reflects the rate of neutral CNV accumulation) than of OR enrichment (4.38× versus 2.69×, considering only the subsets of genes outside SDs). However, differences in gene-family size and genomic organization make it difficult to test the statistical significance of the difference in CNVR enrichment between classes of genes.
Bioinformatic Methods Provide Genomic Structures for 16 Candidate OR-Containing CNVs
We identified pairs of genomic sequences representing the two alleles of 16 candidate CNVs containing a total of 28 ORs (Table 2 includes the CNVs that we have confirmed experimentally, and Tables S3 and S4 list all pairs of genomic sequences discussed here). Such analysis allows design of specific experimental assays for each allele and inference of the mutational mechanisms that gave rise to copy-number variation. Sequences of alternative alleles were already available for three OR-containing candidate CNVs.42 We included two of these CNVs in our studies (OR8G1, OR8U8/OR8U9/OR8U1), but we excluded the third because it maps close to an assembly gap in a complex, highly duplicated pericentromeric region of chromosome 22 and, thus, might reflect assembly problems rather than true structural variation. We identified 14 additional pairs of alternative structural-allele sequences by comparing human genomic sequences from various sources, comprising the reference human genome assembly,43 BAC sequences from the HTGS/NR division of GenBank (excluding “low-pass” sequences), the Celera44 and Venter assemblies,45 and a number of human fosmids, many of which were sequenced because they were deemed likely to represent structural variants25,46–48 (Washington University and Broad Genome Centers, unpublished). We searched for OR sequences identified from the alternative sources that appeared absent in the reference assembly, reasoning that if the reference assembly is indeed complete, the missing ORs probably reveal sites where the reference assembly represents the deletion allele of a segregating polymorphism. We compared the genomic sequences surrounding apparently missing ORs to the corresponding region of the reference assembly to distinguish true candidate CNVs from ORs that were actually present in both sources but with unusually high sequence divergence. Because these “alternative” sources do not represent complete assemblies, we did not perform a reciprocal analysis of reference-assembly ORs that appear to be absent from the alternative sets. In addition to performing this analysis driven by OR-coding regions, we compared the structure of the reference genome sequence with 26 fully sequenced fosmids to detect additional candidate CNVs. Each fosmid either contains at least one OR gene or overlaps an OR-containing region of the reference genome assembly (Table S3).
Together, these bioinformatic analyses identified genomic sequences of alternative structural alleles for 16 candidate CNVs (several via more than one sequence source) containing 12 intact ORs and 16 OR pseudogenes (Table 2, Tables S3 and S4). These sequences allowed us to design PCR-based assays to seven of the eight candidate CNVs that contained intact ORs. We had already surveyed the remaining candidate CNV by MLPA. Together, these experiments show that seven of the eight candidate CNVs are truly variable in the population, whereas one represents an artifact of the genome assembly (see below). Sequence analyses of the alternative structural alleles revealed that one particularly interesting CNV arose from a genomic deletion that was both destructive and creative: parts of two ancestral ORs, OR8U8 and OR8U9, were joined to create a novel intact hybrid OR, OR8U1, while eliminating the ancestral genes.
MLPA Confirms Seven Candidate Copy-Number-Variable ORs and Fails to Confirm 13 Others
Whole-genome methods provide evidence that over half of the OR repertoire might be variable in copy number. Even if CNVs containing ORs are not under strong positive selection, as our simulation studies suggest, they could still have interesting functional consequences on our olfactory abilities. In order to understand the functional consequences of this variation, we must first confirm bioinformatic CNV predictions and array-based candidate CNVs and accurately determine their genomic coordinates and allele frequencies. Therefore, we developed MLPA- and PCR-based assays to survey the copy number of a total of 37 ORs (33 intact ORs and four pseudogenes) and applied those assays to DNA samples from ∼50 human individuals. Our DNA panel includes groups of individuals from diverse geographic locations in order to allow the detection of population-specific common variants as well as variants found in multiple populations. Note that this approach means that variants that are rare and population restricted might be missed because the number of individuals surveyed in each population is small.
MLPA38 is a method that can simultaneously assay the copy number of at least 20 genomic regions relative to control regions that do not vary in copy number (Material and Methods). As proof of principle, we used MLPA to assay an X chromosome sequence on DNA from cell lines containing one, two, three, four, and five X chromosomes. We found that peak height and area correlate well with X chromosome copy number and that copy numbers between 1 and 5 can be readily distinguished by MLPA (data not shown). To date, we have used 25 MLPA probe pairs (Table S5) to assay the copy number of 24 ORs in a panel of ∼50 human individuals, with each individual sampled in triplicate. Two probe pairs simultaneously assay both members of pairs of recently duplicated ORs, OR51A2/OR51A4 and OR2A1/OR2A42, with the assay readout reflecting copy number summed over both pair members (Material and Methods). We find that eight probe pairs in our panel appear variable in copy number (OR2G6, OR2T11, OR4C11, OR4K2, OR8U8, OR51A2/OR51A4, and two probe pairs for OR56B2), 15 probe pairs appear invariant (see below), and results for two probe pairs cannot be interpreted unambiguously (OR13C2 and the OR2A1/OR2A42 probe pair) (Figures 1 and 2, Table 2, Table S6, Material and Methods). PCR experiments confirmed additional candidate CNVs (see below). Follow-up bioinformatic analyses and PCR experiments showed that several of these confirmed CNVs contain one or more other ORs in addition to the gene that was initially assayed (Table 2). Inferring copy numbers from MLPA peak heights, we found four polymorphic deletions (relative to the ancestral diploid state, as determined by comparison to chimpanzee and macaque assemblies49,50), two polymorphic duplications, and another more complex case (OR2T11) in which a relatively common deletion allele is present, as well as one individual who may carry a duplication (Table S7). We treat this finding of a multi-allelic CNV tentatively, as well as two other structural alleles suggested by only a single individual in our panel (the possibly multi-allelic OR4K2 [Figure 1] and the duplicated allele of OR2G6). Assaying a larger panel of individuals and/or independently extracted DNA samples from the individuals concerned could determine whether these structural alleles are valid or merely a sporadic artifact of MLPA or of immortalized cell lines.
Figure 1.
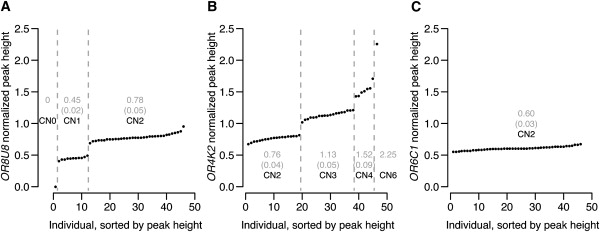
Copy-Number Assessment of Three Representative ORs by MLPA
Normalized peak heights (means of triplicate measurements) are shown for three MLPA probe pairs, each surveyed in 46 individuals. Peak heights are proportional to genomic copy number. For each probe pair, samples are sorted in ascending order of peak height. Numbers in gray represent mean peak heights for each group of samples with the same allelic state, with standard deviations for each group in parentheses and inferred copy number given as, for example, CN2 (copy number = 2).
(A) The OR8U8 probe pair reveals a polymorphic deletion. (B) The OR4K2 probe pair reveals a polymorphic duplication. Note that the ratio of the mean peak heights of the genotype groups we have assigned is 2: 3.0: 4.0: 5.9. We treat the copy-number assignment of the individual who appears to have 6 copies tentatively at present, as well as two other allelic states only observed in a single individual in our panel (three copies of OR2G6, three copies of OR2T11). Sampling a much larger panel of individuals, and/or DNA extracted independently from the individual in question (not derived from an immortalized cell line) would be needed to increase confidence in these observations. (C) The OR6C1 probe pair does not reveal any copy-number variation, showing very consistent peak height across the panel of 46 individuals we surveyed.
Figure 2.
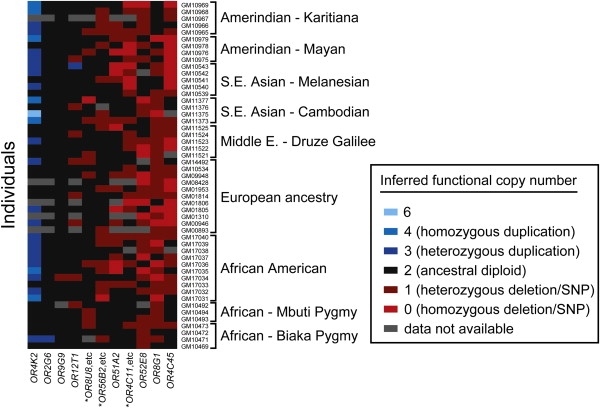
Number of Functional Copies of 19 OR Genes Examined in a Panel of 51 Individuals
We summarize in this figure both copy-number variation and single-nucleotide polymorphisms that would disrupt OR function (“segregating pseudogenes”), in some cases in the same gene. Figure S2 shows copy-number variation alone. Each row represents one of the human individuals tested as part of our diversity panel. Each column of the grid summarizes genotype data for an OR gene or, in three cases (∗), for groups of OR genes (see below). Table 2 details the polymorphisms summarized in this figure. Genes are ordered according to the number of copies gained or lost, averaged over the individuals surveyed. Full genotype data are also given in Table S7.
∗ “OR8U8,etc”: a deletion CNV destroys function of OR8U8 and OR8U9, while simultaneously creating a novel hybrid gene, OR8U1; “OR56B2, etc”: a deletion removes all of OR56B2 and OR52N5 as well as half of OR52N1; and “OR4C11, etc”: a complex set of deletions removes OR4C11, OR4P4, OR4S2, OR4V1P and OR4P1P (Figure S1).
Thirteen ORs appear invariant by MLPA yet lie within putative CNVRs according to the Database of Genomic Variants (OR2A14, OR2Y1, OR2Z1, OR4L1, OR5F1, OR6C1, OR10AD1, OR11L1, OR52B4, OR52E2, and OR52E5; as well as OR2F2 and OR5D18, which were each assayed by two independent probe pairs). These ORs could be in real CNVs with very rare minor alleles (< 1%), could vary only in specific human populations not surveyed here, or could be truly invariant in copy number. Because many previously described CNVRs were defined by whole-genome surveys of limited resolution, e.g., comparative genomic hybridization on BAC arrays, the regions that are truly variable could be much smaller than the coordinates reported. Our results are consistent with suggestions by others30,47,51,52 that the true proportion of the human genome that varies in copy number is lower than the ∼25% reported and show that fewer genes are variable in copy number than CNVR databases suggest. A large, unbiased screen for OR copy-number variation would be needed to predict the proportion of the ∼200 intact ORs in candidate CNVRs that are truly variable. Because of these caveats of published CNVR data sets, our statistical analyses of gene enrichment in CNVRs (see above) used only a higher-resolution, higher-confidence subset of CNVRs. The reduced data set contains 12 of the 15 ORs that we showed to be truly CNV by MLPA and/or PCR but only four of the 13 ORs that we did not find to vary in copy number. These numbers demonstrate that the reduced set is greatly enriched for true copy-number variation as compared to the unfiltered data set of all 15,376 CNVRs.
PCR Experiments Confirm Six Candidate CNVs and Reveal an Artefactual Deletion in the Reference Genome Assembly
With the sequence of alternative structural alleles in hand from our bioinformatic analyses, it is relatively straightforward to design PCR assays to detect each allele and infer the copy number of ORs in the region. We were able to confirm and determine the allele frequency for six CNVs containing 14 ORs, including some of those that we had assayed by MLPA (Table 2, Table S6). Together, these PCRs and our MLPA analyses show that at least 16 intact ORs and two OR pseudogenes vary in copy number.
Our PCR experiments also show that one of the candidate CNVs that we predicted bioinformatically is an artefact, representing a false ∼62.4 kb deletion at chr11:49995935 in the reference genome. This sequence is at chr11:50190615–50253011 in the Celera assembly and is also present in the Venter and chimpanzee assemblies and in the sequence of human BAC CTD1-2361F20. It encompasses three ORs, OR4C49P, OR4C45, and OR4C48P. We designed PCR assays specific to each putative allele and found that no DNA sample could be amplified with primers for the deleted allele. All 51 human DNA samples tested were positive for the undeleted allele, as was DNA obtained from BAC RP11-1276E07, which was used to construct the genome assembly. Thus, the BAC's sequence (accession number AP006622) is erroneously missing this ∼62 kb region, even though it is present in our isolate of the clone.
During our PCR, sequencing, and bioinformatic analysis of candidate copy-number-variable ORs, we fortuitously noted and genotyped four single-nucleotide polymorphisms (SNPs) in which the derived alleles disrupt function of an OR, resulting in three “segregating pseudogenes”13 (OR52E8 and OR4C45, neither of which was previously known to be a segregating pseudogene, as well as OR8G1; Table 2) that could have functional consequences.53 Function of OR52E8 and OR8G1 can be lost in at least two ways, given that they both exhibit inactivating SNPs and are contained within polymorphic genomic deletions.
The minor-allele frequencies that we measured for OR-containing CNVs range from 1% (the lower limit of our detection ability in ∼50 individuals) to 45%. For all CNVs, the allele that we infer to be ancestral (based on comparative analysis of chimpanzee assembly and, in one case, the macaque assembly as well) is more common than the derived allele among the individuals we surveyed. However, for one SNP, the derived allele has risen in frequency to 54%. Most CNVs that we surveyed were variant across several of the geographically diverse subpopulations that we sampled. This observation indicates an ancient origin, before humans migrated out of Africa, and/or recurrent deletions and duplications resulting in copy-number variation of the same OR in multiple subpopulations. Large-scale studies of geographically diverse populations also show that the majority of SNPs and CNVs are polymorphic in all populations studied.54 Genotypes of individuals from the same population do not cluster with one another on the basis of the relatively small number of CNVs we surveyed (data not shown), because most variation is shared between populations.
Functional copy-number variation is great in our human DNA panel, especially when CNV and SNP data are combined (Figure 2, Table S7). No individual has the number of functional copies expected from the reference assembly, and almost every individual in our panel has a unique combination of functional losses and gains among the ORs we surveyed. Summing up functional copy-number change over all genes assayed, we find that the individuals we surveyed have between 1 and 12 functional ORs fewer than would be expected from the reference genome assembly and, therefore, that some individuals have a total of 11 more functional OR copies than others.
The OR Family is Reshaped by both Homology-Based and Homology-Independent Processes
Our identification of pairs of sequences representing alternative structural alleles also allows us to infer the mutational mechanisms underlying OR copy-number change. Genomic deletions and duplications are known to occur by several mechanisms, including nonallelic homologous recombination (NAHR), nonhomologous end joining (NHEJ), retrotransposition, and expansion of tandem repeats.55 In most cases, it is possible to deduce the mechanism of rearrangement by examination of sequences around rearrangement breakpoints.56 Recent studies47,51,57 have shown that human CNVs have arisen by all four of these mechanisms. Given the clustered genomic arrangement of the OR family, with many tandemly repeated sets of highly homologous sequences, we wondered whether NAHR would be largely responsible for rearrangements in OR-containing regions. However, comparing the breakpoint sequences of the seven pairs of alternative structural alleles that we experimentally verified, we found that both NAHR and NHEJ play a role in CNV formation in OR-containing regions. Four deletion alleles contain only a few bases of homology (“microhomology”) at deletion breakpoints and were thus formed by NHEJ, and three other deletion alleles show long homologous stretches at their breakpoints (∼900 bp–10.6 kb of ≥ 84% identity, with 34–212 bp stretches of 100% identity at breakpoints) and thus probably result from NAHR (Figure 3, Table 2). In one complex case (OR4C11; see Table 2 and Figure S1), the derived structural allele appears to have arisen from the ancestral sequence by four separate, but closely spaced, deletions and two inversion events. Breakpoint analyses implicate NHEJ as the mechanism in all these events, but the fact that the region containing the three deletions is flanked by two very similar inverted copies of an L1 repeat unit suggests that incorrect pairing of these repeats might have resulted in a loop structure, within which the complex deletions and inversions could have occurred (Figure S1).
Figure 3.
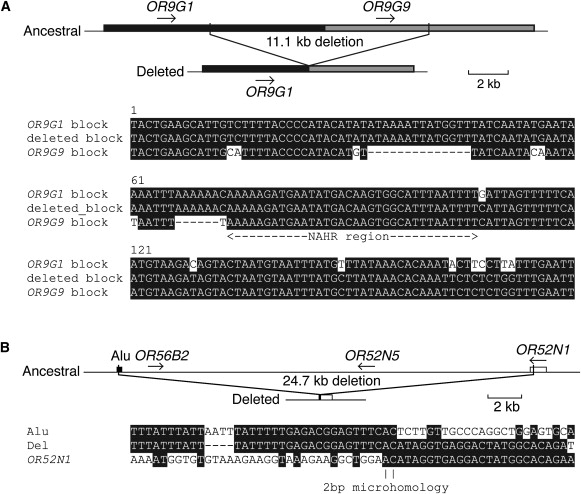
Cartoons of Genomic Structures and Breakpoint-Sequence Alignments of Two Representative Sets of Alternative Structural Alleles
(A) Nonallelic homologous recombination (NAHR) between duplicated ∼10.7 kbp sequence blocks with 84% identity, of which 180 bp is shown aligned here. NAHR appears to have mediated a deletion that removes OR9G9. The “crossover” occurred somewhere within the 36 bp of identical sequence indicated as “NAHR region.”
(B) Nonhomologous end joining (NHEJ) mediated a deletion of OR56B2, OR52N5, and half of OR52N1—two bases of microhomology are indicated at the deletion breakpoint. In both (A) and (B), derived sequences spanning the deletion (middle rows) are shown aligned with the two ancestral sequences (outer rows). White letters on a black background indicate identical sequence; black letters on a white background indicate mismatched bases; “-“ symbols indicate alignment gaps.
Discussion
Whole-genome surveys show that as many as half of the ∼850 OR genes in the human genome, a remarkable proportion, could be polymorphic in copy number. Although our experimental studies show that the truly variable fraction of ORs is likely to be lower than half, we observe significant variation in OR repertoire size among the ∼50 human individuals we assayed. We show that at least ten regions, containing 16 intact OR genes and two OR pseudogenes, are variable in copy number in the human population (1–5 ORs per region, Table 2). Fourteen intact ORs are deleted in some individuals and not in others, and three intact ORs are duplicated in a subset of individuals (for one OR, both deletion and duplication alleles appear to be present in the population). The polymorphic deletions and duplications that we describe represent the raw material on which genetic drift and/or natural selection can act to fix gene duplications and gene losses. Such duplications and deletions have, over time, resulted in a “birth-and-death” style of evolution in the OR gene family.5,21 We also describe SNPs that disrupt the function of three of the ORs that we surveyed. With our CNV and SNP genotyping results combined, the summed functional copy number of the ORs we surveyed varies between individuals by up to 11 ORs. A comprehensive analysis will no doubt reveal even more CNV ORs. Although we have not identified every CNV OR, our in-depth analyses provide reliable and absolute quantification of copy number at precise genomic locations, unlike more-comprehensive microarray studies that generally scan the genome at lower resolution and provide only relative, approximate ideas of copy number. Our in-depth study also allows us to infer that both homology-based and nonhomologous processes are remodeling OR regions.
Such genotypic variation in the OR family among human individuals could have a significant impact on our olfactory abilities. Deletion of one or more entire ORs could, in homozygous individuals, result in partial or total insensitivity to certain odorants that would normally be recognized by the missing OR(s). Reduction in the diversity of expressed receptor types might also reduce the complexity of the combinatorial code and hamper the ability to discriminate similar odorants. Duplications and heterozygous deletions would probably alter the number of olfactory epithelial neurons choosing to express the affected receptor, and, thus, they might alter sensitivity to the odorants recognized by that receptor. Novel hybrid genes like OR8U1 might allow novel odorants to be recognized. It is also interesting to note that a subset of ORs could function outside the olfactory system, such as human OR1D2, which appears to mediate sperm chemotaxis toward its ligand, bourgeonal.58 The functional impact of OR-containing CNVs could, therefore, extend to other phenotypes, including male fertility. Like ORs, the red and green opsin genes and a number of opsin pseudogenes are arranged in a tandem cluster. Recent unequal-recombination events and gene conversions between members of the opsin cluster have resulted in duplications, deletions, and hybrid genes segregating as human polymorphisms. Such events result in altered color perception or color blindness,59 analogous to the altered chemosensory perception that we predict results from the OR copy-number variation we describe here.
Phenotypic variation in olfactory ability has indeed been observed in both human and mouse populations. Inability to smell (anosmia), reduced olfactory sensitivity (hyposmia), and enhanced abilities (hyperosmia) have all been reported. Often, the detection of all odorants is affected (generalized anosmia/hyposmia/hyperosmia),60,61 a phenomenon that is usually related to general health status (e.g., respiratory infections, head injuries), alterations in signal-transduction pathways, or developmental disorders, such as Kallmann's syndrome (KAL1 [MIM 308700], KAL2 [MIM 147950], KAL3 [MIM 244200], KAL4 [MIM 610628]). Of greater interest in the context of our study of variation in particular OR genes, specific anosmias, hyposmias, and hyperosmias that affect the ability to detect only certain odorants have been described. Examples include anosmia for musk (in some humans)62 and for isovaleric acid (in some mouse strains),63 as well as human hyperosmia to asparagus metabolites64 and variation in detection thresholds for isovaleric acid, androstenone, and androstadienone (see below). Such phenotypic variation could be a direct consequence of the variation in OR-repertoire size that we describe.
Two recent studies provided the first links between variation in specific OR genes and variation in human phenotypes. The inactive form of human OR11H7, caused by a nonsense SNP, was shown to be significantly less prevalent in individuals hyperosmic for isovaleric acid than in “normal” individuals.53 SNPs that change the amino acid sequence of a second human OR, OR7D4, were shown to affect detection thresholds and valence (pleasantness) ratings for the testosterone-derived steroidal odorants androstenone and androstadienone and were shown to affect OR7D4's ability to respond to those odorants in in vitro functional assays.65 Interestingly, individuals who are heterozygous for OR7D4 variants have phenotypes that are intermediate between the two classes of homozygous individuals in terms of both odorant-detection thresholds and valence,65 suggesting that changes in the number of neurons that express particular receptor types can alter olfactory abilities. By analogy, even though individuals homozygous for OR deletions were relatively rare in our study, the many individuals who are heterozygous for OR copy-number changes might also possess an altered sense of smell. Conversely, in some cases, the combinatorial nature of olfactory coding, in which multiple receptors can recognize multiple odorants,8 might serve to reduce the impact of OR gene loss, given that other receptors might be partially or fully redundant with the lost gene.
Elucidation of the functional consequences of the OR-containing CNVs we have characterized will require a great deal of additional work. To date, odorant ligands have been identified for only a handful of human ORs.53,58,65–69 Although some of these ORs are in candidate CNVRs according to whole-genome studies, none is in the subset that we have confirmed as truly copy-number variable.
We have also shown that OR genes are statistically significantly enriched in CNVRs reported in whole-genome studies. We argue that ORs (and V1Rs) are not enriched in CNVRs as a result of positive selection and that enrichment is more likely a result of a combination of (a) the preponderance of these genes in segmentally duplicated regions, which are known to be more susceptible to copy-number variation than are unique regions of the genome,29,30 and (b) the fact that CNVs are depleted from other genome regions that harbor dosage-sensitive genes. Our findings apply to OR-containing CNVs as a class—it is still possible that a small minority of OR-containing CNVs are under positive selection. In contrast to neutrally evolving OR-containing CNVs, other structural variants appear to confer advantageous new functions70 or predisposition to disease71 and are likely to be under significant selective pressures. A recent paper by Nozawa et al.39 (see also comments by Zhang72) also suggested that OR-containing CNVs accumulate neutrally, using arguments based on the distribution of summed OR copy numbers in the HapMap population.28 Our results are consistent with Nozawa et al.'s findings, and we extend the arguments favoring neutrality with our use of appropriate statistical methods for measuring enrichment and our assessment of the important contribution of segmental duplications to OR-CNVR enrichment. We also show that whole-genome studies of CNVRs probably overestimate the size of variable regions, in agreement with other recent studies.47,51,52 Other known caveats of whole-genome studies include their bias in favor of finding larger CNVs, their tendency to be more effective in identifying deletions than in identifying duplications, the fact that some studies avoided surveying regions of SDs whereas other studies focused solely on those regions, and the fact that many studies relied on the reference assembly for experimental design and thus cannot survey sequences missing from that assembly. These caveats highlight the need for additional genotyping and characterization of structurally variant alleles at the sequence level,46 as we have done here for a subset of OR-containing CNVs, before further conclusions can be drawn about the phenotypic consequences of variation in genes within putative CNVRs. Our conclusion that OR CNVs are accumulating neutrally as a class is unlikely to be affected by these caveats, because the issues we describe are likely to affect intact ORs, OR pseudogenes, and V1Rs approximately equally.
We describe methods for assessing the statistical significance of the enrichment of ORs (or any other class of genes) in a data set of genomic regions. Many other studies have used hypergeometric tests that assume that each gene has an independent chance of being in the regions of interest, but these CNVR data sets contain larger regions that can affect multiple related genes at once. The assumptions of the test are therefore violated for gene families with a clustered genomic arrangement, like the ORs, thus artificially inflating p values by a “jackpot effect”30. Use of simulations for the assessment of statistical significance avoids such problems and will be important for CNVR analyses, like the one we describe here, as well as for functional analyses of other data sets of large genomic regions; for example, gene ontology (GO) analysis of regions lost or gained in tumor samples.73
In summary, we show that at least 16 intact ORs are variable in copy number in the human population. These 16 copy-number-variable ORs, together with 26 SNPs that result in “segregating pseudogenes” (described by other investigators13) and three more that were revealed by this study, clearly show that huge variation exists between humans in the number of functional ORs that we possess and that this variation is likely to underlie observed phenotypic variations in human olfactory ability.
Supplemental Data
Supplemental data include two figures and eight tables and can be found with this article online at http://www.ajhg.org/.
Supplemental Data
Web Resources
The URLs for data presented herein are as follows:
Cross_match, http://www.phrap.org
HORDE, Human olfactory receptor data exploratorium, http://bioportal.weizmann.ac.il/HORDE
MRC Holland, http://www.mlpa.com
OMIM, Online Mendelian Inheritance in Man, http://www.ncbi.nlm.nih.gov/Omim/
RepeatMasker, http://www.repeatmasker.org
UCSC Genome Browser, http://genome.ucsc.edu
Acknowledgments
We thank The Centre for Applied Genomics, University of Toronto, for compiling the Database of Genomic Variants; Stefan White for MLPA control probe sequences; and Stefan White and MRC Holland for advice on MLPA protocols. We are also grateful to Andy Siegel for statistical advice, to NIDCD for funding (DC0042090), to Fred Hutchinson Cancer Research Center's sequencing facility, to Mike Schlador for preparing some samples in our human DNA panel, to Christina Laukaitis and Marco Salazar for comments on the manuscript, and to an anonymous reviewer for helpful suggestions on our statistical analyses.
References
- 1.Buck L., Axel R. A novel multigene family may encode odorant receptors: a molecular basis for odor recognition. Cell. 1991;65:175–187. doi: 10.1016/0092-8674(91)90418-x. [DOI] [PubMed] [Google Scholar]
- 2.Glusman G., Yanai I., Rubin I., Lancet D. The complete human olfactory subgenome. Genome Res. 2001;11:685–702. doi: 10.1101/gr.171001. [DOI] [PubMed] [Google Scholar]
- 3.Niimura Y., Nei M. Extensive gains and losses of olfactory receptor genes in Mammalian evolution. PLoS ONE. 2007;2:e708. doi: 10.1371/journal.pone.0000708. [DOI] [PMC free article] [PubMed] [Google Scholar]
- 4.Zhang X., Firestein S. The olfactory receptor gene superfamily of the mouse. Nat. Neurosci. 2002;5:124–133. doi: 10.1038/nn800. [DOI] [PubMed] [Google Scholar]
- 5.Young J.M., Friedman C., Williams E.M., Ross J.A., Tonnes-Priddy L., Trask B.J. Different evolutionary processes shaped the mouse and human olfactory receptor gene families. Hum. Mol. Genet. 2002;11:535–546. doi: 10.1093/hmg/11.5.535. [DOI] [PubMed] [Google Scholar]
- 6.Ngai J., Chess A., Dowling M.M., Necles N., Macagno E.R., Axel R. Coding of olfactory information: topography of odorant receptor expression in the catfish olfactory epithelium. Cell. 1993;72:667–680. doi: 10.1016/0092-8674(93)90396-8. [DOI] [PubMed] [Google Scholar]
- 7.Chess A., Simon I., Cedar H., Axel R. Allelic inactivation regulates olfactory receptor gene expression. Cell. 1994;78:823–834. doi: 10.1016/s0092-8674(94)90562-2. [DOI] [PubMed] [Google Scholar]
- 8.Malnic B., Hirono J., Sato T., Buck L.B. Combinatorial receptor codes for odors. Cell. 1999;96:713–723. doi: 10.1016/s0092-8674(00)80581-4. [DOI] [PubMed] [Google Scholar]
- 9.Mombaerts P., Wang F., Dulac C., Chao S.K., Nemes A., Mendelsohn M., Edmondson J., Axel R. Visualizing an olfactory sensory map. Cell. 1996;87:675–686. doi: 10.1016/s0092-8674(00)81387-2. [DOI] [PubMed] [Google Scholar]
- 10.Gilad Y., Man O., Glusman G. A comparison of the human and chimpanzee olfactory receptor gene repertoires. Genome Res. 2005;15:224–230. doi: 10.1101/gr.2846405. [DOI] [PMC free article] [PubMed] [Google Scholar]
- 11.Rat Genome Sequencing Project Consortium Genome sequence of the Brown Norway rat yields insights into mammalian evolution. Nature. 2004;428:493–521. doi: 10.1038/nature02426. [DOI] [PubMed] [Google Scholar]
- 12.Quignon P., Kirkness E., Cadieu E., Touleimat N., Guyon R., Renier C., Hitte C., Andre C., Fraser C., Galibert F. Comparison of the canine and human olfactory receptor gene repertoires. Genome Biol. 2003;4:R80. doi: 10.1186/gb-2003-4-12-r80. [DOI] [PMC free article] [PubMed] [Google Scholar]
- 13.Menashe I., Man O., Lancet D., Gilad Y. Different noses for different people. Nat. Genet. 2003;34:143–144. doi: 10.1038/ng1160. [DOI] [PubMed] [Google Scholar]
- 14.Rouquier S., Blancher A., Giorgi D. The olfactory receptor gene repertoire in primates and mouse: Evidence for reduction of the functional fraction in primates. Proc. Natl. Acad. Sci. USA. 2000;97:2870–2874. doi: 10.1073/pnas.040580197. [DOI] [PMC free article] [PubMed] [Google Scholar]
- 15.Gilad Y., Man O., Paabo S., Lancet D. Human specific loss of olfactory receptor genes. Proc. Natl. Acad. Sci. USA. 2003;100:3324–3327. doi: 10.1073/pnas.0535697100. [DOI] [PMC free article] [PubMed] [Google Scholar]
- 16.Gilad Y., Przeworski M., Lancet D. Loss of olfactory receptor genes coincides with the acquisition of full trichromatic vision in primates. PLoS Biol. 2004;2:E5. doi: 10.1371/journal.pbio.0020005. [DOI] [PMC free article] [PubMed] [Google Scholar]
- 17.Bailey J.A., Yavor A.M., Massa H.F., Trask B.J., Eichler E.E. Segmental duplications: organization and impact within the current human genome project assembly. Genome Res. 2001;11:1005–1017. doi: 10.1101/gr.187101. [DOI] [PMC free article] [PubMed] [Google Scholar]
- 18.Trask B.J., Friedman C., Martin-Gallardo A., Rowen L., Akinbami C., Blankenship J., Collins C., Giorgi D., Iadonato S., Johnson F. Members of the olfactory receptor gene family are contained in large blocks of DNA duplicated polymorphically near the ends of human chromosomes. Hum. Mol. Genet. 1998;7:13–26. doi: 10.1093/hmg/7.1.13. [DOI] [PubMed] [Google Scholar]
- 19.Newman T., Trask B.J. Complex evolution of 7E olfactory receptor genes in segmental duplications. Genome Res. 2003;13:781–793. doi: 10.1101/gr.769003. [DOI] [PMC free article] [PubMed] [Google Scholar]
- 20.Quignon P., Giraud M., Rimbault M., Lavigne P., Tacher S., Morin E., Retout E., Valin A.S., Lindblad-Toh K., Nicolas J. The dog and rat olfactory receptor repertoires. Genome Biol. 2005;6:R83. doi: 10.1186/gb-2005-6-10-r83. [DOI] [PMC free article] [PubMed] [Google Scholar]
- 21.Nei M., Gu X., Sitnikova T. Evolution by the birth-and-death process in multigene families of the vertebrate immune system. Proc. Natl. Acad. Sci. USA. 1997;94:7799–7806. doi: 10.1073/pnas.94.15.7799. [DOI] [PMC free article] [PubMed] [Google Scholar]
- 22.Li W.H. Sinauer Associates; Sunderland, MA: 1997. Molecular evolution. [Google Scholar]
- 23.Linardopoulou E., Mefford H.C., Nguyen O.T., Friedman C., van den Engh G., Farwell D.G., Coltrera M., Trask B.J. Transcriptional activity of multiple copies of a subtelomerically located olfactory receptor gene that is polymorphic in number and location. Hum. Mol. Genet. 2001;10:2373–2383. doi: 10.1093/hmg/10.21.2373. [DOI] [PubMed] [Google Scholar]
- 24.Sebat J., Lakshmi B., Troge J., Alexander J., Young J., Lundin P., Maner S., Massa H., Walker M., Chi M. Large-scale copy number polymorphism in the human genome. Science. 2004;305:525–528. doi: 10.1126/science.1098918. [DOI] [PubMed] [Google Scholar]
- 25.Tuzun E., Sharp A.J., Bailey J.A., Kaul R., Morrison V.A., Pertz L.M., Haugen E., Hayden H., Albertson D., Pinkel D. Fine-scale structural variation of the human genome. Nat. Genet. 2005;37:727–732. doi: 10.1038/ng1562. [DOI] [PubMed] [Google Scholar]
- 26.Conrad D.F., Andrews T.D., Carter N.P., Hurles M.E., Pritchard J.K. A high-resolution survey of deletion polymorphism in the human genome. Nat. Genet. 2006;38:75–81. doi: 10.1038/ng1697. [DOI] [PubMed] [Google Scholar]
- 27.Nguyen D.Q., Webber C., Ponting C.P. Bias of selection on human copy-number variants. PLoS Genet. 2006;2:e20. doi: 10.1371/journal.pgen.0020020. [DOI] [PMC free article] [PubMed] [Google Scholar]
- 28.Redon R., Ishikawa S., Fitch K.R., Feuk L., Perry G.H., Andrews T.D., Fiegler H., Shapero M.H., Carson A.R., Chen W. Global variation in copy number in the human genome. Nature. 2006;444:444–454. doi: 10.1038/nature05329. [DOI] [PMC free article] [PubMed] [Google Scholar]
- 29.Sharp A.J., Locke D.P., McGrath S.D., Cheng Z., Bailey J.A., Vallente R.U., Pertz L.M., Clark R.A., Schwartz S., Segraves R. Segmental duplications and copy-number variation in the human genome. Am. J. Hum. Genet. 2005;77:78–88. doi: 10.1086/431652. [DOI] [PMC free article] [PubMed] [Google Scholar]
- 30.Cooper G.M., Nickerson D.A., Eichler E.E. Mutational and selective effects on copy-number variants in the human genome. Nat. Genet. 2007;39:S22–S29. doi: 10.1038/ng2054. [DOI] [PubMed] [Google Scholar]
- 31.Iafrate A.J., Feuk L., Rivera M.N., Listewnik M.L., Donahoe P.K., Qi Y., Scherer S.W., Lee C. Detection of large-scale variation in the human genome. Nat. Genet. 2004;36:949–951. doi: 10.1038/ng1416. [DOI] [PubMed] [Google Scholar]
- 32.Young J.M., Kambere M., Trask B.J., Lane R.P. Divergent V1R repertoires in five species: Amplification in rodents, decimation in primates, and a surprisingly small repertoire in dogs. Genome Res. 2005;15:231–240. doi: 10.1101/gr.3339905. [DOI] [PMC free article] [PubMed] [Google Scholar]
- 33.Walsh S., Anderson M., Cartinhour S.W. ACEDB: a database for genome information. Methods Biochem. Anal. 1998;39:299–318. doi: 10.1002/9780470110607.ch13. [DOI] [PubMed] [Google Scholar]
- 34.Sonnhammer E.L., Durbin R. A dot-matrix program with dynamic threshold control suited for genomic DNA and protein sequence analysis. Gene. 1995;167:GC1–GC10. doi: 10.1016/0378-1119(95)00714-8. [DOI] [PubMed] [Google Scholar]
- 35.Schwartz S., Kent W.J., Smit A., Zhang Z., Baertsch R., Hardison R.C., Haussler D., Miller W. Human-mouse alignments with BLASTZ. Genome Res. 2003;13:103–107. doi: 10.1101/gr.809403. [DOI] [PMC free article] [PubMed] [Google Scholar]
- 36.Altschul S.F., Madden T.L., Schaffer A.A., Zhang J., Zhang Z., Miller W., Lipman D.J. Gapped BLAST and PSI-BLAST: a new generation of protein database search programs. Nucleic Acids Res. 1997;25:3389–3402. doi: 10.1093/nar/25.17.3389. [DOI] [PMC free article] [PubMed] [Google Scholar]
- 37.Thompson J.D., Higgins D.G., Gibson T.J. CLUSTAL W: improving the sensitivity of progressive multiple sequence alignment through sequence weighting, position-specific gap penalties and weight matrix choice. Nucleic Acids Res. 1994;22:4673–4680. doi: 10.1093/nar/22.22.4673. [DOI] [PMC free article] [PubMed] [Google Scholar]
- 38.Schouten J.P., McElgunn C.J., Waaijer R., Zwijnenburg D., Diepvens F., Pals G. Relative quantification of 40 nucleic acid sequences by multiplex ligation-dependent probe amplification. Nucleic Acids Res. 2002;30:e57. doi: 10.1093/nar/gnf056. [DOI] [PMC free article] [PubMed] [Google Scholar]
- 39.Nozawa M., Kawahara Y., Nei M. Genomic drift and copy number variation of sensory receptor genes in humans. Proc. Natl. Acad. Sci. USA. 2007;104:20421–20426. doi: 10.1073/pnas.0709956104. [DOI] [PMC free article] [PubMed] [Google Scholar]
- 40.Falcon S., Gentleman R. Using GOstats to test gene lists for GO term association. Bioinformatics. 2007;23:257–258. doi: 10.1093/bioinformatics/btl567. [DOI] [PubMed] [Google Scholar]
- 41.Liman E.R. Use it or lose it: molecular evolution of sensory signaling in primates. Pflugers Arch. 2006;453:125–131. doi: 10.1007/s00424-006-0120-3. [DOI] [PubMed] [Google Scholar]
- 42.Khaja R., Zhang J., MacDonald J.R., He Y., Joseph-George A.M., Wei J., Rafiq M.A., Qian C., Shago M., Pantano L. Genome assembly comparison identifies structural variants in the human genome. Nat. Genet. 2006;38:1413–1418. doi: 10.1038/ng1921. [DOI] [PMC free article] [PubMed] [Google Scholar]
- 43.International Human Genome Sequencing Consortium Finishing the euchromatic sequence of the human genome. Nature. 2004;431:931–945. doi: 10.1038/nature03001. [DOI] [PubMed] [Google Scholar]
- 44.Istrail S., Sutton G.G., Florea L., Halpern A.L., Mobarry C.M., Lippert R., Walenz B., Shatkay H., Dew I., Miller J.R. Whole-genome shotgun assembly and comparison of human genome assemblies. Proc. Natl. Acad. Sci. USA. 2004;101:1916–1921. doi: 10.1073/pnas.0307971100. [DOI] [PMC free article] [PubMed] [Google Scholar]
- 45.Levy S., Sutton G., Ng P.C., Feuk L., Halpern A.L., Walenz B.P., Axelrod N., Huang J., Kirkness E.F., Denisov G. The diploid genome sequence of an individual human. PLoS Biol. 2007;5:e254. doi: 10.1371/journal.pbio.0050254. [DOI] [PMC free article] [PubMed] [Google Scholar]
- 46.Eichler E.E., Nickerson D.A., Altshuler D., Bowcock A.M., Brooks L.D., Carter N.P., Church D.M., Felsenfeld A., Guyer M., Lee C. Completing the map of human genetic variation. Nature. 2007;447:161–165. doi: 10.1038/447161a. [DOI] [PMC free article] [PubMed] [Google Scholar]
- 47.Kidd J.M., Cooper G.M., Donahue W.F., Hayden H.S., Sampas N., Graves T., Hansen N., Teague B., Alkan C., Antonacci F. Mapping and sequencing of structural variation from eight human genomes. Nature. 2008;453:56–64. doi: 10.1038/nature06862. [DOI] [PMC free article] [PubMed] [Google Scholar]
- 48.Bovee D., Zhou Y., Haugen E., Wu Z., Hayden H.S., Gillett W., Tuzun E., Cooper G.M., Sampas N., Phelps K. Closing gaps in the human genome with fosmid resources generated from multiple individuals. Nat. Genet. 2008;40:96–101. doi: 10.1038/ng.2007.34. [DOI] [PubMed] [Google Scholar]
- 49.Chimpanzee Sequencing and Analysis Consortium Initial sequence of the chimpanzee genome and comparison with the human genome. Nature. 2005;437:69–87. doi: 10.1038/nature04072. [DOI] [PubMed] [Google Scholar]
- 50.Gibbs R.A., Rogers J., Katze M.G., Bumgarner R., Weinstock G.M., Mardis E.R., Remington K.A., Strausberg R.L., Venter J.C., Wilson R.K. Evolutionary and biomedical insights from the rhesus macaque genome. Science. 2007;316:222–234. doi: 10.1126/science.1139247. [DOI] [PubMed] [Google Scholar]
- 51.Perry G.H., Ben-Dor A., Tsalenko A., Sampas N., Rodriguez-Revenga L., Tran C.W., Scheffer A., Steinfeld I., Tsang P., Yamada N.A. The fine-scale and complex architecture of human copy-number variation. Am. J. Hum. Genet. 2008;82:685–695. doi: 10.1016/j.ajhg.2007.12.010. [DOI] [PMC free article] [PubMed] [Google Scholar]
- 52.de Smith A.J., Tsalenko A., Sampas N., Scheffer A., Yamada N.A., Tsang P., Ben-Dor A., Yakhini Z., Ellis R.J., Bruhn L. Array CGH analysis of copy number variation identifies 1284 new genes variant in healthy white males: implications for association studies of complex diseases. Hum. Mol. Genet. 2007;16:2783–2794. doi: 10.1093/hmg/ddm208. [DOI] [PubMed] [Google Scholar]
- 53.Menashe I., Abaffy T., Hasin Y., Goshen S., Yahalom V., Luetje C.W., Lancet D. Genetic elucidation of human hyperosmia to isovaleric acid. PLoS Biol. 2007;5:e284. doi: 10.1371/journal.pbio.0050284. [DOI] [PMC free article] [PubMed] [Google Scholar]
- 54.Jakobsson M., Scholz S.W., Scheet P., Gibbs J.R., VanLiere J.M., Fung H.C., Szpiech Z.A., Degnan J.H., Wang K., Guerreiro R. Genotype, haplotype and copy-number variation in worldwide human populations. Nature. 2008;451:998–1003. doi: 10.1038/nature06742. [DOI] [PubMed] [Google Scholar]
- 55.Freeman J.L., Perry G.H., Feuk L., Redon R., McCarroll S.A., Altshuler D.M., Aburatani H., Jones K.W., Tyler-Smith C., Hurles M.E. Copy number variation: new insights in genome diversity. Genome Res. 2006;16:949–961. doi: 10.1101/gr.3677206. [DOI] [PubMed] [Google Scholar]
- 56.Linardopoulou E.V., Williams E.M., Fan Y., Friedman C., Young J.M., Trask B.J. Human subtelomeres are hot spots of interchromosomal recombination and segmental duplication. Nature. 2005;437:94–100. doi: 10.1038/nature04029. [DOI] [PMC free article] [PubMed] [Google Scholar]
- 57.Korbel J.O., Urban A.E., Affourtit J.P., Godwin B., Grubert F., Simons J.F., Kim P.M., Palejev D., Carriero N.J., Du L. Paired-end mapping reveals extensive structural variation in the human genome. Science. 2007;318:420–426. doi: 10.1126/science.1149504. [DOI] [PMC free article] [PubMed] [Google Scholar]
- 58.Spehr M., Gisselmann G., Poplawski A., Riffell J.A., Wetzel C.H., Zimmer R.K., Hatt H. Identification of a testicular odorant receptor mediating human sperm chemotaxis. Science. 2003;299:2054–2058. doi: 10.1126/science.1080376. [DOI] [PubMed] [Google Scholar]
- 59.Nathans J. The evolution and physiology of human color vision: insights from molecular genetic studies of visual pigments. Neuron. 1999;24:299–312. doi: 10.1016/s0896-6273(00)80845-4. [DOI] [PubMed] [Google Scholar]
- 60.Tsai P.S., Gill J.C. Mechanisms of disease: Insights into X-linked and autosomal-dominant Kallmann syndrome. Nat. Clin. Pract. Endocrinol. Metab. 2006;2:160–171. doi: 10.1038/ncpendmet0119. [DOI] [PubMed] [Google Scholar]
- 61.Holbrook E.H., Leopold D.A. An updated review of clinical olfaction. Curr. Opin. Otolaryngol. Head Neck Surg. 2006;14:23–28. doi: 10.1097/01.moo.0000193174.77321.39. [DOI] [PubMed] [Google Scholar]
- 62.Whissell-Buechy D., Amoore J.E. Odour-blindness to musk: simple recessive inheritance. Nature. 1973;242:271–273. doi: 10.1038/242271a0. [DOI] [PubMed] [Google Scholar]
- 63.Griff I.C., Reed R.R. The genetic basis for specific anosmia to isovaleric acid in the mouse. Cell. 1995;83:407–414. doi: 10.1016/0092-8674(95)90118-3. [DOI] [PubMed] [Google Scholar]
- 64.Lison M., Blondheim S.H., Melmed R.N. A polymorphism of the ability to smell urinary metabolites of asparagus. BMJ. 1980;281:1676–1678. doi: 10.1136/bmj.281.6256.1676. [DOI] [PMC free article] [PubMed] [Google Scholar]
- 65.Keller A., Zhuang H., Chi Q., Vosshall L.B., Matsunami H. Genetic variation in a human odorant receptor alters odour perception. Nature. 2007;449:468–472. doi: 10.1038/nature06162. [DOI] [PubMed] [Google Scholar]
- 66.Wetzel C.H., Oles M., Wellerdieck C., Kuczkowiak M., Gisselmann G., Hatt H. Specificity and sensitivity of a human olfactory receptor functionally expressed in human embryonic kidney 293 cells and Xenopus Laevis oocytes. J. Neurosci. 1999;19:7426–7433. doi: 10.1523/JNEUROSCI.19-17-07426.1999. [DOI] [PMC free article] [PubMed] [Google Scholar]
- 67.Sanz G., Schlegel C., Pernollet J.C., Briand L. Comparison of odorant specificity of two human olfactory receptors from different phylogenetic classes and evidence for antagonism. Chem. Senses. 2005;30:69–80. doi: 10.1093/chemse/bji002. [DOI] [PubMed] [Google Scholar]
- 68.Neuhaus E.M., Mashukova A., Zhang W., Barbour J., Hatt H. A Specific Heat Shock Protein Enhances the Expression of Mammalian Olfactory Receptor Proteins. Chem. Senses. 2006;31:445–452. doi: 10.1093/chemse/bjj049. [DOI] [PubMed] [Google Scholar]
- 69.Schmiedeberg K., Shirokova E., Weber H.P., Schilling B., Meyerhof W., Krautwurst D. Structural determinants of odorant recognition by the human olfactory receptors OR1A1 and OR1A2. J. Struct. Biol. 2007;159:400–412. doi: 10.1016/j.jsb.2007.04.013. [DOI] [PubMed] [Google Scholar]
- 70.Perry G.H., Dominy N.J., Claw K.G., Lee A.S., Fiegler H., Redon R., Werner J., Villanea F.A., Mountain J.L., Misra R. Diet and the evolution of human amylase gene copy number variation. Nat. Genet. 2007;39:1256–1260. doi: 10.1038/ng2123. [DOI] [PMC free article] [PubMed] [Google Scholar]
- 71.Aitman T.J., Dong R., Vyse T.J., Norsworthy P.J., Johnson M.D., Smith J., Mangion J., Roberton-Lowe C., Marshall A.J., Petretto E. Copy number polymorphism in Fcgr3 predisposes to glomerulonephritis in rats and humans. Nature. 2006;439:851–855. doi: 10.1038/nature04489. [DOI] [PubMed] [Google Scholar]
- 72.Zhang J. The drifting human genome. Proc. Natl. Acad. Sci. USA. 2007;104:20147–20148. doi: 10.1073/pnas.0710524105. [DOI] [PMC free article] [PubMed] [Google Scholar]
- 73.Holcomb I., Grove D., Kinnunen M., Friedman C., Gallaher I., Morgan T., Sather C., Delrow J., Nelson P., Lange P. Genomic alterations indicate tumor origin and varied metastatic potential of disseminated cells from prostate-cancer patients. Cancer Res. 2008;68:5599–5608. doi: 10.1158/0008-5472.CAN-08-0812. [DOI] [PMC free article] [PubMed] [Google Scholar]
Associated Data
This section collects any data citations, data availability statements, or supplementary materials included in this article.