


Abstract
The conditions for the measurement of linear dichroism (LD) can be adjusted so as to solely reflect the length and the flexibility of DNA. The real-time detection of the EDTA·Fe2+-induced oxidative cleavage of double-stranded native and synthetic DNAs was performed using LD. The decrease in the magnitude of the LD at 260 nm, which reflects an increase in the flexibility and a decrease in the length of the DNA, can be described by the sum of two or three exponential curves in relation to the EDTA·Fe2+ concentration. The fast component was assigned to the cleavage of one of the double strands, inducing an increase in the flexibility, while the other slower component was assigned to the cleavage of the double strand, resulting in the shortening of DNA. The decrease in the magnitude of the LD of poly[d(A-T)2] was similar to that of poly[d(I-C)2], while that of poly[d(G-C)2] was found to be the slowest, indicating that the resistance of poly[d(G-C)2] against the Fenton-type reagent was the strongest. This observation suggests that the amine group in the minor groove of the double helix may play an important role in slowing the EDTA·Fe2+-induced oxidative cleavage.
INTRODUCTION
Reactive oxygen species induce various kinds of damage to DNA, including the modification of the nucleobases and the sugar moiety resulting in the release of free DNA bases, and the cleavage of the single- and double strands (1–6). Damage to DNA plays an important role in many biological processes, such as mutagenesis, carcinogenesis and aging (7–10). In the presence of transition metal ions, the Fenton reaction is an important pathway for providing oxygen radical species. Fe2+ ions are one such transition metal ion. Numerous studies on Fe2+-induced DNA cleavage have been reported, which have recently shown that, in the presence or absence of ethylenediamine tetraacetate (EDTA), the Fe2+/H2O2 system oxidizes 2′-dioxyguanosine (11) and 1,3-dimethyluracil (12) producing various oxidation products. Fe2+-mediated Fenton reactions have been reported to be sequence specific (13). Perylene-EDTA·Fe2+ selectively cleaves the telomeric G-quadruplex (14). Under Fenton-type conditions in the presence of H2O2, EDTA·Fe generates hydroxyl radicals and anions, which induce abstraction from the sugar moiety as well as the formation of an adduct with nucleobases (4,5). The following overall mechanisms of the Fe·EDTA/H2O2 system have been proposed (15):
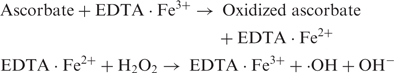 |
In these reactions, EDTA prevents iron ions from binding to DNA and accelerates the formation of hydroxyl radical. Ascorbate recycles Fe3+ to active Fe2+ which acts as reducing agent.
Although agarose gel electrophoresis is a typical techniques for the detection of DNA cleavage and the identification of DNA fragments by their size, the real-time detection of the progress of a reaction and thereby, the kinetic analysis of the reaction, is not easy. For time-based measurements, various fluorescence techniques, including fluorescence resonance energy transfer, have been utilized (16–19). However, for the application of fluorescence techniques, DNA has to be altered using fluorescent probes. Linear dichroism (LD), which is defined as the difference in the absorbance of light polarized parallel and perpendicular to the sample orientation axis, has been shown to be a viable alternative technique for the real-time detection of changes in DNA length (20–22). The magnitude of the measured LD depends on the orientation and optical factors (23,24). When the optical factors are kept constant, the magnitude of the LD depends solely on the orientation factors, including the flow rate, viscosity of the medium, temperature, flexibility of the sample, and the ratio of the long and short axes of the sample. In the case of DNA, the length is the main factor determining the magnitude of the LD. The magnitude of the LD was reported to increase upon the linearization of a circular DNA, brought about by the use of restriction enzymes, due to its elongation. The further digestion and subsequent shortening of the DNA resulted in a decrease in the magnitude of the LD (20). A decrease in the magnitude of the LD reflecting the shortening of the DNA due to double strand cleavage by deoxyribonuclease I has also been reported (22). In this case, the decrease in the magnitude of the LD was able to be modeled as a single exponential decay.
In this work, the real-time change in the magnitude of the LD due to the oxidation of various double-stranded native and synthetic DNAs in the presence of EDTA·Fe2+/H2O2 is reported. It was assumed that the oxidative cleavage results in either an increase in the flexibility of the DNA when one of the strands is cleaved or its shortening when both strands are cut. Both of these changes will result in a decrease in the magnitude of the LD. The effects of the various scavengers of reactive oxygen species on the oxidative cleavage were also tested.
MATERIALS AND METHODS
DNA and other chemicals
Calf thymus DNA (hereafter, referred to as DNA) was purchased from Worthington, NJ, and synthetic polynucleotides from Amersham Biosciences, NJ. The DNA and polynucleotides were dissolved in pH 7.0, 5 mM cacodylate buffer, containing 100 mM NaCl and 1 mM EDTA, with exhaustive shaking at 4°C. The solution was dialyzed several times against pH 7.0, 5 mM cacodylate buffer at 4°C. The concentrations of the DNA and polynucleotides were determined from their molar extinction coefficients: ε260 nm=6700 M−1 cm−1, ε251 nm=6900 M−1 cm−1, ε262 nm=6600 M−1 cm−1 and ε254 nm=8400 M−1 cm−1 for DNA, poly[d(I-C)2], poly[d(A-T)2] and poly[d(G-C)2], respectively. All other chemicals were of analytical grade and used without further purification. The cleavage of DNA was initiated by the addition of the desired concentration of EDTA·Fe2+, which was prepared independently by the simple mixing of Na2EDTA and (NH4)2Fe(SO4)2, to a 100 μM solution of the DNA or polynucleotide followed by the immediate addition of ascorbate and fresh H2O2. The dissolved O2 which was already present in the solutions was removed by the exhaustive bubbling of N2 gas for 30 min before mixing.
LD measurement
The LD measurement method has been described elsewhere (20,23–26). The measured LD is divided by the isotropic absorption spectrum to give the reduced LD (LDr), which is related to the ability of orientation, via the following equation:
where Aiso denotes the isotropic absorption spectrum and S the orientation factor, such that S = 1 or 0 for perfectly oriented or randomly orientated samples, respectively. The angle, αi, is the angle of the ith electric transition moment of a given chromophore with respect to the local DNA helix axis. The factors affecting the magnitude of the LD were carefully controlled in order to keep them constant value in this experiment and therefore, LDr solely reflects the flexibility and length of the DNA. The absorption spectra of DNA in the presence or absence of various cofactors were not altered to any great extent; therefore, the measured LD was considered to be a direct reflection of the flexibility and length of the DNA in this work. The method used for the measurement of the LD was identical to the previously reported method (20), with the exception of the microvolume of the thermostatically controlled Couette cell. A conventional Couette cell containing 2.5 ml of the sample was used. The LD was recorded on a Jasco J810 (Tokyo, Japan) at room temperature.
Data analysis
The time-dependent LD signal from which the baseline, i.e. the LD magnitude of the sample at rest (zero flow), was subtracted was averaged over at least three independent measurements. Then the averaged time-dependent LD magnitude was normalized by multiplying it by a suitable number so that the maximum LD magnitude (initial value) was equal to one. These averaged and normalized data were analyzed using an Origin 7.1 program (OriginLab Co, Northampton, MA, USA) and the results presented in this article. The decreases in the magnitude of the LD were analyzed by calculating the sum of the exponential curves based on the assumption that every step in the oxidative cleavage that affects the magnitude of the LD may be of the first order.
From this analysis, the reaction time, τi, rather than the conventional rate constants, was obtained. Information on the reaction time should be sufficient to compare each step of the multiple processes. In this analysis the cleavage of the double-stranded DNA was assumed to include both single- and double- strand cleavages which are all first order in their kinetic nature. The former cleavage is expected to increase the flexibility of the DNA and the latter to shorten the DNA or polynucleotide: both will result in a decreased in the LD magnitude.
RESULTS
Effect of the EDTA·Fe2+ concentration on the time-dependent LD magnitude of DNA
On the addition of EDTA·Fe2+/H2O2, the magnitude of the LD started to decrease. Figure 1 shows the time-dependent decrease in the magnitude of the LD of DNA at 260 nm in the presence of various concentrations of EDTA·Fe2+. The LD spectrum of DNA at the time of mixing and 250 min after mixing are compared in the inset. As shown in the inset, the LD spectrum at the time of mixing was negative, with its shape being symmetrical to that of the absorption spectrum, as would be expected from a flow-oriented LD system. The absorption spectra of DNA in the presence and absence of EDTA·Fe2+/H2O2/ascobate, at the time of mixing and 250 min later, were similar to each other when the absorption spectrum of EDTA·Fe2+/H2O2/ascobate was subtracted from that of the DNA-EDTA·Fe2+/H2O2/ascobate (data not shown): therefore, the LD can be directly interpreted as LDr. The decrease in the LD consists of an initial fast component, followed by other slower components. The fast component is dominant at a low EDTA·Fe2+ concentration, while the slow components become more important at higher EDTA·Fe2+ concentrations.
Figure 1.

The effects of the EDTA·Fe2+ concentration on the time-dependent decrease in the magnitude of the LD of DNA at 260 nm. [H2O2]=10 mM, [Ascorbate]=50 μM. Curve numbers 1 through 5, [EDTA·Fe2+]=5, 10, 50, 100 and 200 μM, respectively. [DNA]=100 μM. Insertion: LD spectra of DNA at the time of mixing (solid curve) and 250 min after mixing (dashed curve) with 10 μM EDTA·Fe2+.
The decrease in the LD was unable to be fitted to simple first or second order kinetics and consisted of the sum of various exponential decays. An example of the decay curve analysis for 100 μM DNA in the presence of 100 μM EDTA·Fe2+, 10 mM H2O2 and 50 μM ascorbate is shown in Figure 2. The goodness of fit was evaluated using both the residuals and linear regressions. As seen from the residuals, the decay curve in this particular case consisted of three exponential components: 1.40 ± 0.015 min (a1=0.54), 17.5 ± 2.79 min (a2=0.10) and 158.3 ± 65.5 min (a3=0.35), where the a's are the relative amplitudes. The error for the two short components which are assumed to reflect the single- and double-stranded breakage were 1.1 and 15.9%, respectively. The analysis of the other sets of data resulted in a similar error range and will not be mentioned further. The reaction, particularly at the low EDTA·Fe2+ concentrations, was completed within 100 min and the fits were performed to 100 min. Although a small decrease in LD magnitude after 100 min was observed, especially, at the high EDTA·Fe2+ concentrations, the fits were also performed to 100 min for the sake of consistency in the data analysis. The results for the other EDTA·Fe2+ concentrations are summarized in Table 1. As shown in Table 1, the decrease in the magnitude of the LD at low EDTA·Fe2+ concentrations can be described by two exponential decays, while three components were required at higher EDTA·Fe2+ concentrations. The shortest component, τ1, whose contribution, i.e. both the shortening of the decay time and decrease in the relative amplitude, became smaller with increasing EDTA·Fe2+ concentration, was dominant at low EDTA·Fe2+ concentrations. The longer component, τ2, also shortened at low EDTA·Fe2+ concentrations with increases in the EDTA·Fe2+ concentrations. At high EDTA·Fe2+ concentrations, the slowest decay component, τ3, appeared. All of these results show the heterogeneity of the system. Considering that the magnitude of the LD reflects only the flexibility and length of the DNA system, this heterogeneity is not surprising.
Figure 2.

An example of the curve analysis for DNA in the presence of [EDTA·Fe2+]=100 μM, [H2O2]=10 mM, [Ascorbate]=50 μM. The measured data are represented by the dotted curve, and the best fitting three component exponential decay by the solid curve. In the lower panels, the resulting residuals from the one, two and three component (from top) analyses are shown.
Table 1.
Summary of the EDTA·Fe2+ concentration dependent decay components in the magnitude of LD. [H2O2]=10 mM, [Ascorbate]=50 μM
| [EDTA·Fe2+], μM | Decay component (min) and amplitudes | ||
|---|---|---|---|
| 5 | a1=0.94 | a2=0.06 | |
| τ1=5.9 | τ2=39.4 | ||
| 10 | a1=0.90 | a2=0.10 | |
| τ1=4.4 | τ2=26.8 | ||
| 50 | a1=0.67 | a2=0.20 | a3=0.13 |
| τ1=2.1 | τ2=17.5 | τ3=83.9 | |
| 100 | a1=0.54 | a2=0.10 | a3=0.35 |
| τ1=1.4 | τ2=17.1 | τ3=158.0 | |
| 200 | a1=0.20 | a2=0.20 | a3=0.60 |
| τ1=0.6 | τ2=7.3 | τ3=110.3 | |
EDTA·Fe2+-induced decrease in LD magnitude of synthetic polynucleotide
The time-dependent decreases in the magnitude of poly[d(A-T)2], poly[d(G-C)2] and poly[d(I-C)2] LD are depicted in Figure 3, with the analytical results summarized in Table 2. The decrease in the magnitude of the LD of poly[d(A-T)2] can be described by the sum of two exponential decays at EDTA·Fe2+ concentrations of both 10 and 200 μM (Figure 3, panel (a)). In the case of 10 μM EDTA·Fe2+, the fast component (8.3min), τ1, was dominant with the long decay, τ2, appearing at 59.2 min. In the case of 200 μM EDTA·Fe2+, the decay times, τ1 and τ2, were 4.0 and 84.5 min (Table 2), respectively, and the amplitude of τ2 was larger, which was in contrast to the case with DNA. The results obtained with poly[d(I-C)2] at both EDTA·Fe2+ concentrations were similar to those obtained with poly[d(A-T)2] (Figure 3, panel (c)), which exhibited two exponential components. However, the decreasing profile of poly[d(G-C)2] contrasted those of poly[d(A-T)2] and poly[d(I-C)2]. Although, in the presence of 10 μM EDTA·Fe2+, the decreasing magnitude of the LD of poly[d(G-C)2] can be described by two exponential curves with decay times of 8.5 and 113.9 min (Figure 3, panel (b) and Table 2), a single decay time of 110.2 min was observed at a high EDTA·Fe2+ concentration. It is worth noting that even 250 min after mixing, the magnitude of the LD did not reach zero at either EDTA·Fe2+ concentrations. This observation suggests that the amine group in the minor groove inhibited at least one of the processes involved in the EDTA·Fe2+-induced DNA cleavage. Removal of the amine group resulted in the appearance of an extra decay component, as in the case of poly[d(A-T)2] and poly[d(I-C)2]. The overall shape of the decay profile of poly[d(I-C)2] became similar to that of poly[d(A-T)2], as shown above.
Figure 3.

The effect of the EDTA·Fe2+ concentration on the time-dependent decrease in the magnitude of the LD of the synthetic polynucleotides at 260 nm. [EDTA·Fe2+] = 10 μM (solid curve) and 200 μM (dotted curve), [H2O2] = 10 mM and [Ascorbate] = 50 μM. Panel (a): poly[d(A-T)2]; panel (b): poly[d(G-C)2]; panel (c): poly[d(I-C)2].
Table 2.
Decay of the LD signal at 260 nm of the synthetic polynucleotides at two representative EDTA·Fe2+ concentrations, 10 μM and 200 μM. [H2O2]=10 mM, [Ascorbate]=50 μM
| Polynucleotide | [EDTA·Fe2+]=10 μM | [EDTA·Fe2+]=200 μM | |||
|---|---|---|---|---|---|
| DNA | a1=0.90 | a2=0.10 | a1=0.20 | a2=0.20 | a3=0.60 |
| τ1=4.4 | τ2=26.8 | τ1=0.6 | τ2=7.3 | τ3=110.3 | |
| Poly[d(A-T)2] | a1=0.84 | a2=0.16 | a1=0.18 | a2=0.82 | |
| τ1=8.3 | τ2=59.2 | τ1=4.0 | τ2=84.5 | ||
| Poly[d(I-C)2] | a1=0.84 | a2=0.16 | a1=0.26 | a2=0.74 | |
| τ1=10.2 | τ2=42.0 | τ1=4.2 | τ2=80.7 | ||
| Poly[d(G-C)2] | a1=0.66 | a2=0.34 | a1=1.00 | ||
| τ1=8.5 | τ2=113.9 | τ1=110.2 | |||
Effect of oxygen species scavengers
The effect of various oxygen species scavengers (27–31) were tested in this work. Tiron and sodium azide, which are super oxide radical (·O2–) and singlet oxygen (1O2) scavengers, respectively, caused a large reduction in the efficiency with which the LD was decreased (Figure 4). In the presence of Tiron and sodium azide, the decay in the magnitude of the LD was fitted to two exponentials (Figure 4 and Table 3). The short component, τ1, appeared at 3.3 min in the presence of both Tiron and sodium azide, which may be explained by the disappearance of the shortest component (τ1=0.6 min) in the absence of the scavengers. The long component of the decay times, which corresponds to τ3 in the absence of scavengers, was increased to 162.2 and 157.4 min in the presence of Tiron and sodium azide, respectively. The magnitude of the LD decreased to slightly above 60% in both cases, as compared with that in the absence of the scavengers. The presence of catalase, which is a hydrogen peroxide (H2O2) scavenger, was not as efficient at inhibiting the oxidative cleavage as the above two scavengers, suggesting that the role of hydrogen peroxide is not as important in the oxidative cleavage of double-stranded DNA. The addition of formic acid, a hydroxyl radical (·OH) scavenger, to the DNA-EDTA·Fe2+–H2O2 mixture resulted in the complete loss of the LD signal (Figure 4, curve b) both in the absence and presence of EDTA·Fe2+ and H2O2 (Figure 5). There are two possible reasons for the disappearance of the LD spectrum: the aggregation of the DNA or excess absorbance. Because the absorption spectrum of DNA was similar to that of the DNA–formic acid mixture with the formic acid component subtracted, the aggregation of the DNA could be the reason for the disappearance of the LD signal (data not shown). Therefore, the role of hydroxyl radicals in the oxidative cleavage of DNA could not be investigated using the LD system. The effects of the scavengers on the cleavage of poly[d(A-T)2] are depicted in Figure 6. In the presence of catalase, the time-dependent change in the LD magnitude was similar to that in its absence (Figure 6, panel (b)), suggesting that H2O2 does not play any role in the oxidative cleavage of double-stranded DNA. Conversely, the presence of Tiron caused the disappearance of the short component (Figure 6, panel (a)), with a single component decay profile being observed at 201.4 min. Sodium azide inhibited the overall oxidative cleavage reaction (Figure 6, panel (c)), suggesting the importance of singlet oxygen (1O2) in the cleavage reaction. In the case of poly[d(G-C)2], the signal to noise ratio in the presence of scavengers was too low to deduce reliable data. The bad signal was due at least partially to the short length of poly[d(G-C)2].
Figure 4.

Time-dependent decrease in the magnitude of the LD of DNA at 260 nm in the presence of various oxygen radical species scavengers. [EDTA·Fe2+] = 200 μM, [H2O2] = 10 mM and [Ascorbate] = 50 μM. Curve a: in the absence of scavengers; and curve b: in the presence of formic acid (50 mM); curve c: Tiron (1 mM); curve d: catalase (0.125 unit/μl); curve e: sodium azide (5 mM).
Table 3.
The effects of various reactive oxygen species scavengers. [EDTA·Fe2+]=200 μM, [H2O2]=10 mM, [Ascorbate]=50 μM. [Tiron]=1 mM, [sodium azide]=5 mM, and [catalase]=0.125 unit/μl
| Scavengers | Decay component (min) and amplitudes | ||
|---|---|---|---|
| No scavenger | a1=0.20 | a2=0.20 | a3=0.60 |
| τ1=0.6 | τ2=7.3 | τ3=110.3 | |
| Tiron | a1=0.11 | a2=0.89 | |
| τ1=3.3 | τ2=162.2 | ||
| Sodium azide | a1=0.31 | a2=0.69 | |
| τ1=3.3 | τ2=157.4 | ||
| Catalase | a1=0.19 | a2=0.81 | |
| τ1=3.0 | τ2=80.9 | ||
Figure 5.

The LD spectra of DNA in the presence of formic acid at the time of mixing. Curve a: DNA (solid); curve b: DNA+200 μM EDTA·Fe2+, 10 mM H2O2 and 50 μM ascorbate (dashed); curve c: DNA+50 mM formic acid (dotted) and curve d: DNA+EDTA·Fe2++H2O2+ascorbate+formic acid.
Figure 6.

Time-dependent decrease in the magnitude of the LD of poly[d(A-T)2] at 260 nm in the presence of various oxygen radical species scavengers. [EDTA·Fe2+] = 200 μM, [H2O2] = 10 mM and [Ascorbate] = 50 μM. Panel (a): in the presence of Tiron (1 mM); panel (b): catalase (0.125 unit/μl); and panel (c): sodium azide (5 mM).
DISCUSSION
Factors that affect the LD magnitude during cleavage
The factors determining the magnitude of the LD of DNA in the flow-oriented system adopted in this work are the orientation and optical factors (23–26). The optical factors, which are related to the properties of the chromophore and angle of the electric transition moment of the given chromophore with respect to the flow direction, were assumed to be constant throughout the entire process. This assumption of the constancy of the optical factors was based on the similar absorption spectra of DNA observed both before and after its cleavage (data not shown), suggesting that the oxidation of a nucleobase, i.e. the alteration of the chromophore property, under the conditions adopted was not significant. Before and during the cleavage process, the double-stranded DNA contributes to the LD signal: the single-stranded DNA will not orient and; therefore, would not be expected to contribute to the LD signal. Hence, the angle between the nucleobase of the double-stranded DNA and the flow direction will remain constant, and therefore not contribute to the change in the magnitude of the LD. Therefore, it is solely the ability of orientation of the DNA that governs the magnitude of the LD in the set-up adopted in this work with a constant solvent, temperature and flow rate during the measurement. The ability of orientation of the DNA in the flow may be affected by two factors: the flexibility/rigidity and the length of the DNA. Cleaving one of the strands of the double helical DNA increases its flexibility, which induces bending or kinking at the cleaved site, causing a reduction in the magnitude of the LD. Cleavage at both strands results in a shortening of the DNA which also reduces the magnitude of the LD.
Cleavage of double-stranded DNA and synthetic polynucleotides
As previously mentioned, it is conceivable that the cleavage observed under our conditions occurred due to the oxidation of the sugar moiety rather than the modification of nucleobase, as the absorption spectra before and after cleavage were similar. It should also be noted that a zero LD signal does not necessarily indicate the complete cleavage of the DNA to nucleotides: even if the DNA remains double stranded, it is possible to result in a zero LD signal when the DNA is very short. Indeed, DNA below 400 base pairs did not produce any LD signal under similar conditions (data not shown).
The cleavage of the DNA at low EDTA·Fe2+/H2O2 concentrations can be described as a combination of two exponentials. It is logical to assign the fast component to single strand cleavage and the slow component to double strand breakage. As expected, the reaction times of both processes became faster with increasing EDTA·Fe2+ concentration. However, at high EDTA·Fe2+ concentrations, a very slow component appeared. It is not clear at this stage whether the apparent slow reaction reflects a slow down of the single or double strand breakage, or a totally new cleavage mechanism. The appearance of the long component was obviously related to the presence of excess EDTA·Fe2+; therefore, it is possible that EDTA·Fe2+ binds to DNA, inhibiting the action of reactive oxygen species. The cleavage of the synthetic polynucleotides; namely, poly[d(A-T)2], poly[d(I-C)2] and poly[(G-C)2] at a low EDTA·Fe2+ concentration can be described by a fast single strand cleavage and double strand breakage mechanism, similarly to that of DNA. The reaction times of both stages generally became longer than those of DNA. Although the reason for this is unclear, the differences in the base sequences may play some role. DNA has 16 variations of its base arrangement within two base pairs, which are linked by a sugar moiety, while the synthetic polynucleotides have only two variations: for instance, only the 5′GC3′ → 5′CG3′ or 5′CG3′ → 5′GC3′ block exists in poly[d(G-C)2]. In the presence of excess EDTA·Fe2+, both poly[d(A-T)2] and poly[d(I-C)2] exhibited two exponentials, probably due to their simple sequences, which is in contrast to that observed with DNA. The amplitude of the slow component became larger and the LD signal never reached zero in the presence of excess EDTA·Fe2+. When an amine group was present in the minor groove, as seen in the case of poly[d(G-C)2], the fast reaction was suppressed, suggesting that the presence of EDTA·Fe2+ and amine group in the minor groove is related to the inhibition of DNA cleavage. More explicitly, EDTA·Fe2+ may bind at the amine group in the minor groove thereby, suppressing the action of the reactive oxygen species. It is worth noting that the LD signal of poly[d(G-C)2] never reached zero, which was in contrast with both poly[d(A-T)2] and poly[d(I-C)2], also reflecting the inhibition of the amine group at the minor groove.
Role of scavengers
Under Fenton-type conditions with H2O2, hydroxyl radicals play an important role in the strand scission process (32). However, investigating the effect of a hydroxyl radical scavenger, formic acid, was not possible using our LD apparatus, because the aggregation of the DNA was induced, resulting in the disappearance of the LD signal of the DNA (Figures 4 and 5). In the case of both DNA and poly[d(A-T)2], the presence of either Tiron or sodium azide caused a significant reduction in the reaction rate (longer reaction time), but the LD signal never reached zero. This observation suggests that both super oxide radicals and singlet oxygen contribute to the cleavage reaction, particularly in the double strand breakage step in addition to the hydroxyl radical and anion, those are produced by the Fenton-type mechanism. The precise role of these oxygen species is not clear at this stage. Conversely, the addition of catalase had little effect on the decrease in the LD signal, suggesting that H2O2 does not play a significant role in the strand cleavage reaction. Alternatively, the amount of H2O2 (10 mM) may be too large for its action to be suppressed by 0.125 μg/μl catalase. As shown in Figures 5 and 6, the presence of scavengers caused the disappearance of the very fast component, which was assigned to the cleavage of one of the strands in the double helix.
CONCLUSION
The LD technique was shown to be useful for the investigation of DNA cleavage under Fenton-type conditions. The resistance against cleavage of the sugar moiety by reactive oxygen species was found to be stronger for poly[d(G-C)2] than for the other base pair combinations probably due to the amine group in the minor groove. Both super oxide radical and singlet oxygen play important roles in the cleavage of DNA by EDTA·Fe2+/H2O2 in addition to the hydroxyl radical and anion.
ACKNOWLEDGEMENTS
This work was supported by Korea Research Foundation (Grant no. KRF-2006-312-C00569). Funding to pay the Open Access publication charges for the article was provided by Yeungnam University.
Conflict of interest statement. None declared.
REFERENCES
- 1.Dedon PC, Goldberg IH. Free-radical mechanisms involved in the formation of sequence-dependent bistranded DNA lesions by the antitumor antibiotics bleomycin, neocarzinostatin, and calicheamicin. Chem. Res. Toxicol. 1992;5:311–332. doi: 10.1021/tx00027a001. [DOI] [PubMed] [Google Scholar]
- 2.Breen AP, Murphy JA. Reaction of oxyradicals with DNA. Free Rad. Biol. Med. 1995;18:1033–1077. doi: 10.1016/0891-5849(94)00209-3. [DOI] [PubMed] [Google Scholar]
- 3.Henle ES, Linn S. Formation, prevention, and repair of DNA damage by iron/hydrogen peroxide. J. Biol. Chem. 1997;272:19095–19098. doi: 10.1074/jbc.272.31.19095. [DOI] [PubMed] [Google Scholar]
- 4.Pogozelski WK, Tullius TD. Oxidative strand scission of nucleic acids: Routes initiated by abstraction from the sugar moiety. Chem. Rev. 1998;98:1089–1107. doi: 10.1021/cr960437i. [DOI] [PubMed] [Google Scholar]
- 5.Burrows CJ, Muller JG. Oxidative nucleobases modifications leading to strand scission. Chem. Rev. 1998;98:1109–1151. doi: 10.1021/cr960421s. [DOI] [PubMed] [Google Scholar]
- 6.Marnett LJ. Oxyradicals and DNA damage. Carcinogenesis. 2000;21:361–370. doi: 10.1093/carcin/21.3.361. [DOI] [PubMed] [Google Scholar]
- 7.Retsky KL, Freeman MW, Frei B. Ascorbic acid oxidation product(s) protect human low-density lipoprotein against atherogenic modification. J. Biol. Chem. 1993;268:1304–1309. [PubMed] [Google Scholar]
- 8.Ames BN, Shigenaga MK, Hagen TM. Oxidants, antioxidants, and the degenerative disease of aging. Proc. Natl Acad. Sci. USA. 1993;90:7915–7922. doi: 10.1073/pnas.90.17.7915. [DOI] [PMC free article] [PubMed] [Google Scholar]
- 9.Shigenaga MK, Hagen TM, Ames BN. Oxidative damage and mitochondrial decay in aging. Proc. Natl Acad. Sci. USA. 1994;91:10771–10778. doi: 10.1073/pnas.91.23.10771. [DOI] [PMC free article] [PubMed] [Google Scholar]
- 10.Cooke MS, Evans MD, Dizdaroglu M, Lunec J. Oxidative DNA damage: mechanism, mutation and disease. FASEB J. 2003;17:1195–1214. doi: 10.1096/fj.02-0752rev. [DOI] [PubMed] [Google Scholar]
- 11.Grey CE, Adlercreutz P. Evaluation of multiple oxidation products for monitoring effects of antioxidants in Fenton oxidation of 2′-deoxyguanosine. J. Agric. Food Chem. 2006;54:2350–2358. doi: 10.1021/jf052202q. [DOI] [PubMed] [Google Scholar]
- 12.Theruvathu JA, Aravindakumar CT, Flyunt R, von Sonntag J, von Sonntag C. Fenton chemistry of 1,3-dimethyluracil. J. Am. Chem. Soc. 2001;123:9007–9014. doi: 10.1021/ja0109794. [DOI] [PubMed] [Google Scholar]
- 13.Henle ES, Han Z, Tang N, Rai P, Luo Y, Linn S. Sequence-specific DNA cleavage by Fe2+-mediated Fenton reactions has possible biological implications. J. Biol. Chem. 1999;274:962–971. doi: 10.1074/jbc.274.2.962. [DOI] [PubMed] [Google Scholar]
- 14.Tuntiwechapikul W, Salazar M. Cleavage of telomeric G-quadruplex DNA with perylene-EDTA·Fe(II) Biochemistry. 2001;40:13652–13658. doi: 10.1021/bi011363u. [DOI] [PubMed] [Google Scholar]
- 15.Matsufuji H, Shibamoto T. The role of EDTA in malonaldehyde formation from DNA oxidized by Fenton reagents systems. J. Agric. Food Chem. 2004;52:3136–3140. doi: 10.1021/jf035337+. [DOI] [PubMed] [Google Scholar]
- 16.Ghosh SS, Eis PS, Blumeyer K, Fearon K, Millar DP. Real time kinetics of restriction endonuclease cleavage monitored by fluorescence resonance energy transfer. Nucleic Acids Res. 1994;22:3155–3159. doi: 10.1093/nar/22.15.3155. [DOI] [PMC free article] [PubMed] [Google Scholar]
- 17.Kettling U, Koltermann A, Schwille P, Eigen M. Real-time enzyme kinetics monitored by dual-color fluorescence cross-correlation spectroscopy. Proc. Natl Acad. Sci. USA. 1998;95:1416–1420. doi: 10.1073/pnas.95.4.1416. [DOI] [PMC free article] [PubMed] [Google Scholar]
- 18.Rarbach M, Kettling U, Koltermann A, Eigen M. Dual-color fluorescence cross-correlation spectroscopy for monitoring the kinetics of enzyme-catalyzed reactions. Methods. 2001;24:104–116. doi: 10.1006/meth.2001.1172. [DOI] [PubMed] [Google Scholar]
- 19.Hiller DA, Fogg JM, Martin AM, Beechem JM, Reich NO, Perona JJ. Simultaneous DNA binding and bending by EcoRV endonuclease observed by real-time fluorescence. Biochemistry. 2003;42:14375–14385. doi: 10.1021/bi035520w. [DOI] [PubMed] [Google Scholar]
- 20.Hicks MR, Rodger A, Thomas CM, Batt SM, Dafforn TR. Restriction enzyme kinetics monitored by UV linear dichroism. Biochemistry. 2006;45:8912–8917. doi: 10.1021/bi0601712. [DOI] [PubMed] [Google Scholar]
- 21.Gabibov A, Yakubovskaya E, Lukin M, Favorov P, Reshetnyak A, Monastyrsky M. Catalytic transformations of supercoiled DNA as studied by flow linear dichroism technique. FEBS J. 2005;272:6336–6343. doi: 10.1111/j.1742-4658.2005.05027.x. [DOI] [PubMed] [Google Scholar]
- 22.Tuite E, Sehlstedt U, Hagmar P, Nordén B, Takahashi M. Effects of minor groove-binding drugs and intercalators on the DNA association of minor groove-binding proteins RecA and deoxyribonuclease I detected by flow linear dichroism. Eur. J. Biochem. 1997;243:482–492. doi: 10.1111/j.1432-1033.1997.0482a.x. [DOI] [PubMed] [Google Scholar]
- 23.Rodger A, Nordén B. Circular Dichroism and Linear Dichroism. Oxford: Oxford University Press; 1997. [Google Scholar]
- 24.Nordén B, Kubista M, Kurucsev T. Linear dichroism spectroscopy of nucleic acids. Q. Rev. Biophys. 1992;25:51–170. doi: 10.1017/s0033583500004728. [DOI] [PubMed] [Google Scholar]
- 25.Nordén B, Kurucsev T. Analysing DNA complexes by circular and linear dichroism. J. Mol. Rocognit. 1994;7:141–156. doi: 10.1002/jmr.300070211. [DOI] [PubMed] [Google Scholar]
- 26.Matsuoka Y, Nordén B. Linear dichroism studies on nucleic acids. II. Calculation of reduced linear dichroism curves of A- and B-form DNA. Biopolymer. 1981;21:2433–2452. doi: 10.1002/bip.360211208. [DOI] [PubMed] [Google Scholar]
- 27.Mao Y, Zang L, Shi X. Singlet oxygen generation in the superoxide reaction. Biochem. Mol. Biol. Int. 1995;36:227–232. [PubMed] [Google Scholar]
- 28.Park JH, Troxel AB, Harvey RG, Penning TM. Polycyclic hydrocarbon (PAH) o-quinones produced by the aldo-keto-reductases (AKRs) generate abasic sites, oxidized pyrimidines, and 8-oxo-dGuo via reactive oxygen species. Chem. Res. Toxicol. 2006;19:719–728. doi: 10.1021/tx0600245. [DOI] [PMC free article] [PubMed] [Google Scholar]
- 29.Milligan JR, Aguilera JA, Nguyen TT, Ward JF, Kow YW, He B, Cunningham RP. Yield of DNA strand breaks after base oxidation of plasmid DNA. Radiat. Res. 1999;151:334–343. [PubMed] [Google Scholar]
- 30.Oikawa S, Kawanishi S. Distinct mechanisms of site-specific DNA damage induced by endogenous reductants in the presence of iron(III) and copper(II) Biochim. Biophys. Acta. 1998;1399:19–30. doi: 10.1016/s0167-4781(98)00092-x. [DOI] [PubMed] [Google Scholar]
- 31.Li AS-H, Bandy B, Tsang S.-S, Davison AJ. DNA breakage induced by 1,2,4-benzenetriol: relative contributions of oxygen-derived active species and transition metal ions. Free Rad. Bio. Med. 2001;30:943–956. doi: 10.1016/s0891-5849(01)00478-6. [DOI] [PubMed] [Google Scholar]
- 32.Pogozelski WK, McNeese TJ, Tullius TD. What species is responsible for strand scission in the reaction of [FeIIEDTA]2− and H2O2 with DNA? J. Am. Chem. Soc. 1995;117:6428–6433. [Google Scholar]