

Abstract
A methodology for the detection of protein biomarkers at picomolar concentrations that utilizes surface plasmon resonance imaging (SPRI) measurements of RNA aptamer microarrays is developed. The adsorption of proteins onto the RNA microarray is detected by the formation of a surface aptamer-protein-antibody complex. The SPRI response signal is then amplified using a localized precipitation reaction catalyzed by the enzyme horseradish peroxidase that is conjugated to the antibody. This enzymatically amplified SPRI methodology was first characterized by the detection of human thrombin at a concentration of 500 fM; the appropriate thrombin aptamer for the sandwich assay was identified from a microarray of three potential thrombin aptamer candidates. The SPRI method was then used to detect the protein vascular endothelial growth factor (VEGF) at a biologically relevant concentration of 1 pM. VEGF is a signaling protein that has been used as a serum biomarker for rheumatoid arthritis, breast cancer, lung cancer and colorectal cancer, and is also associated with age-related macular degeneration.
I. Introduction
The rapid detection and profiling of multiple protein biomarkers in blood and serum samples is a potentially powerful method for the diagnosis of diseases and the monitoring of subsequent therapeutic treatments.1, 2 For example, antibody arrays that can detect up to 120 serum biomarkers for the early stage detection and diagnosis of various cancers are currently available commercially from Whatman Inc. These antibody assays typically use a second set of fluorescently tagged antibodies for the detection of biomarker adsorption to the array elements.3, 4
Microarrays of RNA aptamers are emerging as an attractive alternative to antibody arrays for the multiplexed bioaffinity detection and identification of protein biomarkers.5–8 Compared to antibodies, nucleic acid aptamers are less susceptible to irreversible denaturation, are more amenable to chemical modification, and can be identified by in vitro (as compared to in vivo for antibodies) selection methods.9–12 Surface RNA aptamer structures can also be reversibly deactivated by the hybridization adsorption of a complementary DNA sequence, and can be regenerated by the subsequent desorption of DNA from the aptamer array element.
Surface plasmon resonance imaging has been established as one of the primary optical methods for the direct detection of bioaffinity adsorption onto DNA, protein and RNA microarrays.13–18 We have recently employed SPRI for the detection of protein adsorption onto RNA aptamer microarrays down to a concentration of 10 nM.19 A detection limit of 10 nM is sufficient for the analysis of some biomarkers (e.g., β2-microglobulin and cystatin C)20; however, many important protein biomarkers are present in biological samples at much lower concentrations. For example, the signaling protein vascular endothelial growth factor (VEGF) exists in serum samples at picomolar concentrations and has been identified as a potential biomarker for rheumatoid arthritis and various cancers.21–24
For the detection of biomarkers at subpicomolar concentrations in biological samples, enzymatic amplification of the biosensor response is often required. For example, ELISA microwell or membrane assays that use horseradish peroxidase (HRP) conjugated antibodies with either a fluorogenic or chemiluminescent substrate can be used in solution to detect proteins down to femtomolar concentrations.25, 26 These solution-based fluorescence methods have limited spatial resolution and therefore cannot be used in a surface microarray format. In contrast, an HRP substrate such as 3, 3′, 5, 5′-tetramethylbenzidine (TMB) that creates a localized surface precipitation reaction can be used in surface biosensor microarrays with high spatial resolution. This localized precipitation reaction can be detected with either optical or electrochemical methods.27, 28
In this paper, we show that HRP conjugated antibodies can be used with SPRI measurements of RNA aptamer microarrays to detect protein biomarkers down to subpicomolar concentrations with a localized precipitation reaction. An RNA aptamer/protein biomarker/antibody-HRP sandwich structure is formed on the microarray surface, and a subsequent localized HRP-TMB precipitation reaction is used to amplify the SPRI response due to specific protein biomarker adsorption onto the RNA aptamer array. The SPRI measurements have a subpicomolar sensitivity; as a first example, human thrombin protein was detected at a concentration of 500 fM using an RNA aptamer identified from a microarray of three potential thrombin aptamer candidates. The protein detection sensitivity of SPRI was improved by a factor of 10,000 through the use of the HRP-TMB precipitation reaction. This amplified method was then used with a second RNA aptamer array to detect the protein biomarker VEGF at a biologically relevant concentration of 1 pM.
II. Experimental Considerations
Materials
11-amino-1-undecanethiol hydrochloride (MUAM; Dojindo), sulfosuccinimidyl 4-(N-maleimidomethyl)cyclohexane-1-carboxylate (SSMCC; Pierce), 9-fluorenylmethoxycarbonyl-N-hydroxysuccinimide (Fmoc-NHS; Novabiochem) and N-hydroxysuccinimidyl ester of methoxypoly (ethylene glycol) propionic acid (MW 2000) (PEG-NHS; Nektar Therapeutics) were all used as received. All unmodified RNA sequences (PAGE purified) were purchased from Dharmacon Research Inc. The DNA anchor probe with 3′-thiol modification and 5′-phosphorylation and the thrombin DNA aptamer D1 with 3′-thiol modification were purchased from Integrated DNA Technologies and were deprotected and purified using reverse-phase binary elution HPLC. All RNA and DNA sequences are listed in Table 1. Human thrombin (Haematologic Technologies Inc.), unmodified thrombin antibody and horseradish peroxidase conjugated thrombin antibody (Enzyme Research), recombinant human vascular endothelial growth factor (VEGF) (165-amino acid residues; Sigma-Aldrich), biotinylated anti-VEGF antibody (R&D Systems), anti-biotin horseradish peroxidase (Jackson ImmunoResearch), T4 RNA ligase (Epicentre Biotechnology) were all diluted to the desired concentration before use. HEPES buffer (20 mM HEPES, 150 mM NaCl, 2 mM CaCl2, pH 7.4) was used for all thrombin measurements. PBS buffer (10.0 mM Na2HPO4, 137 mM NaCl, 2.7 mM KCl, pH 7.4) was used for all VEGF measurements. The stock solution of tetramethylbenzidine (TMB) substrate (BioFX Laboratories; TMB one component small particle membrane substrate, proprietary concentration) was diluted 10 times in either HEPES buffer (thrombin detection) or PBS buffer (VEGF detection) for the surface precipitation reactions. All buffers and water were autoclaved prior to use.
Table 1.
Summary of all DNA and RNA sequences used for the enzymatically amplified SPRI detection of hTh and VEGF. Fifteen thymine bases were attached to the 3′ end of the D1 aptamer as a spacer to place the aptamer further away from the surface. Eight adenosine bases were added to the 3′ ends of RNA aptamers R1, R2 and RV to facilitate the surface ligation reaction.
| DNA anchor probe: |
|---|
| 5′-PO42−-TT(A)18-(CH2)6-S-S-3′ |
| Thrombin DNA aptamer (D1): |
| 5′-AGT CCG TGG TAG GGC AGG TTG GGG TGA CT-(T)15-(CH2)6-S-S-3′ |
| Thrombin RNA aptamer 1 (R1): |
| 5′-GGG AAC AAA GCU GAA GUA CUU ACC C (A)8-3′ |
| Thrombin RNA aptamer 2 (R2): |
| 5′-UUU GGA AGA UAG CUG GAG AAC UAA CCA AA (A)8-3′ |
| VEGF RNA aptamer (RV): |
| 5′-CCG GUA GUC GCA UGG CCC AUC GCG CCC GG (A)8-3′ |
| Control RNA aptamer (RC): |
| 5′-AGA CUC UGA CUC AGU G-3′ |
DNA Microarray Fabrication
DNA microarrays were fabricated using a seven-step chemical modification process described previously.29 Thin gold films (45 nm) were deposited onto SF-10 glasses (Schott Glass) using a Denton DV-502A metal evaporator with a 1 nm underlayer of chromium. The gold surfaces were first modified with a self-assembled monolayer of the amine-terminated alkanethiol MUAM. This MUAM surface was then reacted with Fmoc-NHS to form a hydrophobic background. Next the Fmoc surface was exposed to UV light with a quartz mask containing 500 μm square features to create bare gold spots within the hydrophobic Fmoc background. The bare gold spots were then reacted with MUAM for 2 h followed by the SSMCC reaction. The SSMCC solution was manually spotted using a pico-pump onto the MUAM array elements to form a thiol-reactive maleimide-terminated surface. Thiol-modified DNA sequences were then spotted onto the individual SSMCC array elements and allowed to react overnight. Upon completion of the DNA attachment reaction, the DNA array was thoroughly rinsed with sterile Millipore water, dried in a nitrogen stream, and used immediately for the creation of RNA microarrays via surface RNA-DNA ligation reactions.
Aptamer Microarray Fabrication
RNA aptamer microarrays were fabricated using a surface RNA-DNA ligation methodology catalyzed by the enzyme T4 RNA ligase as described previously.19 In brief, a DNA anchor probe with 3′-thiol and 5′-phosphate modifications (see Table 1 for the sequence) was immobilized on a chemically modified gold surface via a surface thiol/maleimide reaction to create a DNA microarray containing identical DNA sequences in each array element. Various unmodified single-stranded RNA (ssRNA) sequences were then ligated to individual DNA array elements using T4 RNA ligase. T4 RNA ligase and ssRNA were mixed in a 40 mM Tris buffer (10 mM MnCl2, 100 μM ATP and 10 mM DTT, pH 7.5) to have a final concentration of 0.2 units/μL and 10 μM, respectively. Approximately 30 nL of this reaction mixture was then manually spotted using a pico-pump to each 500 μm × 500 μm DNA array element and allowed to react for 3 h at room temperature. For the case of aptamer microarrays containing DNA aptamer array elements, the 3′-thiol modified DNA aptamer was immobilized as described in the previous section and no ligation solution was spotted to array elements containing the DNA aptamer. After the ligation reaction was completed, the microarray was thoroughly rinsed with sterile Millipore water to remove the enzyme and any non-ligated RNA. Next the microarray was exposed to a mildly basic solution to remove the Fmoc hydrophobic background and to regenerate the amine-terminated MUAM surface. The MUAM surface was then reacted with PEG-NHS to create a background resistant to the non-specific adsorption of biomolecules. The RNA microarray was finally rinsed with sterile Millipore water, dried in a nitrogen stream and used for SPRI measurements.
SPR Imaging Measurements
An SPR imager (GWC Technologies) using near-infrared excitation from an incoherent white light source was used for the enzymatically amplified detection of thrombin and VEGF proteins. A simplified scheme of the SPR imager set-up is shown in Figure S.1 in the Supporting Information. Briefly, the white light beam is passed through a polarizer to generate p-polarized light, which then impinges on a prism/thin gold film assembly at a fixed incident angle slightly smaller than the SPR angle. The reflected light is collected with a CCD camera after passing through a narrow band-pass filter centered at 830 nm. SPRI data were collected using the software V++ 4.0 (Digital Optics) and further analyzed using NIH Image 1.63.
III. Results and Discussion
Enzymatically amplified SPRI measurements of RNA aptamer microarrays are used to identify and detect proteins at subpicomolar concentrations. Figure 1 illustrates the scheme of the enzymatic reaction for the amplified SPRI detection of proteins. A surface immobilized aptamer is used to capture the proteins onto the RNA microarray, and then an antibody conjugated with horseradish peroxidase (HRP) is bound to the array element via the formation of an aptamer-protein-antibody sandwich structure. On the addition of the substrate tetramethylbenzidine (TMB), HRP catalyzes the localized formation of a dark blue precipitate that is detected using SPRI measurements. This enzymatically amplified SPRI methodology was characterized by the detection of human thrombin (hTh), a 37 kD serine protease which is commonly used to enhance clot formation in blood samples,30 and then employed for the detection of VEGF, a 42 kD signaling protein that stimulates new blood vessel formation in cells.31
Figure 1.
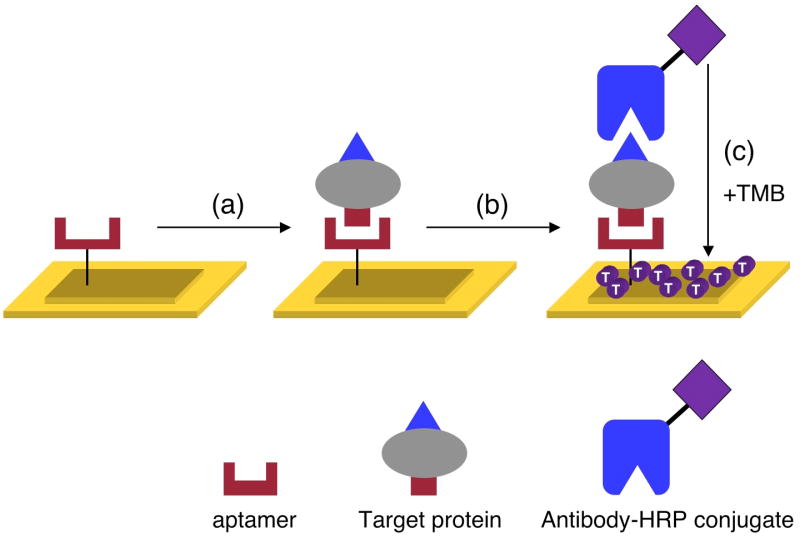
Schematic outlining the enzymatically amplified SPRI detection of target proteins. In step (a), the target protein binds to the surface immobilized aptamer. Next in step (b), an HRP conjugated antibody to the target protein is introduced to create a surface aptamer-protein-antibody sandwich structure. In step (c), this surface is exposed to the substrate tetramethylbenzidine (TMB), which reacts with HRP to form a dark blue precipitate on the array elements containing the aptamer-protein-antibody complex. A very small amount of this precipitate on the gold surface results in a significantly amplified SPRI response.
Section A details how SPRI was used to select the best thrombin aptamer for the formation of aptamer-hTh-antibody structures from a number of thrombin aptamer candidates. Section B presents the detection of hTh at subpicomolar concentrations using the enzymatically amplified SPRI methodology. Finally, Section C describes a modified sandwich assay that employs a biotinylated VEGF antibody and an anti-biotin conjugated HRP for the detection of VEGF at picomolar concentrations with SPRI.
A. SPRI Measurements of Aptamer-Thrombin-Antibody Structures
Several researchers have independently generated RNA and DNA aptamers that bind to thrombin in an effort to modulate the activity of thrombin in the blood coagulation process.32–34 The structures of these aptamer-thrombin complexes have been carefully characterized in solution previously, and they can serve as a good model system for the study of aptamer-protein and aptamer-protein-antibody structures on surfaces.
To successfully detect target proteins using the aptamer-protein-antibody sandwich structure, the aptamer and antibody must bind to different sites on the target protein. If the same binding site is involved, the aptamer-protein-antibody sandwich structure will not be created. This geometric requirement is illustrated schematically in Figure 2. Sequential SPRI measurements of thrombin and antibody adsorption onto RNA microarrays can determine which antibody-aptamer pairs will form surface sandwich structures.
Figure 2.
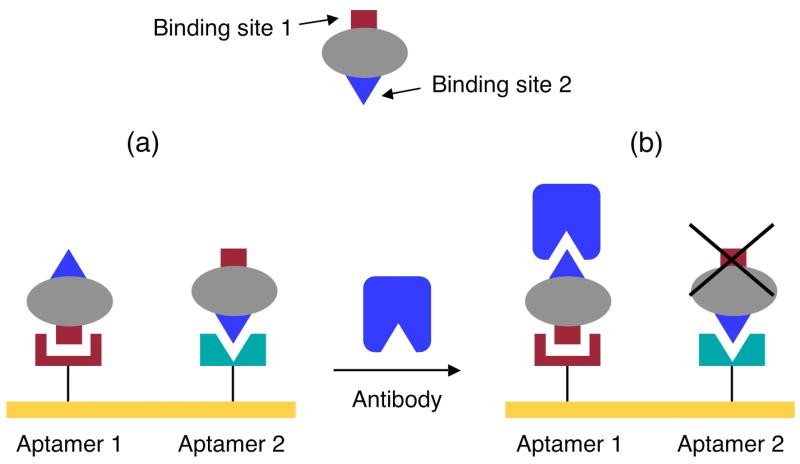
Schematic illustration for the formation of a surface aptamer-protein- antibody sandwich structure. (a) Two different aptamers 1 and 2 that bind to the same target protein are attached to the surface. The target protein binds to the two aptamers via different binding sites: aptamer 1 binds to binding site 1 on the protein while aptamer 2 binds to binding site 2 on the protein. (b) When an antibody that binds to binding site 2 on the target protein is introduced, only aptamer 1, but not aptamer 2, will form a surface aptamer-protein-antibody sandwich structure.
A four-component microarray that consisted of three previously developed thrombin aptamers32–34 and one control RNA aptamer sequence was fabricated for these SPRI experiments. A schematic diagram of the four aptamer sequences as well as the spatial pattern of the aptamer microarray is shown in Figure 3. The thrombin RNA aptamer R1 and thrombin DNA aptamer D1were both developed with binding affinity to human thrombin (hTh).33, 34 In the D1 aptamer, the eight boxed guanine bases form a G-quadruplex that contributes to the binding of thrombin.34 Thrombin RNA aptamer R2 was originally selected with affinity to bovine thrombin, but can also bind to hTh.32 The control sequence RV is an RNA aptamer with binding affinity to VEGF that will be used in section C.
Figure 3.

Structures of the aptamers used in a four-component microarray for the identification of a thrombin aptamer to be used for thrombin detection in a surface sandwich assay. The four aptamer array elements are: R1, an RNA aptamer for human thrombin; D1, a DNA aptamer for human thrombin; R2, an RNA aptamer that was selected for bovine thrombin but can also bind to human thrombin; RV, an RNA aptamer for the human vascular endothelial growth factor (VEGF). The boxed guanine bases in the D1 aptamer form a G-quadruplex structure (not pictured) that is responsible for human thrombin binding. RV was used as a negative control in the thrombin detection. The pattern of the four-component microarray is shown at the top of this figure.
Two sequential in situ SPRI measurements on this microarray allowed us to identify which aptamer(s) can form the surface aptamer-hTh-antibody sandwich structure. The first SPRI measurement, shown in Figure 4a, was used to determine the amount of hTh adsorption onto the microarray from a 10 nM solution. All three thrombin aptamers showed some binding affinity to hTh, with the D1 aptamer being the highest. A second SPRI measurement, shown in Figure 4b, was obtained after subsequent exposure of the array to a 10 nM solution of a monoclonal antibody for hTh. A significant SPRI signal increase was observed only at the R2 array elements, indicating that the antibody could only bind to the hTh-R2 aptamer surface complex.
Figure 4.

In situ SPRI measurements of the sequential binding of hTh and hTh antibody to a four-component microarray composed of R1, D1, R2 and RV. The pattern of the microarray is shown in Figure 3. (a) Surface adsorption of 10 nM hTh onto the microarray. The SPR difference image was obtained by subtracting images taken before and after the introduction of hTh. The line profile was taken from the last row on the difference image. All three of the thrombin aptamers, R1, R2, and D1, showed binding to hTh, but with different binding affinities. D1 has the highest affinity to thrombin, and R1 has the lowest. (b) Binding of 10 nM HRP conjugated hTh antibody to the surface bound hTh molecules. The SPR difference image was obtained by subtracting images acquired before and after the adsorption of hTh antibody with the corresponding line profile at the bottom taken across the last row of this difference image. No significant antibody binding was observed at the D1 array elements. The R1 aptamer array elements showed a decrease in signal due to the removal of surface bound hTh molecules. Only R2 array elements exhibited significant antibody binding that suggests the formation of a surface aptamer-hTh-antibody sandwich structure.
This set of experiments demonstrates that only the R2 aptamer binds to hTh at a different site as compared to the antibody. It is not surprising that R2, an aptamer originally selected for bovine thrombin, can also bind to human thrombin since there is an 85% homology between the two proteins.32 For the aptamer array elements which bind to the same site as the antibody, two results are possible: the hTh stays on the surface, and very little antibody adsorption is observed (as seen with the D1 elements), or the hTh is removed from the surface by the antibody (as seen with the R1 elements). No non- specific adsorption of hTh or antibody binding was observed onto the control aptamer elements RV.
These SPRI results agree with what is known of how these aptamers interact with hTh in solution. Human thrombin has an active catalytic site and two exosites; exosite I is implicated in the binding of fibrinogen, thrombomodulin, hirudin, and heparin cofactor II, and exosite II is primarily responsible for the binding to glycosaminoglycan, heparin and monoclonal antibody.35–37 Both aptamer D1 and R1 have been reported previously to bind to the heparin binding site—exosite II,33, 34 which is also the binding site to the monoclonal thrombin antibody.37 This is consistent with our SPRI results that no antibody binding was observed for hTh molecules bound to either D1 or R1. The R2 binding site on hTh has not been specifically reported previously, but from our SPRI measurements we can conclude that R2 does not bind to exosite II. Using these results, we will exclusively use the R2 aptamer in the enzymatically amplified SPRI detection of hTh in the next section.
B. Subpicomolar Thrombin Detection with Enzymatically Amplified SPRI
Having identified the appropriate RNA aptamer to form the surface aptamer-protein-antibody structure, the surface precipitation reaction catalyzed by the enzyme horseradish peroxidase (HRP) was characterized with the detection of hTh at subpicomolar concentrations using enzymatically amplified SPRI. HRP has been used previously in conjunction with various detection techniques including fluorescence, SPR and electrochemical methods for amplified detection of DNA and proteins.25, 27, 38 This amplification reaction was necessary in order to lower the SPRI detection limit for hTh from nanomolar concentrations down to subpicomolar concentrations. An antibody conjugated with HRP was employed in the formation of the surface sandwich structure; Figure 5a shows schematically how the antibody-HRP conjugate formed a complex with hTh and the R2 aptamer on the array element surface.
Figure 5.

Enzymatically amplified SPRI detection of 500 fM hTh. (a) Schematic showing the surface R2 aptamer-hTh-HRP conjugated antibody sandwich structure. This was created by sequentially flowing hTh and the HRP conjugated monoclonal hTh antibody onto a surface immobilized R2 aptamer. (b) Pattern of the three-component RNA microarray composed of R2, RV, and RC for hTh detection. R2 is the RNA aptamer for hTh, RV is the RNA aptamer for VEGF, and RC is a control RNA sequence with no hairpin structures (see Table 1 for sequences). (c) An SPR difference image obtained from the detection of 500 fM hTh using the HRP enzymatic amplification reaction. Only R2 aptamer array elements showed a 1.6% increase in ΔR.
The SPRI measurements employed a three-component microarray consisted of the thrombin aptamer R2, the VEGF aptamer RV and a control RNA sequence RC (see Figure 5b for the array pattern and Table 1 for all RNA sequences). The microarray was first exposed to a 500 fM hTh solution for 15 minutes, and then a 10 nM solution of the antibody-HRP conjugate for 10 minutes, followed by TMB for 10 minutes, and finally rinsed with buffer. The SPR difference image of this array before and after exposure to TMB is shown in Figure 5c. An SPRI reflectivity change (ΔR) of 1.6±0.2% was observed only on the R2 microarray elements due to the precipitation of TMB caused by the surface bound HRP enzyme. Only an extremely small amount of precipitation was observed on the PEG array background possibly due to non-specific adsorption of the antibody-enzyme conjugate that has resulted in precipitation at these locations. Compared with the 2.0% ΔR observed for a 10 nM hTh solution in Figure 4a, a 1.6% ΔR for a 500 fM hTh solution corresponds to an enhancement factor of ~104. The SPRI signal from different array elements on the same microarray varied slightly with a standard deviation of less than 15%; the chip-to-chip variation of SPRI signal was found to be in a similar range.
The responsivity of this amplified SPRI method to thrombin adsorption was estimated with two additional SPRI measurements at thrombin concentrations of 1 pM (4.1±0.6Δ%R) and 2 pM (8.7±1.3 Δ%R). The three data points (including our lowest concentration measurement at 0.5 pM) yielded a linear relationship between concentration and Δ%R with a slope of 4.7 (±0.1) Δ%R/pM. Above a ΔR of 10%, this SPRI responsivity decreased as predicted by theory.17 The protein concentration range over which the SPRI signal responds linearly can be optimized by adjusting the concentrations of both the hTh antibody-HRP conjugate and TMB substrate.
As mentioned previously, a little amount of non-localized precipitation was observed in Figure 5c. This additional precipitation is not due to the non-specific adsorption of either protein or antibody onto the microarray, because no non-specific adsorption onto the RNA microarray elements or the PEG background was observed in the SPRI experiments at higher nanomolar protein and antibody concentrations as shown in Figures 4a and 4b. A possible source for the non-localized precipitation is the desorption of antibody-HRP conjugates during the final rinse step and introduction of TMB. We attribute the lack of non-specific adsorption of proteins or antibodies in these experiments to the use of RNA aptamer microarrays instead of antibody microarrays, where we have observed non-specific protein interactions with antibodies previously.20
C. Picomolar VEGF Detection with Enzymatically Amplified SPRI
The surface HRP-TMB enzymatic precipitation reaction was next used for the amplified SPRI detection of the protein biomarker VEGF at a biologically relevant concentration. The concentration of VEGF is normally about 7 pM in the serum; however, patients with certain diseases such as breast cancer and rheumatoid arthritis can have a considerably higher VEGF concentration.23, 24 A set of RNA aptamers for human VEGF that have all been shown to bind to the heparin binding site on the protein have been previously developed by Jellinek et al.39 One of these aptamers has been successfully applied in an antibody sandwich assay for the detection of VEGF, implying that the anti-VEGF antibody does not bind to the heparin binding site.40 We therefore chose an RNA aptamer from the same set with a high binding affinity (denoted as RV; see Table 1 for the sequence) to use in the amplified SPRI measurements.
For the detection of VEGF with enzymatically amplified SPRI, we used a modified sandwich assay shown in Figure 6a. In this instance, a biotinylated VEGF antibody is employed to form the sandwich structure, and then an anti-biotin conjugated HRP is used to attach the enzyme to this antibody. As in the previous thrombin experiments, the precipitation of TMB by HRP is used to detect the presence of VEGF on the microarray. The SPRI measurements employed a three-component RNA microarray composed of R2, RV and RC (see Figure 6b for array pattern).
Figure 6.

Enzymatically amplified SPRI detection of 1 pM VEGF. (a) Schematic illustrating the surface sandwich structure formed by the sequential adsorption of VEGF (1 pM), a biotinylated VEGF antibody (10 nM), and an anti-biotin conjugated HRP (50 nM) onto VEGF aptamer array elements. (b) Pattern of the three-component RNA microarray consisting of R2, RV, and RC for VEGF detection. The RNA sequences are listed in Table 1. (c) An SPR difference image obtained from the detection of 1 pM VEGF with the HRP enzymatic amplification reaction. A ΔR increase of ~4.0% was observed at only the RV array elements.
The VEGF detection sensitivity of the enzymatically amplified SPRI measurements is demonstrated in Figure 6c. The RNA microarray was first exposed to a 1 pM VEGF solution for 15 minutes, then a 10 nM solution of the VEGF antibody for 10 minutes, the anti-biotin HRP solution (50 nM) for 10 minutes, and finally the TMB solution. The SPR difference image before and after exposure to TMB is shown in Figure 6c. An SPRI reflectivity change (ΔR) of +4.0% was observed at only the RV array elements, indicating the presence of VEGF at these spots. Neither non-specific adsorption nor extraneous precipitation was observed on the background or the non-interacting RNA array elements R2 and RC.
The detection of a 1 pM solution of VEGF with enzymatically amplified SPRI is a great improvement over conventional SPRI measurements. Direct adsorption of VEGF onto surface immobilized aptamers can only be detected with SPRI at concentrations higher than 10 nM. Detection of VEGF at picomolar concentrations is well below that needed for the analysis of VEGF from human plasma or serum samples.
IV. Conclusions
In this paper, we have used a combination of RNA aptamers and antibodies to detect protein biomarkers at picomolar concentrations with HRP-TMB enzymatically amplified SPRI measurements of RNA aptamer microarrays. This sensitivity level is a 10,000 fold improvement over conventional SPRI measurements of protein adsorption onto RNA aptamer microarrays, and is comparable to the sensitivity observed in fluorescence antibody sandwich assays.
Note that this detection method requires both an RNA aptamer and an antibody that binds to a different site on the target protein. However, since this antibody is not attached to the surface, issues of surface antibody activity and immobilization are avoided.
Moreover, as additional RNA aptamers are discovered in the future, it should be possible to totally eliminate the antibody from this detection approach by replacement with a second biotinylated RNA aptamer. The development of new RNA aptamers with strong binding affinities will also allow for the creation of larger scale aptamer microarrays for the simultaneous analysis of multiple protein biomarkers.
Supplementary Material
Acknowledgments
This research was supported by the National Institute of Health (2RO1 GM059622-04) and the National Science Foundation (CHE-0551935).
References
- 1.de Seny D, Fillet M, Meuwis MA, Geurts PL, Laurence RC, Bours V, Wehenkel L, Piette J, Malaise M, Merville MP. Arthritis Rheum. 2006;52:3801–3812. doi: 10.1002/art.21607. [DOI] [PubMed] [Google Scholar]
- 2.Poon TC, Sung JJY, Chow SM, Ng EKW, Yu ACW, Chu ESH, Hui AMY, Leung WK. Gastroenterology. 2006;130:1858–1864. doi: 10.1053/j.gastro.2006.02.011. [DOI] [PubMed] [Google Scholar]
- 3.Sapsford KE, Charles PT, Patterson CHJ, Ligler FS. Anal Chem. 2002;74:1061–1068. doi: 10.1021/ac0157268. [DOI] [PubMed] [Google Scholar]
- 4.Silzel JW, Cercek B, Dodson C, Tsay T, Obremski RJ. Clin Chem. 1998;44:2036–2043. [PubMed] [Google Scholar]
- 5.Collett JR, Cho EJ, Lee JF, Levy M, Hood AJ, Wan C, Ellington AD. Anal Biochem. 2005;338:113–123. doi: 10.1016/j.ab.2004.11.027. [DOI] [PubMed] [Google Scholar]
- 6.Stadtherr K, Wolf H, Lindner P. Anal Chem. 2005;77:3437–3443. doi: 10.1021/ac0483421. [DOI] [PubMed] [Google Scholar]
- 7.Bock C, Coleman M, Collins B, Davis J, Foulds G, Gold L, Greef C, Heil J, Heilig JS, Hicke B, Hurst MN, Miller D, Ostroff R, Petach H, Schneider D, Vant-Hull B, Waugh S, Weiss A, Wilcox SK, Zichi D. Proteomics. 2004;4:609–618. doi: 10.1002/pmic.200300631. [DOI] [PubMed] [Google Scholar]
- 8.McCauley TG, Hamaguchi N, Stanton M. Anal Biochem. 2003;319:244–250. doi: 10.1016/s0003-2697(03)00297-5. [DOI] [PubMed] [Google Scholar]
- 9.Bunka DHJ, Stockley PG. Nat Rev Microbiol. 2006;4:588–596. doi: 10.1038/nrmicro1458. [DOI] [PubMed] [Google Scholar]
- 10.Brody EN, Gold L. Rev Mol Biotechnol. 2000;74:5–13. doi: 10.1016/s1389-0352(99)00004-5. [DOI] [PubMed] [Google Scholar]
- 11.Nimjee SM, Rusconi CP, Sullenger BA. Annu Rev Med. 2005;56:555–583. doi: 10.1146/annurev.med.56.062904.144915. [DOI] [PubMed] [Google Scholar]
- 12.Jayasena S. Clin Chem. 1999;45:1628–1650. [PubMed] [Google Scholar]
- 13.Phillips KS, Wilkop T, Wu JJ, Al-Kaysi RO, Cheng Q. J Am Chem Soc. 2006;128:9590–9591. doi: 10.1021/ja0628102. [DOI] [PubMed] [Google Scholar]
- 14.Wolf LK, Fullenkamp DE, Georgiadis RM. J Am Chem Soc. 2005;127:17453–17459. doi: 10.1021/ja056422w. [DOI] [PubMed] [Google Scholar]
- 15.Shumaker-Parry JS, Campbell CT. Anal Chem. 2004;76:907–917. doi: 10.1021/ac034962a. [DOI] [PubMed] [Google Scholar]
- 16.Kanda V, Kariuki JK, Harrison DJ, McDermott MT. Anal Chem. 2004;76:7257–7262. doi: 10.1021/ac049318q. [DOI] [PubMed] [Google Scholar]
- 17.Nelson BP, Grimsrud TE, Liles MR, Goodman RM, Corn RM. Anal Chem. 2001;73:1–7. doi: 10.1021/ac0010431. [DOI] [PubMed] [Google Scholar]
- 18.Goodrich TT, Lee HJ, Corn RM. Anal Chem. 2004;76:6173–6178. doi: 10.1021/ac0490898. [DOI] [PubMed] [Google Scholar]
- 19.Li Y, Lee HJ, Corn RM. Nucleic Acids Res. 2006;34 doi: 10.1093/nar/gkl738. in press. [DOI] [PMC free article] [PubMed] [Google Scholar]
- 20.Lee HJ, Nedelkov D, Corn RM. Anal Chem. 2006;78:6504–6510. doi: 10.1021/ac060881d. [DOI] [PubMed] [Google Scholar]
- 21.Kuramochi H, Hayashi K, Uchida K, Miyakura S, Shimizu D, Vallbohmer D, Park S, Danenberg KD, Takasaki K, Danenberg PV. Clin Cancer Res. 2006;12:29–33. doi: 10.1158/1078-0432.CCR-05-1275. [DOI] [PubMed] [Google Scholar]
- 22.Raben D, Ryan A. Clin Lung Cancer. 2005;7:175–179. doi: 10.3816/CLC.2005.n.032. [DOI] [PubMed] [Google Scholar]
- 23.Nakahara H, Song J, Sugimoto M, Hagihara K, Kishimoto T, Yoshizaki K, Nishimoto N. Arthritis Rheum. 2003;48:1521–1529. doi: 10.1002/art.11143. [DOI] [PubMed] [Google Scholar]
- 24.Adams J, Carder PJ, Downey S, Forbes MA, MacLennan K, Allgar V, Kaufman S, Hallam S, Bicknell R, Walker JJ, Cairnduff F, Selby PJ, Perren TJ, Landsdown M, Banks R. Cancer Res. 2000;60:2898–2905. [PubMed] [Google Scholar]
- 25.Roda A, Mirasoli M, Guardigli M, Michelini E, Simoni P, Magliulo M. Anal Bioanal Chem. 2006;384:1269–1275. doi: 10.1007/s00216-006-0308-6. [DOI] [PubMed] [Google Scholar]
- 26.Huang RP. J Immunol Methods. 2001;255:1–13. doi: 10.1016/s0022-1759(01)00394-5. [DOI] [PubMed] [Google Scholar]
- 27.Kim SD, Chung JW, Kim JTHK, Pyun JC. Sens Actuators, B. 2005;111–112:463–469. [Google Scholar]
- 28.Zhong X-b, Leng L, Beitin A, Chen R, McDonald C, Hsiao B, Jenison RD, Kang I, Park S-H, Lee A, Gregersen P, Thuma P, Bray-Ward P, Ward DC, Bucala R. Nucleic Acids Res. 2005;33:e121. doi: 10.1093/nar/gni123. [DOI] [PMC free article] [PubMed] [Google Scholar]
- 29.Brockman JM, Frutos AG, Corn RM. J Am Chem Soc. 1999;121:8044–8051. [Google Scholar]
- 30.Jackson MR. Am J Surg. 2001;182:1S–7S. doi: 10.1016/s0002-9610(01)00770-x. [DOI] [PubMed] [Google Scholar]
- 31.Risau W. Nature. 1997;386:671–674. doi: 10.1038/386671a0. [DOI] [PubMed] [Google Scholar]
- 32.Liu X, Cao G, Ding H, Zhang D, Yang G, Liu N, Fan M, Shen B, Shao N. FEBS Lett. 2004;562:125–128. doi: 10.1016/S0014-5793(04)00197-8. [DOI] [PubMed] [Google Scholar]
- 33.White RR, Rusconi CP, Scardino E, Wolberg A, Lawson J, Hoffman M, Sullenger BA. Mol Ther. 2001;4:567–573. doi: 10.1006/mthe.2001.0495. [DOI] [PubMed] [Google Scholar]
- 34.Tasset DT, Kubik MF, Steiner W. J Mol Biol. 1997;272:688–698. doi: 10.1006/jmbi.1997.1275. [DOI] [PubMed] [Google Scholar]
- 35.Di Cera E. Chest. 2003;124:11S–17S. doi: 10.1378/chest.124.3_suppl.11s. [DOI] [PubMed] [Google Scholar]
- 36.Verhamme IM, Olson ST, Tollefsen DM, Bock PE. J Biol Chem. 2002;277:6788–6798. doi: 10.1074/jbc.M110257200. [DOI] [PubMed] [Google Scholar]
- 37.Colwell NS, Blinder MA, Tsiang M, Gibbs CS, Bock PE, Tollefsen DM. Biochemistry. 1998;37:15057–15065. doi: 10.1021/bi980925f. [DOI] [PubMed] [Google Scholar]
- 38.Kim MG, Shin YB, Jung JM, Ro HS, Chung BH. J Immunol Methods. 2005;297:125–132. doi: 10.1016/j.jim.2004.12.007. [DOI] [PubMed] [Google Scholar]
- 39.Jellinek D, Green LS, Bell C, Janjic N. Biochemistry. 1994;33:10450–10456. doi: 10.1021/bi00200a028. [DOI] [PubMed] [Google Scholar]
- 40.Drolet DW, Moon-McDermott L, Romig TS. Nat Biotechnol. 1996;14:1021–1025. doi: 10.1038/nbt0896-1021. [DOI] [PubMed] [Google Scholar]
Associated Data
This section collects any data citations, data availability statements, or supplementary materials included in this article.