Abstract
Although deamidation at asparagine and glutamine has been shown in numerous studies of a variety of proteins, in almost all cases the analytical methodology used could detect only a single site of deamidation. For the extensively studied case of reduced bovine ribonuclease A (13,689 Da), only Asn67 deamidation has been demonstrated previously, although one study found three monodeamidated fractions. Here top down tandem mass spectrometry shows that Asn67 deamidation is nearly complete before Asn71 and Asn94 react; these are over half deamidated before Asn34 reacts, and its deamidation is extensive before that at Gln74 is initiated. Except for the initial Asn67 site, these large reactivity differences correlate poorly with neighboring amino acid identities and instead indicate residual conformational effects despite the strongly denaturing media used; deamidation at Asn67 could enhance that at Asn71, and these enhance that at Gln74. This success in the site-specific quantitation of deamidation in a 14 kDa protein mixture, despite the minimal 1 Da (–NH2 → –OH) change in the molecular weight, is further evidence of the broad applicability of the top down MS/MS methodology for characterization of protein posttranslational modifications.
Deamidation of proteins, common both in vivo and in vitro, has been studied extensively because of its important biological effects such as those on enzymatic activity (1-4), folding (5, 6), and proteolytic degradation (7, 8). Deamidation has also been proposed to serve as a molecular clock (9-11). However, characterization of the sites and extent of deamidation has been a difficult analytical problem, with almost all determinations limited to the qualitative identification of a single deamidation site. Recently, top down tandem mass spectrometry (MS/MS) (12-16) has proved uniquely useful for kinetic studies of multicomponent protein systems (17-19). After MS separation of the target protein's molecular ions, further MS dissociation yields fragment ions whose mass shifts show which amino acids have been modified. However, deamidation has the special challenge that its covalent modification –NH2 → –OH causes only a 0.984 Da mass increase, closely matching the 1.002 Da (20) spacing of the molecular ion isotope peaks (Figure 1A). Although this makes difficult the usual MS/MS isolation of product ions for their separate characterization, here top down MS/MS clearly delineates five stepwise deamidation sites in reduced bovine pancreatic ribonuclease A (RNase A, Mr = 13,689). Asn67, the site found here to be highly favored, is the only site previously found with certainty (2, 3, 5-7).
FIGURE 1.
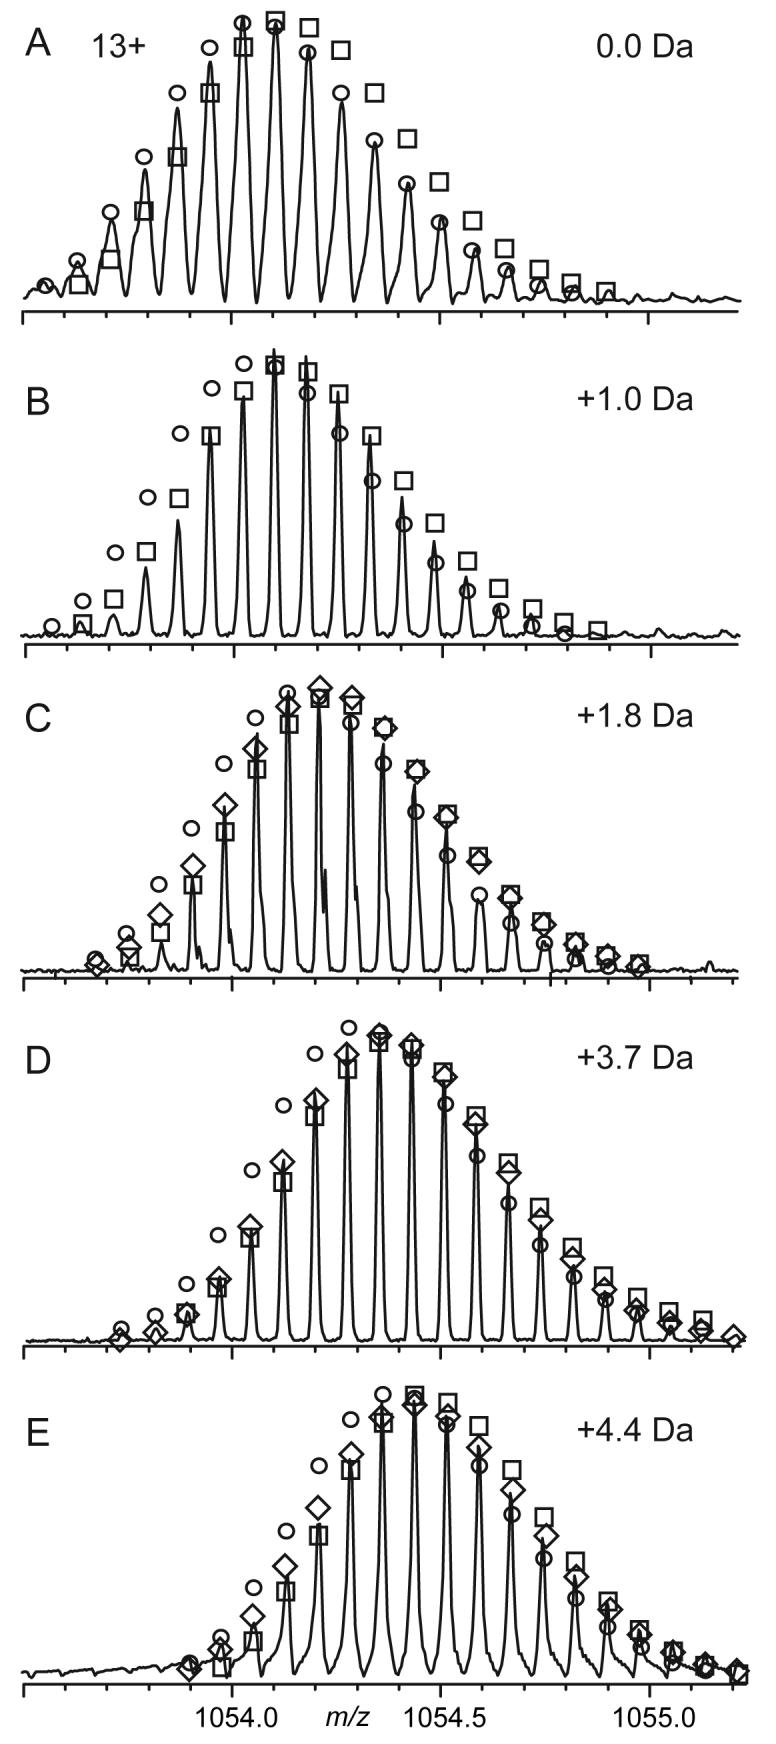
ESI spectra of RNase, 13+ molecular ions: (A) untreated, and (B-E) after deamidation that caused a mass increase of 1.0, 1.8, 3.7, and 4.4 Da. ○, □: best fit of the theoretical abundance distribution corresponding to the protein deamidated at n and n+1 sites, respectively. ◇: best fit of the indicated fractional number of deamidations.
Rates of deamidation of asparaginyl (Asn) and glutaminyl (Gln) residues depend on protein primary sequence, three-dimensional structure, and solution parameters; increased pH, temperature, and denaturation accelerate the process (11, 21-23). Deamidation of Asn is generally favored over that of Gln, in part through operation of a cyclic imide reaction mechanism that also favors the Asn67 – Gly68 sequence found in RNase A (21, 22), while other neighboring residues also show an influence statistically (11, 23). However, some Asn and Gln residues are extremely resistant to in vivo deamidation (10).
In “bottom up” MS proteomics, initial digestion of the protein gives peptides whose mass spectra often provide a fast, reliable identification of the protein, but are of far less value for characterizing posttranslational modifications. In top down MS/MS, electrospray ionization (ESI) of a protein mixture introduces their gaseous molecular ions into a Fourier-transform MS (12-19). For a specific protein, an accurate molecular weight differing from that of the gene-model predicted value indicates sequence errors, alternative splicing, protein or RNA editing, and/or posttranslational modifications. These discrepancies can be identified and located by MS/MS separation and dissociation of the protein molecular ions, using methods such as collisionally activated dissociation (CAD) (24, 25), infrared multiphoton dissociation (IRMPD) (26), or electron capture dissociation (ECD) (27, 28). CAD and IRMPD cleave –CO—NH– bonds to produce b, y fragment ions, and ECD cleaves –NH—CHR– bonds to produce mainly c, z• ions. Here for reduced RNase A, these techniques establish five deamidation sites, as well their kinetic order of deamidation, that indicate extensive conformational selectivity despite the strong denaturing conditions employed.
EXPERIMENTAL PROCEDURES
Materials
Bovine pancreatic ribonuclease A, type XII (Sigma), was used without further purification for the deamidation experiments involving isoelectric focusing. Alternatively, RNase A was pre-purified by ion-exchange chromatography on a 2.5 × 45 cm S-Sepharose column (Pharmacia) equilibrated with 25 mM HEPES (pH 8.0) containing 1 mM EDTA at 25°C using a linear gradient of 0-150 mM NaCl over 1000 min at 2 mL/min prior to deamidation.
Deamidation
RNase A (10 mg/mL) in 0.1 M glycine/NaOH buffer (pH 9.6) containing 100 mM DTTred was incubated at 78°C, conditions chosen to accelerate the reaction. Fresh DTTred was added periodically to keep the protein fully reduced. After 1h of treatment, the protein mixture was separated on a Hydropore SCX 4.6 × 100mm analytical cation exchange HPLC column (Rainin Instrument Co.) and eluted with 25 mM HEPES (pH 7) containing 1 mM EDTA by increasing the concentration of NaCl, with the major fractions collected as Samples B and C. Samples collected after 3.5 and 4.2 h of treatment were brought up to 17 ml in 7 M urea containing 30 mM DTT and 2.2% of carrier ampholytes (pI 5-8) (Bio-Rad) and the most deamidated products concentrated in a Rotofor preparative isoelectric focusing device (Bio-Rad) for 3 h at 4°C. Fractions with pH 6.5 and 6.9 were analyzed as Samples D and E.
MS Analysis
Protein samples were reduced with 20 mM DTTred and desalted on a reverse-phase protein trap (Michrom Bioresources Inc.), washed with 2 ml of 0.1:99:0.5 MeCN/H2O/CH3COOH (v/v/v), and eluted with 150 μl 50:45:5 MeCN/H2O/CH3COOH. This eluent was loaded into a nanospray ESI emitter (2-4 μm i.d. tip), with 1.0-1.5 kV versus the MS inlet producing a flow rate of 20-100 nL·min−1. The resulting ions were guided into the ion cell (10−9 Torr) of a modified 6 T Finnigan FTMS device (30). Fragmentation was achieved by plasma ECD (31) or IRMPD (26) for ions entering the FTMS cell, or by isolating specific ions in the cell using stored waveform inverse Fourier transform (SWIFT) (32) followed by CAD (25). Fragment assignments were made with the computer program THRASH (20). The mass difference (in units of 1.00235 Da) between the most abundant isotopic peak and the monoisotopic peak is denoted in italics after each Mr value.
RESULTS
The ESI mass spectrum of the 13+ molecular ions of reduced RNase A (Figure 1A) consists of a series of isotopic peaks (most abundant, 13,689.3-8; calculated 13,689.3-8Da) 1.0024 Da apart (20) whose relative intensities are predictable (circles) from the protein elemental composition. Deamidation (Figures 1B-E) produces a 0.9840 Da increase in mass (–NH2 → –OH) for each of the isotopic peaks, so that the mass spectrum of a mixture of deamidation products will have peaks at virtually identical masses, but of overlapping peak intensities. Purification by HPLC or isoelectric focusing ensured that each sample contained no more than two levels of deamidation, and the relative amounts of each that would give the observed isotopic peak intensities were calculated.
Note that the alternative measurement of the deamidation peaks by high resolution is far more difficult than indicated by the nominal mass difference of 0.0183 Da. Each of the “isotopic” peaks of Figure 1 from each degree of deamidation is also a composite of peaks of other isotopic compositions that are also isobaric (same nominal mass). Among these peaks within the 13,689.3-8 “peak” of Figure 1A will be those containing 13C815N034S0, 13C715N134S0, and 13C615N034S1 (with the other atoms as their most abundant isotopes) of relative abundances 100, 83, and 80%, with the last two lower in mass by 0.0064 and 0.0110 Da, respectively. High resolution could have been used on small fragment peaks that have few isobaric peaks, or on RNAse A synthesized from 13C/15N/34S depleted precursors (19, 33).
Deconvolution of overlapping isotopic distributions
RNase A was deamidated in denaturing alkaline conditions for 1, 3.5 and 4.2 hours. Further separation of the one-hour sample by cation exchange gave a chromatogram with three peaks of relative areas 5:43:52. These should represent products with different number of deamidated residues (e.g., 0, 1, and 2), as each deamidation adds a negative charge to the protein. The ESI mass spectra of the last two fractions had the most abundant peak at 13690.2-8 Da and 13691.6-8 Da, respectively (Figure 1B, C; 1A, 13,689.3-8). The relative isotopic abundances of Figure 1B are in good agreement with the calculated abundance distribution (circles) for reduced RNase A shifted by +1.0 Da (squares), so that most of fraction 2 is singly deamidated, consistent with the chromatographic separation. Fraction 3 gave an isotopic abundance distribution (Figure 1C) intermediate between those calculated distributions corresponding for single (circles) and double (squares) deamidation, while the distribution calculated for a 1:4 ratio agreed closely with experiment (Figure 1C, diamonds), indicating an average of 1.8 deamidations. The 3.5 and 4.2 hour deamidation products were subjected to isoelectric focusing to select the ∼25% and ∼15%, respectively, fractions whose mass spectra indicated that they represented more highly deamidated species. These gave overlapping isotopic distributions corresponding to 3.7 (Figure 1D) and 4.4 (Figure 1E) deamidations, respectively. Thus the sampling times do not directly indicate the kinetic behavior, which is assumed to be exponential, and the samples will be designated by their deamidation degree: 0.0, 1.0, 1.8, 3.7, and 4.4 (Figure 1).
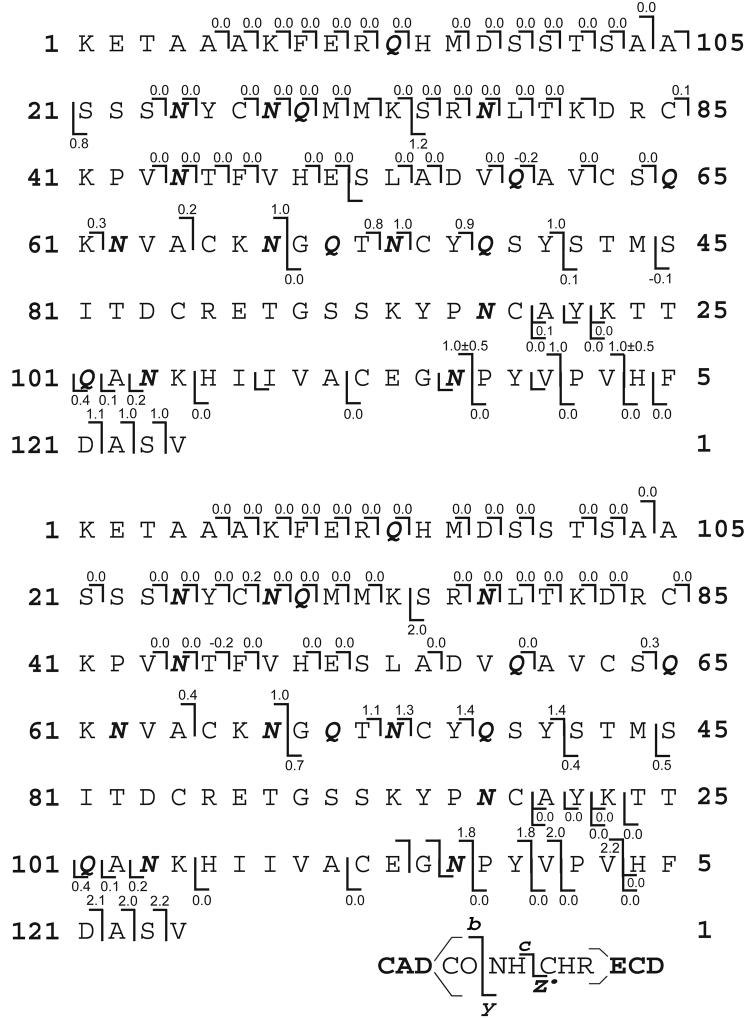
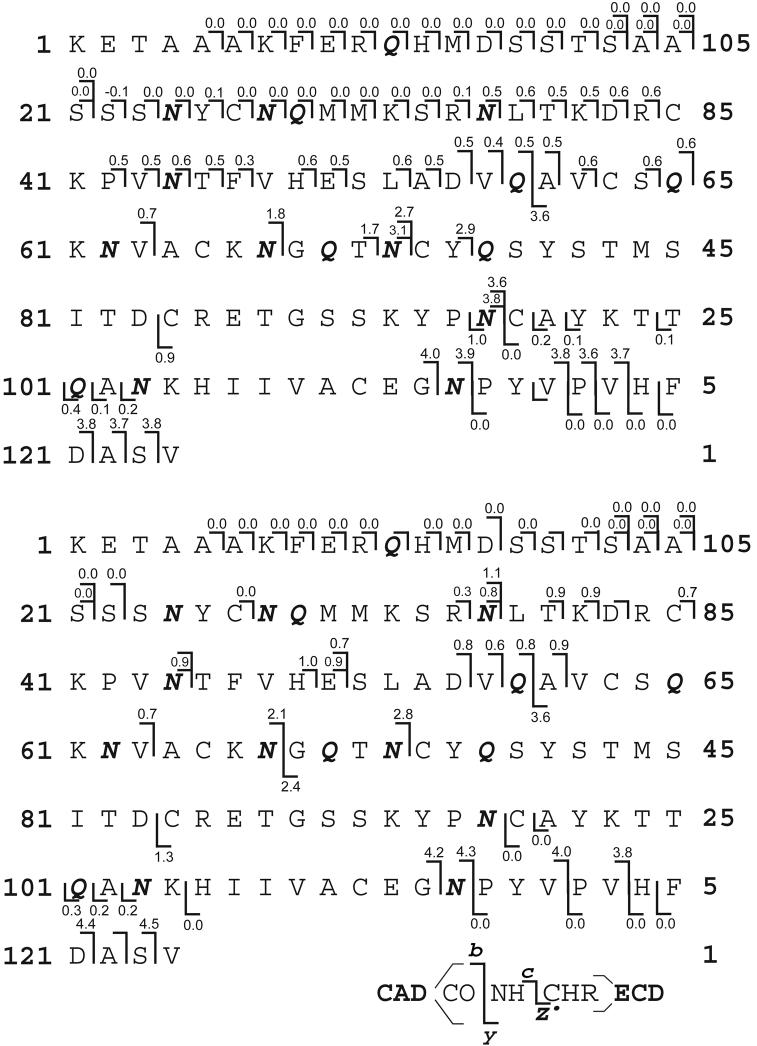
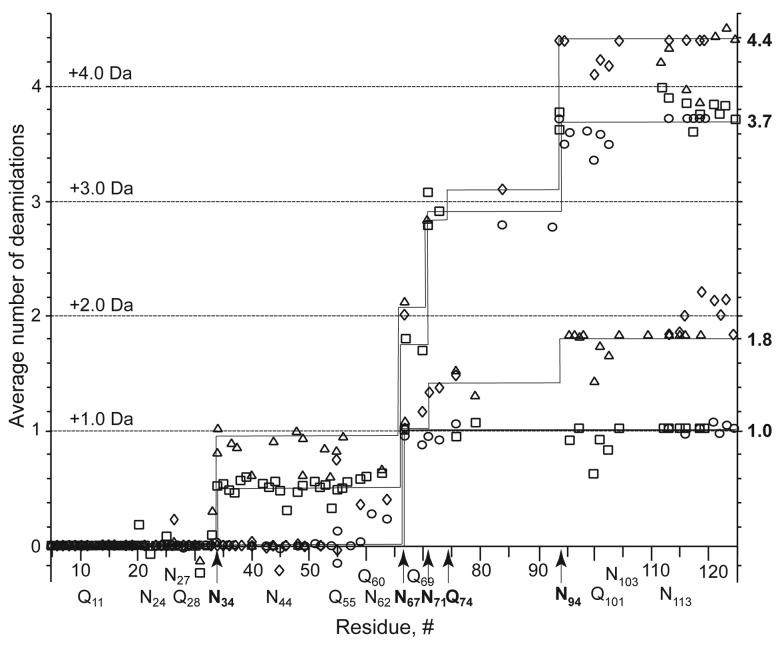
These overlapping molecular ions that could represent more than one degree of deamidation were then dissociated by CAD and IRMPD to produce b and y fragment ions and by ECD to produce c, z·, and y fragment ions. Their overlapping fragment peak isotopic clusters were deconvoluted as in Figure 1, with the deamidation values shown in Figures 2 and 3. The precision of these values depends on peak intensities (not shown) and increases with decreasing mass. Plots of these values (calculated to 2 decimal places, Figure 4) show the increasing deamidation versus each of the Asn and Gln sites of RNase A for the four product samples. Besides the expected deamidation products Asp and Glu, isomers such as isoaspartic acid can also be formed (3-6). No effort was made here to differentiate such products, although this was recently achieved for peptides with ECD MS (34).
FIGURE 2.
Deamidation values at specific residues for samples of (Top) 1.0 and (Bottom) 1.8 deamidations using cleavage assignments (as designated at Figure bottom) from ECD, CAD and IRMPD spectra of RNAse molecular ions. Values on each fragmentation symbol determined as in Figure 1.
FIGURE 3.
Deamidation values at specific residues for samples of (Top) 3.7 and (Bottom) 4.4 deamidations, as in Figure 2.
FIGURE 4.
Deamidation map of the RNAse sequence from the values of Figures 2 and 3. Symbols for (b or c) and (y or z·) fragment ions, respectively: 1.0 deamidations: ○, □. 1.8: ◇, △. 3.7: □, ○. 4.4: △, ◇. The deamidation value shown for a y or z· (C-terminal) ion represents the difference between its observed value and that of its parent ions.
DISCUSSION
Monodeamidated fraction
For the 1 hr deamidation products, the isotopic abundance distribution of the Sample B molecular ions (Figure 1B) shows a mass shift (1.0) corresponding closely to the unitary deamidation expected from the cation exchange chromatogram. MS/MS cleaved 69 of the 123 interresidue bonds (Figure 2, top), with nearly all fragments containing zero or one deamidation, within experimental error. For the fragment ions containing the N-terminus (b, c), all with 60 amino acids or less show deamidation values close to 0.0, while all with 67 or more show values of ∼1.0. Except for the c61 and b64 values, this restricts the site to Asn67, an assignment consistent with most previous ion studies of RNase A (3-5, 7). In support, the C-terminal y and z· ions with 57 residues (Asn67 – Gly68 cleavage) or less have deamidation values of ∼0.0, while those with 75 or greater have values of ∼1.0. The c61 value of 0.3 (possible deamidation at Gln60) and b64 value of 0.2 (Gln60 and/or Asn62) have not increased appreciably in the dideamidated Sample C spectrum (Figures 2, bottom, and 4), so that the corresponding values of Figure 2 (top) should represent an unidentified interference or noise. Under our conditions, Asn67 is not only the first residue in RNase A to deamidate, but this is nearly complete in 1 hr (0:1:2 deamidations = 5:43:52), with <10% monodeamidation at other sites. The three monodeamidated fractions separated previously (2, 29) apparently were isomeric Asn67 deamidates.
Dideamidated fraction
Sample C of 1.8 deamidations yields (Figure 2, bottom) seven N-terminal fragment ions b113or larger that show 1.8 – 2.2 deamidations, showing that this cation exchange fraction is dominated by dideamidated products. As shown also by Figure 4, this additional deamidation is on the C-terminal side of Asn67, and the values of ∼0.0 for C-terminal fragment ions as large as 29 residues show that deamidation has not occurred above Asn94. The complementary c76 and y48 fragments have a cumulative deamidation of 1.4 + 0.4 = 1.8, so that the next deamidation is occurring competitively on both sides of bond 76. Asn94 is the only possibility on the C-terminal side. The 1.1, 1.3, 1.4, and 1.4 values for the c70, 71, 73, 76 fragments indicate substantial deamidation at Asn71; the possible assignment of Gln69 is not supported by the 3.7 deamidation sample data, vide infra. Thus, the far slower secondary deamidations at Asn71 and Asn94 have started at approximately equivalent rates within 1 hr, possibly with their rates increased by deamidation at Asn67.
Sample with 3.7 deamidations
For the ∼25% fraction of the 3.5 hr sample separated to give the highest extent of deamidation, MS/MS spectra (Figures 3, top; 4) showed that the N-terminal fragment ions smaller than 34 residues and the C-terminal ions smaller than 31 residues exhibit mainly 0.0 values, demonstrating that deamidation is localized between Asn34 and Asn94. Completed deamidation at the three sites Asn67, 71, 94 identified in the 1 hr sample accounts for 3.0 of the 3.7 total deamidations, based on b63 = 0.7 (c59 = b60 = 0.6) and b94 = 3.6 (c94 = 3.8). Of the remaining 0.7 deamidations, ∼0.5 correspond to the 23 c and b fragment ions of 34 to 63 residues, demonstrating that now ∼50% of Asn34 is deamidated. An early study (21) found that hydroxylamine cleaved the Asn67 – Gly68 bond of RNase A with minor cleavage at Asn34 – Leu35. The remaining small difference of ∼0.2 deamidations cannot be assigned within experimental error to a specific site.
Sample with 4.4 deamidations
MS/MS spectra of the ions from the ∼15% most deamidated fraction of the 4.2 hr product (Figures 3, bottom; 4) indicate that Asn34 has become almost fully (0.9) deamidated; now Asn34, 67, 71, 94 account for 3.9 of the 4.4 total deamidations. Most of the remainder must occur at new sites after Asn71 (b71 = 2.8) and before Asn94 (z•29 = y30 = 0.0), indicating Gln74 as the new site with ∼0.5 deamidations (although, within experimental error, minor deamidation at Asn103 is also possible).
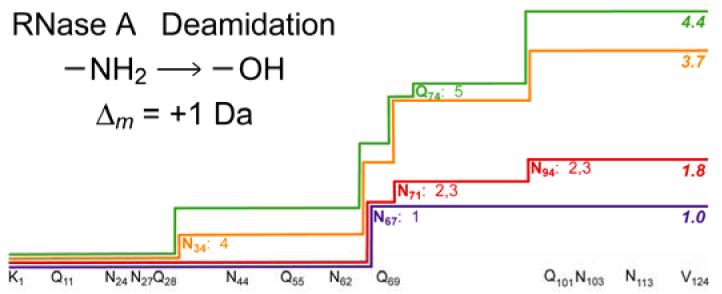
The one site identified in previous studies, Asn67, deamidates the most rapidly, followed by Asn71 and Asn94 at similar rates, followed by deamidation at Asn34 and finally at Gln74, with six asparagines and six glutamines unreacted. The possibility that a significant product from reaction at one of these sites was lost in separating a protein with the same number of deamidations seems remote, as this would require a significant difference in their pI values. Calculations (35) predict that proteins with the same number of deamidations, but at different sites, will have the same pI values to two decimal places, while 0 to 4 deamidations give values of 8.64, 8.43, 8.15, 7.70 and 7.03, respectively.
Enhanced CAD/IRMPD at Asp
For protein ions from ESI undergoing CAD and IRMPD, a 4.5x higher, on average, probability of cleavage was found for the C-terminal side of Asp versus that of Asn (36). This possible higher N-terminal fragment yield at Asp vs Asn could erroneously inflate a partial deamidation value for that site from IRMPD or CAD, but not a true 0.0 or 1.0 value, or an ECD value. This appears to have no appreciable effect on the conclusions above: the b67 fragment ion is always formed from fully deamidated Asn67, and the b71 and b94 values of Figure 3 (top) and b34 of Figure 3 (bottom) are lower than the corresponding c71, c94, and c34 values.
Influence of neighboring residues
In earlier studies (2, 3, 7, 22), the identity of the amino acids adjacent to Asn and Gln has shown some correlation with preferential deamidation. The fastest deamidation at Asn67 has been found to occur through a cyclic imide of its -Asn-Gly- sequence (22, 23), but none of the other 16 Asn/Gln residues in RNase A are followed by a Gly residue. Although a preference has been found for the deamidation of Asn and Gln residues with a neighboring Ser or Thr (23), here there is evidence for deamidation in only half of such sequences in RNase A. Deamidation via such a neighboring nucleophile mechanism could possibly provide an explanation for the -Asn-Cys- sequences of the second and the third deamidation sites, but these possible rate increases could arise from the initial Asn67 reaction (vide supra).
The reduced, denaturing conditions employed here not only accelerated the naturally slow deamidation of RNase A, but should also have minimized conformational effects; RNase A reduced under similar conditions is considered to be a model for a statistical coil without residual structure (37, 38). However, the non-random distribution of the Asn34, Asn67, Asn71, Gln74, and Asn94 deamidation sites out of the seventeen possible suggests instead a non-random conformational distribution, as shown recently for the reduced form of RNase A under mild folding conditions (39, 40).
In summary, the top down MS/MS approach has been applied successfully to characterize deamidated isoforms of bovine ribonuclease A. Out of seventeen possible deamidation sites, of which only one was implicated in numerous previous studies (2, 3, 5-7, 22), five have been identified. Their rates differ substantially and are reasonably competitive at only two sites, Asn71 and Asn94, as established using a combination of CAD, IRMPD and ECD fragmentation techniques. The success here, despite a deamidation change of only +1.0 Da, further demonstrates the applicability of this methodology to characterize and quantitate a wide variety of chemical modifications to proteins (17-19).
For Table of Contents Use Only
Acknowledgments
We are grateful to Cynthia Kinsland from the Protein Purification Facility, Department of Chemistry and Chemical Biology, for help with preparative isoelectrofocusing, and to Jean-Benoit Peltier, Sabine Baumgart, Mahesh Narayan, and Kathrin Breuker for helpful discussions.
1Abbreviations:
- FT MS
Fourier transform mass spectrometry
- ESI
electrospray ionization
- DTTred
reduced dithiothreitol
- SWIFT
stored waveform inverse Fourier transform
- CAD
collisionally activated dissociation
- IRMPD
infrared multiphoton dissociation
- ECD
electron capture dissociation
- RNase A
bovine pancreatic ribonuclease A
- HEPES
N-(2-hydroxyethyl)-piperazine-N′-2-ethanesulfonic acid
Footnotes
This work was supported by grant MCB 0090942 from the National Science Foundation to KJvW and grants GM24893 to HAS and GM16609 to FWM from the National Institute of General Medical Sciences of the National Institutes of Health.
REFERENCES
- 1.Flatmark T, Sletten K. Multiple forms of cytochrome c in the rat. J. Biol. Chem. 1968;243:1623–1629. [PubMed] [Google Scholar]
- 2.Venkatesh YP, Vithayathyl PJ. Isolation and characterization of monodeamidated derivatives of bovine pancreatic ribonuclease A. Int. J. Peptide Res. 1984;23:494–505. doi: 10.1111/j.1399-3011.1984.tb02750.x. [DOI] [PubMed] [Google Scholar]
- 3.Di Donato A, Ciardiello MA, de Nigris M, Piccoli RL, Mazzarella L, D'Alessio G. Selective deamidation of ribonuclease A. Isolation and characterization of the resulting isoaspartyl and aspartyl derivatives. J. Biol. Chem. 1993;268:4745–4751. [PubMed] [Google Scholar]
- 4.Solstad T, Carvalho RN, Andersen OA, Waidelich D, Flatmark T. Deamidation of labile asparagine residues in the autoregulatory sequence of human phenylalanine hydroxylase. Eur. J. Biochem. 2003;270:929–938. doi: 10.1046/j.1432-1033.2003.03455.x. [DOI] [PubMed] [Google Scholar]
- 5.Catanzano F, Graziano G, Capasso S, Barone G. Thermodynamic analysis of the effect of selective monodeamidation at asparagine 67 in ribonuclease A. Protein Sci. 1997;6:1682–1693. doi: 10.1002/pro.5560060808. [DOI] [PMC free article] [PubMed] [Google Scholar]
- 6.Orru S, Vitagliano L, Esposito L, Mazzarella L, Marino G, Ruoppolo M. Effect of deamidation on folding of ribonuclease A. Protein Sci. 2000;9:2577–2582. doi: 10.1110/ps.9.12.2577. [DOI] [PMC free article] [PubMed] [Google Scholar]
- 7.Thannhauser T, Scheraga HA. Reversible blocking of half-cysteine residues of proteins and an irreversible specific deamidation of asparagine-67 of s-sulforibonuclease under mild conditions. Biochemistry. 1985;24:7681–7688. doi: 10.1021/bi00347a027. [DOI] [PubMed] [Google Scholar]
- 8.Solstad T, Flatmark T. Microheterogeneity of recombinant human phenylalanine hydroxylase as a result of nonenzymatic deamidations of labile amide containing amino acid. Eur. J. Biochem. 2000;267:6302–6310. doi: 10.1046/j.1432-1327.2000.01715.x. [DOI] [PubMed] [Google Scholar]
- 9.Robinson AB, McKerrow JH, Cary P. Controlled deamidation of peptides and proteins: an experimental hazard and a possible biological timer. Proc. Natl. Acad. Sci. U.S.A. 1970;66:753–757. doi: 10.1073/pnas.66.3.753. [DOI] [PMC free article] [PubMed] [Google Scholar]
- 10.Takemoto L, Boyle D. Specific glutamine and asparagine residues of γ-S crystallin are resistant to in vivo deamidation. J. Biol. Chem. 2000;275:26109–26112. doi: 10.1074/jbc.M002809200. [DOI] [PubMed] [Google Scholar]
- 11.Robinson NE, Robinson AB. Prediction of protein deamidation rates from primary and three-dimensional structure. Proc. Natl. Acad. Sci. U.S.A. 2001;98:4367–4372. doi: 10.1073/pnas.071066498. [DOI] [PMC free article] [PubMed] [Google Scholar]
- 12.Kelleher NL, Lin HY, Valaskovic GA, Aaserud DJ, Fridriksson EK, McLafferty FW. Top down versus bottom up protein characterization by tandem high-resolution mass spectrometry. J. Am. Chem. Soc. 1999;121:806–812. [Google Scholar]
- 13.McLafferty FW, Fridriksson EK, Horn DM, Lewis MA, Zubarev RA. Biomolecule mass spectrometry. Science. 1999;21:1289–1290. doi: 10.1126/science.284.5418.1289. [DOI] [PubMed] [Google Scholar]
- 14.Ge Y, Lawhorn BG, ElNaggar M, Strauss E, Park J, Begley TP, McLafferty FW. Top down characterization of larger proteins (45 kDa) by electron capture dissociation mass spectrometry. J. Am. Chem. Soc. 2002;124:672–678. doi: 10.1021/ja011335z. [DOI] [PubMed] [Google Scholar]
- 15.Kelleher NL. Top-Down Proteomics. Anal. Chem. 2004;76:196A–203A. [PubMed] [Google Scholar]
- 16.Burns KE, Xiang Y, Kinsland CL, McLafferty FW, Begley TP. Reconstitution and Biochemical Characterization of a New Pyridoxal-5'-phosphate Biosynthetic Pathway. J. Am. Chem. Soc. 2005;127:3682–3683. doi: 10.1021/ja042792t. [DOI] [PubMed] [Google Scholar]
- 17.Narayan M, Xu G, Ripoli DR, Zhai H, Breuker K, Wanjalla C, Leung HJ, Navon A, Welker E, McLafferty MW, Scheraga HA. Dissimilarity in the Reductive Unfolding Pathways of Two Ribonuclease Homologues. J. Mol. Biol. 2004;338:795–809. doi: 10.1016/j.jmb.2004.03.014. [DOI] [PubMed] [Google Scholar]
- 18.Xu G, Zhai H, Narayan M, McLafferty MW, Scheraga HA. Simultaneous Characterization of the Reductive Unfolding Pathways of RNase B Isoforms by Top-Down Mass Spectrometry. Chem. Biol. 2004;11:517–524. doi: 10.1016/j.chembiol.2004.03.020. [DOI] [PubMed] [Google Scholar]
- 19.Zhai H, Dorrestein PC, Chatterjee A, Begley TP, McLafferty FW. Simultaneous Kinetic Characterization of Multiple Protein Forms by Top Down Mass Spectrometry. J. Am. Soc. Mass Spectrom. 2005;16:1052–1059. doi: 10.1016/j.jasms.2005.02.016. [DOI] [PubMed] [Google Scholar]
- 20.Horn DM, Zubarev RA, McLafferty FW. Automated reduction and interpretation of high resolution electrospray mass spectra of large molecules. J. Am. Soc. Mass. Spectrom. 2000;11:320–332. doi: 10.1016/s1044-0305(99)00157-9. [DOI] [PubMed] [Google Scholar]
- 21.Bornstein P, Balian G. The specific nonenzymatic cleavage of bovine ribonuclease with hydroxylamine. J. Biol. Chem. 1970;245:4854–4856. [PubMed] [Google Scholar]
- 22.Meinwald YC, Stimson ER, Scheraga HA. Deamidation of the asparaginylglycyl sequence. Int. J. Pept. Protein Res. 1986;28:79–84. doi: 10.1111/j.1399-3011.1986.tb03231.x. [DOI] [PubMed] [Google Scholar]
- 23.Wright HT. Sequence and structure determinants of the nonenzymatic deamidation of asparagine and glutamine residues in proteins. Protein Eng. 1991;4:283–294. doi: 10.1093/protein/4.3.283. [DOI] [PubMed] [Google Scholar]
- 24.Gauthier JW, Trautman TR, Jacobson DB. Sustained off-resonance irradiation for collision-activated dissociation involving Fourier transform mass spectrometry. Collision-activated dissociation technique that emulates infrared multiphoton dissociation. Anal. Chim. Acta. 1991;246:211–225. [Google Scholar]
- 25.Senko MW, Speir JP, McLafferty FW. Collisional activation of large multiply charged ions using Fourier transform mass spectrometry. Anal. Chem. 1994;66:2801–2808. doi: 10.1021/ac00090a003. [DOI] [PubMed] [Google Scholar]
- 26.Little DP, Speir JP, Senko MW, O'Connor PB, McLafferty FW. Infrared multiphoton dissociation of large multiply charged ions for biomolecule sequencing. Anal. Chem. 1994;66:2809–2815. doi: 10.1021/ac00090a004. [DOI] [PubMed] [Google Scholar]
- 27.Zubarev RA, Kelleher NL, McLafferty FW. Electron capture dissociation of multiply charged protein cations. A nonergodic process. J. Am. Chem. Soc. 1998;120:3265–3266. [Google Scholar]
- 28.Zubarev RA, Horn DM, Fridriksson EK, Kelleher NL, Kruger NA, Lewis MA, Carpenter BK, McLafferty FW. Electron capture dissociation for structural characterization of multiply charged protein cations. Anal. Chem. 2000;72:563–573. doi: 10.1021/ac990811p. [DOI] [PubMed] [Google Scholar]
- 29.Venkatesh YP, Vithayathyl PJ. Influence of deamidation(s) in the 67-74 region of ribonuclease on its refolding. Int. J. Peptide Res. 1985;25:27–32. doi: 10.1111/j.1399-3011.1985.tb02143.x. [DOI] [PubMed] [Google Scholar]
- 30.Beu SC, Senko MW, Quinn JP, Wampler FM, III., McLafferty FW. Fourier transform electrospray instrumentation for tandem high resolution mass spectrometry of large molecules. J. Am. Soc. Mass Spectrom. 1993;4:557–565. doi: 10.1016/1044-0305(93)85017-R. [DOI] [PubMed] [Google Scholar]
- 31.Sze SK, Ge Y, Oh H, McLafferty FW. Plasma electron capture characterization of large dissociation for the proteins by top down mass spectrometry. Anal. Chem. 2003;75:1599–1603. doi: 10.1021/ac020446t. [DOI] [PubMed] [Google Scholar]
- 32.Wang TC, Ricca TL, Marshall AG. Extension of dynamic range in Fourier transform ion cyclotron resonance mass spectrometry via stored wave form inverse Fourier transform excitation. Anal. Chem. 1986;58:2935–2938. doi: 10.1021/ac00127a009. [DOI] [PubMed] [Google Scholar]
- 33.Marshall AG, Senko MW, Li W, Li M, Dillon S, Guan S, Logan TM. Protein Molecular Weight to 1 Da by 13C, 15N Double-Depletion and FT-ICR Mass Spectrometry. J. Am. Chem. Soc. 1997;119:433–434. [Google Scholar]
- 34.Cournoyer JJ, Pittman JL, Ivleva VB, Fallows E, Waskell L, Costello CE, O'Connor OB. Deamidation: Differentiation of aspartyl from isoaspartyl products in peptides by electron capture dissociation. Protein Sci. 2005;14:452–463. doi: 10.1110/ps.041062905. [DOI] [PMC free article] [PubMed] [Google Scholar]
- 35.Bjellqvist B, Bases B, Olsen E, Celis JE. Reference points for comparisons of two-dimensional maps of proteins from different human cell types defined in a pH scale where isoelectric points correlate with polypeptide compositions. Electrophoresis. 1994;15:529–539. doi: 10.1002/elps.1150150171. http://ca.expasy.org/tools/pi_tool.html. [DOI] [PubMed] [Google Scholar]
- 36.Kruger NA, Zubarev RA, Carpenter BK, Kelleher NL, Horn DM, McLafferty FW. Electron capture versus energetic dissociation of protein ions. Int. J. Mass Spetrom. 1999;182/183:1–5. [Google Scholar]
- 37.Qi PX, Sosnick TR, Englander SW. The burst phase in ribonuclease A folding and solvent dependence of the unfolded state. Nat. Struct. Biol. 1998;5:882–884. doi: 10.1038/2321. [DOI] [PubMed] [Google Scholar]
- 38.Krantz BA, Mayne L, Rumbley J, Englander SW, Sosnick TR. Fast and slow intermediate accumulation and the initial barrier mechanism in protein folding. J. Mol. Biol. 2002;324:359–371. doi: 10.1016/s0022-2836(02)01029-x. [DOI] [PubMed] [Google Scholar]
- 39.Navon A, Ittah V, Laity JH, Scheraga HA, Haas E, Gussakovsky EE. Local and long-range interactions in the thermal unfolding transition of bovine pancreatic ribonuclease A. Biochemistry. 2001;40:93–104. doi: 10.1021/bi001945w. [DOI] [PubMed] [Google Scholar]
- 40.Navon A, Ittah V, Landsman P, Scheraga HA, Haas E. Distributions of intramolecular distances in the reduced and denatured states of bovine pancreatic ribonuclease A. Folding initiation structures in the C-terminal portions of the reduced protein. Biochemistry. 2001;40:105–118. doi: 10.1021/bi001946o. [DOI] [PubMed] [Google Scholar]


