

Abstract
Microsatellite markers are extensively used to evaluate genetic diversity in natural or experimental evolving populations. Their high degree of polymorphism reflects their high mutation rates. Estimates of the mutation rates are therefore necessary when characterizing diversity in populations. As a complement to the classical experimental designs, we propose to use experimental populations, where the initial state is entirely known and some intermediate states have been thoroughly surveyed, thus providing a short timescale estimation together with a large number of cumulated meioses. In this article, we derived four original gene genealogy-based methods to assess mutation rates with limited bias due to relevant model assumptions incorporating the initial state, the number of new alleles, and the genetic effective population size. We studied the evolution of genetic diversity at 21 microsatellite markers, after 15 generations in an experimental wheat population. Compared to the parents, 23 new alleles were found in generation 15 at 9 of the 21 loci studied. We provide evidence that they arose by mutation. Corresponding estimates of the mutation rates ranged from 0 to 4.97 × 10⁻³ per generation (i.e., year). Sequences of several alleles revealed that length polymorphism was only due to variation in the core of the microsatellite. Among different microsatellite characteristics, both the motif repeat number and an independent estimation of the Nei diversity were correlated with the novel diversity. Despite a reduced genetic effective size, global diversity at microsatellite markers increased in this population, suggesting that microsatellite diversity should be used with caution as an indicator in biodiversity conservation issues.
BECAUSE microsatellite markers (tandemly repeated DNA motifs of 1–6 bp in length) are highly polymorphic and since they are distributed across the whole genome (Wu and Tanksley 1993; Plaschke et al. 1995; Pejic et al. 1998), they constitute a powerful tool to assess the level of genetic differentiation within and among experimental or natural populations at different generations. The high degree of polymorphism at microsatellite markers is directly related to their underlying mutation rates, which can be explained by two mutational mechanisms: polymerase slippage during DNA replication and unequal crossing over during recombination—but not excluding SNP mutations at a lower rate. These two mechanisms involve changes in the number of motif repeats. Understanding the evolutionary properties of microsatellites is hence necessary for correctly interpreting diversity data when studying populations across generations and/or populations that have spatially diverged (Ellegren 2004).
An increasing number of studies have been devoted to the estimation of mutation rates at microsatellite loci (e.g., Schug et al. 1998; Symonds and Lloyd 2003; Denver et al. 2004; Thuillet et al. 2004), which reveal a far more complex scheme for microsatellite evolution than previously stated (Schlötterer 2000; Ellegren 2004). Parallel to the empirical studies, more refined and diverse mutation models of microsatellite evolution have been developed, such as the proportional slippage (PS) model of Kruglyak et al. (1998) (where length mutations tend to increase with increasing repeat numbers, balanced by point mutations breaking the longer sequences into smaller units) and its derivatives (e.g., Xu et al. 2000). To provide valuable data for testing the different models in a large number of species, data acquisition designs should allow for unbiased and accurate estimations of mutation rates. As far as we know, four kinds of approaches have been used to estimate mutation rates in a wide range of species. They can be described according to the timescale they consider: a short timescale when using (i) pedigree-based (or parent–offspring) estimation [in humans (Weber and Wong 1993; Heyer et al. 1997; Whittaker et al. 2003), in birds (Brohede et al. 2002, 2004; Beck et al. 2003), and in Gastropoda (Gow et al. 2005)] or (ii) mutation-accumulation lines [in maize (Vigouroux et al. 2002), in wheat (Thuillet et al. 2002), in Drosophila (Schug et al. 1998; Vazquez et al. 2000), in Caenorhabditis elegans (Denver et al. 2004; Seyfert et al. 2008), and in Dictyostelium discoideum (McConnell et al. 2007)], and a long timescale with (iii) interspecies comparison scaling divergence time with fossil data [human/chimp (Webster et al. 2002; Sainudiin et al. 2004; Kayser et al. 2006)] or (iv) within-species allele-frequency distribution [in wheat (Chakraborty et al. 1997; Thuillet et al. 2004), in humans (Xu et al. 2005), and in Arabidopsis thaliana (Symonds and Lloyd 2003)]. Short timescale approaches (pedigree or accumulation lines) are expected to be less biased since they rely on the direct observation of neo-mutations but to reach a sufficient accuracy they need larger sample sizes to allow for the detection of rather rare events. Long timescale approaches take advantage of the numerous meioses accumulated since the time when populations or species under comparison diverged, but they suffer from the potential confounding effects of selection, demography, and risks of saturation, which might lead to biased estimates (Zhivotovsky et al. 2006).
While these studies are at least in agreement as to the finding of high heterogeneity in mutation rates with respect to loci and on the positive correlation of mutation rate or diversity with microsatellite size or repeat number, they led to contrasting results regarding the number of repeats of a mutation [stepwise mutation model (SMM) vs. two-phase model (TPM)] and the occurrence of a bias in the direction of the mutation (increasing or decreasing allele size). Moreover, the estimated mutation rates seemed to vary depending on the experimental design used: the estimated mutation rates were lower in long-scale designs [human–chimp comparison (Webster et al. 2002; Sainudiin et al. 2004)] than in pedigree/parent–offspring designs (Weber and Wong 1993; Heyer et al. 1997; Whittaker et al. 2003) in agreement with the saturation effect.
In this article, we develop a complementary approach to the above cited designs that involves an experimental population where the initial state is entirely known and some intermediate states have been thoroughly surveyed, thus providing short timescale estimation together with a reasonable number of cumulated meioses. In addition to limiting bias, this approach allows for estimating the genetic effective population size from temporal variation in allele frequencies (Waples 1989) at each locus, providing indications of genetic drift and selection effect together with mutation rate at the individual locus level. Yet, assessing mutation rates from genetic samples taken over time within such evolving populations is not straightforward since the genealogy between the different samples is usually not known. We therefore derived four original gene genealogy-based methods to assess mutation rates with limited bias due to relevant model assumptions incorporating the initial state, the number of new alleles, and the genetic effective population size. Genetic data at microsatellite markers were collected from an experimental wheat population involved in 15 generations of evolution under seminatural/controlled conditions. We identified the new diversity, studied its dynamics over generations, and assessed mutation rates using the newly developed methods. These results provide new insights into the dynamics, maintenance, and renewal of microsatellite variability in an experimental evolving population. We also address the issue of using microsatellite markers with high mutation rates to make inferences on the evolution and conservation of genetic diversity within populations, at a timescale relevant for the conservation of genetic resources.
MATERIALS AND METHODS
Population studied:
The wheat experimental population was part of a dynamic management program aimed at investigating an evolutionary conservation method for the genetic resources of cultivated species (Goldringer et al. 2006). Sixteen homozygous genotypes were used as the parents of the population. These 16 genotypes were manually crossed by pairs; the eight resulting hybrids were then crossed again for three generations until a single segregating population was obtained, where each individual was derived from all 16 parents with expected equal contributions (Figure 1). After the four generations of crosses, three generations of bulk multiplication (under the naturally mainly selfing mating system of wheat) were performed to increase the number of seeds of this population. This initial experimental population corresponds to generation 0 (hereafter G0). In 1984, G0 seeds were sown at Le Moulon (48°4′N 2°1′E, near Paris), where the population was then cultivated for 16 generations (one generation per year from mid-1984 to mid-2000). From 5000 to 10,000 plants were cultivated each generation in a 100-m2 plot isolated from other wheat fields to avoid cross-pollination, both by distance (>50 m) and by the physical barrier of a different and taller species (rye, …) surrounding the plot. At each generation, all the seeds were bulk harvested and mixed, and a sample of 10,000 seeds was sown, providing 5000–10,000 plants at the next generation. Temporal evolution of microsatellite diversity was studied among the 16 parents and samples of individuals from different generations. In spring 2000, 287 individuals of generation 15 (G15: plants grown from seeds harvested after 15 generations) were randomly sampled within the population to be genotyped. Seeds harvested after 1 (G1), 5 (G5), and 10 (G10) generations were conserved in a cold room and a sample of them (159, 170, and 130 individuals, respectively) was grown in the field for the study. The 16 parents were conserved in a cold room at the INRA laboratory Le Moulon and were multiplied at maximum four times by self-pollination for maintaining seed germination ability.
Figure 1.—

Experimental design for the population studied. The four generations of crosses were performed manually; bulk multiplication and evolution under natural selection were conducted under the natural mating system of wheat (mainly selfing); the population was grown one generation per year with a gap of 3 years before sowing G0 seeds; one generation starts in the autumn of year n and is completed in the summer of year n + 1.
Molecular analysis:
Total DNA of the 16 parents and of the 287 G15 individuals was extracted from 200 mg of young leaves following a CTAB protocol adapted from Murigneux et al. (1993). Nineteen monolocus microsatellite markers developed by Röder et al. (1998) (Xgwm markers from IPK Gatersleben), and one microsatellite marker (Cfd71) developed at the INRA Clermont–Ferrand laboratory (Guyomarc'h et al. 2002) amplifying two loci (Cfd71_A and Cfd71_D), were chosen to be polymorphic within the set of parents and to cover all 21 chromosomes of the wheat genome. The 21 microsatellites were amplified by PCR from 50 ng genomic DNA in 25-μl volumes using 1.5 mm MgCl2, 200 μm dNTPs, 1 μm of each primer, and 1 unit Taq polymerase. Cycling conditions were the same as defined by Röder et al. (1998), except for Xgwm261, where the annealing temperature was set to 60°. PCR products were separated by electrophoresis in 6% sequencing polyacrylamide gels, visualized by silver staining according to Tixier et al. (1997), and sized using a 10-bp DNA ladder. DNA of 5 parents polymorphic for the microsatellite loci were used as references in each run. PCR, electrophoresis, and silver staining were realized at the INRA Clermont–Ferrand laboratory.
At each locus, the different alleles found among the 16 parents (parental alleles) were identified and characterized by their size (in base pairs). In G15, all alleles at each locus were compared to the parental alleles, and novel alleles (not present among the parents) were identified.
To analyze more precisely the emergence and evolution of these new alleles in the population, we genotyped individuals sampled at G1, G5, and G10 together with the 16 parents for six loci characterized by new alleles at G15. Total DNA of these individuals was extracted from lyophilized young leaves following a rapid procedure adapted from Dellaporta et al. (1983). Forward primers were modified with an M13 extension according to Boutin-Ganache et al. (2001). The microsatellites were amplified from 200 ng genomic DNA in 10-μl volumes, using 1.5 or 3 mm MgCl2, 200 μm dNTPs, 25 nm fluorescent labeled M13 tail, 0.5 μm of each modified forward primer, 0.5 μm of each reverse primer, and 1 unit Taq polymerase. Cycling conditions were 5 min at 95°, 30 cycles of 20 sec at 95°, 20 sec at 50°–60° (depending on the primer, according to Röder et al. 1998 and Guyomarc'h et al. 2002), 30 sec at 72°, and 3 min at 72°. The PCR products were separated by electrophoresis in 6.5% sequencing polyacrylamide gels in a LiCor automated sequencer (LiCor Biosciences). The amplified fragments were analyzed with version 2.03 of the OneDscan software (Scanalytics). To compare alleles identified from both methods (electrophoresis with silver staining and electrophoresis on the LiCor automated sequencer), all 16 parental alleles were resized with this second method.
Cloning and sequencing:
To investigate the nature of length variation in microsatellite polymorphism and to determine whether the allelic diversity observed was due to changes in the number of repeats or in the flanking sequences, some new alleles together with the parental ones were sequenced. For one locus with few alleles, we cloned all alleles before sequencing. For the others, because of their large number of alleles, we analyzed only a sample of alleles as described in the following:
We cloned one allele per locus before sequencing to establish a reference sequence.
We sequenced in both ways the other alleles directly from PCR products.
First, all alleles were amplified by PCR with unlabeled primers, as described in the above section, and the fragments were separated by electrophoresis on 6% denaturing polyacrylamide gels containing 7.5 m urea, 6% acrylamide, and 1× TBE buffer. PCR products were visualized by silver staining according to Tixier et al. (1997) and sized with a 10-pb DNA ladder. DNA bands with the appropriate size (corresponding to the most intense signal) were extracted and purified with the QiaexII kit (QIAGEN, Valencia, CA). To increase the concentration of microsatellite fragments (loss of material linked to the steps of band purification) and hence the probability of success for cloning and sequencing, we amplified DNA fragments by another PCR, using the same conditions as the initial one. After this step, one allele per locus was cloned before sequencing (method A), and the others were directly sequenced in both directions at the Montpellier INRA laboratory on an ABI377 semiautomated sequencer (method B). In method A, the reference allele was first ligated into pGEM-T vector (Promega, Madison, WI) and then cloned into Escherichia coli DH5α chemically competent cells (Invitrogen, San Diego). Because PCR generated stutter (small noise bands close to the allele one), we cloned the allele with its potential stutter. To assess the exact size of each insert and to select colonies carrying the right allele, white colonies were amplified by PCR using labeled M13 primers (Boutin-Ganache et al. 2001), and PCR products were separated on a LiCor automated sequencer with a parental control. The colonies carrying the target insert were sequenced at Genomexpress. The flanking sequences (obtained with method B) were compared with those obtained in the reference sequence (method A). While the sequencing of the microsatellite alleles did not provide their exact size (number of repeats), it allowed us to determine the nature of the observed polymorphism (in the core of the microsatellite or in the neighboring regions).
Diversity analysis:
At each locus, gene diversity (Nei 1973) was calculated in the parents and its unbiased estimate (Nei 1987) was used for G15 to account for sampling variation on the allele frequency estimations.
Genetic effective population size (Neg) between parents and G15 was estimated on the basis of temporal changes in microsatellite allele frequencies according to Waples (1989),
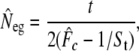 |
(1) |
where  is the multilocus estimate of the standardized variance of allelic frequencies (Nei and Tajima 1981), t is the number of generations between the two populations (there were 22 generations between the parents and G15), and St is the sample size at the final generation. Sampling error was ignored in the 16 parents because they allowed the calculation of the exact initial allele frequencies. A confidence interval (C.I.) for
  was derived on the basis of the chi-square approximation for
  (n = number of alleles − number of loci) (Waples 1989).
Genetic effective population size estimated from marker data was compared to the demographic effective size Ned estimated as  (Caballero 1994), where N is an estimator of the census population size (an underestimate of 5000 individuals based on the minimum number of plants grown at each generation was considered here), and
  was the average inbreeding coefficient calculated on the 21 loci in a population at inbreeding equilibrium. If a population is faced with genetic drift only, the demographic and the genetic effective population sizes should be the same; i.e., Neg
  Ned. To identify markers exhibiting extreme Fc values compared to the rest of the genome, we tested if the temporal allelic variation observed at each locus was significantly higher than expected under genetic drift alone. To test the null hypothesis “temporal allelic variation is homogeneous throughout the genome,” each Fc value was compared to the distribution obtained from 3000 random independent simulation runs (Goldringer and Bataillon 2004) based on the mean genetic effective population size, Neg, estimated between the parents and G15. Simulations were carried out using the Mathematica software (Wolfram 1996).
Testing for migration:
To determine the origin of the novel diversity observed in the population, we identified sources of potential migration by listing all the field wheat varieties cultivated at Le Moulon since 1984 (supplemental Table 1) and all these varieties were genotyped at the Clermont–Ferrand INRA laboratory with the same 21 markers used for the parents and G15. Assuming that mutations occur independently at the different loci, we also tested for random association between new alleles at the 21 loci with a chi-square test, considering that at each locus, there were two classes of alleles, parental or new, and calculating the expected distribution of individuals with 0, 1, 2, …, 21 new alleles at the 21 loci under random association of new alleles. Whereas departure from random association would provide evidence for a migration origin of most new alleles, a nonsignificant test could indicate both independent appearance by mutation and migration with migrants genetically related to the population.
Mutation rates estimation:
The gene genealogy mutation rate estimators are described and discussed in the appendix. These are moment (mean) estimators relying on the computation of the size of the partial tree along the experiment (proportional—with a factor 1/μ—to the observed number of mutations). In short, the first two estimators are obtained under Kingman's coalescent model assuming continuous time and a binary tree, neglecting multiple common ancestry events occurring at the same generation. The first estimator μ1 is computed with an approximation replacing coalescence times by their expectations and neglecting the dependence between them induced by the conditioning on an absolute duration of the experiment. The second one, μ2 is an exact analytical formula giving the size of the tree, taking this dependence into account. The estimators μ3 and μ4 were derived using the Wright–Fisher (WF) model (discrete generations, allowing for multiple simultaneous common ancestry events). An approximation formula that computed time recursively and replaced the number of ancestors by its expected value at each generation was used for μ3, and a Monte Carlo backward simulation algorithm of gene genealogy associated to the WF model was used for μ4. The results related to the difference between the estimators are described and discussed in the appendix. In short, the two estimators provided fairly consistent estimates.
Factors influencing locus diversity and mutation:
To obtain more insight into factors that influence the origin and renewal of genetic diversity, we searched for associations between characteristics of each of the 21 microsatellite loci and the number of parental and novel alleles the analysis revealed. The characteristics we investigated were the motif (type, perfection, and number of repeats), the position on the chromosome with regard to the centromere, the genome (A, B, or D) the locus belongs to, and the genetic diversity measured on a large collection of wheat genetic resources (details are given in supplemental Table 2). Note that given the number of loci studied (21, among which 9 had new alleles), the statistical power was low, suggesting that significant tests should reveal a great magnitude of the effects involved. The effects of motif type, motif perfection, and genome location were investigated factor by factor using an analysis of variance (procedure GLM, SAS 1999). Effects of the number of repeats, the locus position, and the genetic diversity were tested separately by regression (procedure GLM, SAS 1999).
RESULTS
Evolution of microsatellite diversity within the wheat population:
Among the parents, the number of alleles per locus ranged from 2 to 8, with an average of 4.1 alleles per locus. The number of alleles per locus ranged from 2 to 10 in G15, with an average of 5.0 alleles per locus. Three of 86 parental alleles were no longer found in G15, whereas 23 novel alleles were detected. Nei's diversity index for each locus ranged from 0.117 to 0.805 in the parents and from 0.029 to 0.760 in G15. They thus appeared to be quite similar between the parents and G15 (Figure 2), except for four loci (Xgwm135, Xgwm149, Xgwm312, and Xgwm626) for which H was smaller in G15.
Figure 2.—

Gene diversity in the population (16 parents and G15) and in the wheat collection from the INRA Clermont–Ferrand laboratory (Roussel et al. 2004).
Nine among the 21 loci showed novel alleles, and a total of 23 new alleles were observed in G15. Most of the new alleles were detected at low frequency (<0.05), except for 3 alleles at 3 different loci (Xgwm260, Xgwm642, Cfd71_D) with frequencies ranging from 0.069 to 0.185 in G15 (Table 1). Among the 9 loci with new alleles in G15 (Table 1), 6 (Xgwm181, Xgwm260, Xgwm312, Xgwm437, Xgwm642, and Cfd71_D) were chosen to study emergence of novel diversity. At these 6 loci, a total of 20 new alleles were found at the different generations studied. Of these, 10 new alleles were found in G1 and were maintained in the following generations, 2 were observed for the first time in G5 and were maintained at low frequency in the population, 1 was found in G10 and G15, and 4 were found only in G15. The 3 other new alleles were observed only once in G1, G5, or G10. In G10, 5 alleles observed in the previous generations, and found again in G15, were not detected (Table 1). This lower allelic richness at this generation (G10) could be explained by the smaller sample size. Among the 20 new alleles observed at these 6 loci in the four generations, 12 were already present in G1, compared to 8 others detected between G1 and G15 (Table 1). Among the 20 new alleles detected, 14 had a size very close to the parental allele size, differing by only (±) 1 microsatellite repeat (Table 1). Three new alleles differed from parental alleles by (±) two repeats and the 3 other new alleles differed from parental alleles by three repeats or more.
TABLE 1.
Frequency trajectories and emergence of new alleles in the population
| Allele frequency
|
Difference between no. of repeats compared with parental alleles | ||||||||
|---|---|---|---|---|---|---|---|---|---|
| Allele size (bp) | Parents
|
||||||||
| Locus | Fraction | No. | G1 | G5 | G10 | G15 | Status | ||
| Xgwm181 | 141 | 4/16 | 0.250 | 0.278 | 0.232 | 0.196 | 0.138 | P | |
| 143 | 1/16 | 0.063 | 0.062 | 0.133 | 0.072 | 0.118 | P | ||
| 145 | — | — | 0.003 | — | — | — | N | +1 | |
| 147 | — | — | — | — | 0.012 | — | N | −2 | |
| 151 | 8/16 | 0.500 | 0.373 | 0.377 | 0.476 | 0.568 | P | ||
| 153 | — | — | 0.036 | 0.054 | 0.032 | 0.039 | N | +1 | |
| 155 | — | — | — | — | — | 0.004 | N | −1 | |
| 157 | 2/16 | 0.125 | 0.219 | 0.187 | 0.212 | 0.121 | P | ||
| 175 | 1/16 | 0.063 | 0.029 | 0.018 | 0.000 | 0.013 | P | ||
| Xgwm260 | 162 | — | — | 0.069 | 0.075 | 0.062 | 0.098 | N | −6 |
| 174 | 1/16 | 0.063 | 0.004 | 0.006 | 0,000 | 0.035 | P | ||
| 176 | 1/16 | 0.063 | 0.047 | 0.090 | 0.031 | 0.029 | P | ||
| 178 | 6/16 | 0.375 | 0.392 | 0.466 | 0.477 | 0.369 | P | ||
| 180 | 7/16 | 0.438 | 0.379 | 0.261 | 0.308 | 0.325 | P | ||
| 182 | — | — | 0.009 | 0.006 | — | 0.023 | N | +1 | |
| 184 | — | — | 0.013 | 0.043 | — | 0.027 | N | +2 | |
| 186 | — | — | — | — | — | 0.004 | N | −1 | |
| 188 | 1/16 | 0.063 | 0.086 | 0.053 | 0.123 | 0.090 | P | ||
| Xgwm272 | 130 | 1/16 | 0.063 | NE | NE | NE | 0.029 | P | |
| 148 | — | — | NE | NE | NE | 0.004 | N | −1 | |
| 150 | 5.5/16 | 0.344 | NE | NE | NE | 0.343 | P | ||
| 152 | 2/16 | 0.125 | NE | NE | NE | 0.094 | P | ||
| 156 | 7.5/16 | 0.469 | NE | NE | NE | 0.531 | P | ||
| Xgwm312 | 208 | 7/16 | 0.313 | 0.232 | 0.220 | 0.177 | 0.170 | P | |
| 210 | 2/16 | 0.125 | 0.106 | 0.051 | 0.075 | 0.012 | P | ||
| 218 | 1/16 | 0.063 | 0.110 | 0.108 | 0.071 | 0.080 | P | ||
| 226 | 2/16 | 0.125 | 0.035 | 0.015 | 0.024 | 0.004 | P | ||
| 232 | 4/16 | 0.375 | 0.471 | 0.560 | 0.563 | 0.663 | P | ||
| 234 | — | — | — | — | 0.008 | 0.007 | N | +1 | |
| 236 | — | — | 0.013 | 0.024 | 0.039 | 0.028 | N | +2 | |
| 238 | — | — | — | — | — | 0.007 | N | +3 | |
| 240 | — | — | 0.032 | 0.021 | 0.043 | 0.028 | N | +4 | |
| Xgwm408 | 150 | 5.5/16 | 0.344 | NE | NE | NE | 0.459 | P | |
| 173 | — | — | NE | NE | NE | 0.004 | N | −4 | |
| 179 | — | — | NE | NE | NE | 0.007 | N | −1 | |
| 181 | 10.5/16 | 0.656 | NE | NE | NE | 0.528 | P | ||
| 183 | — | — | NE | NE | NE | 0.002 | N | +1 | |
| Xgwm427 | 208 | — | — | NE | NE | NE | 0.004 | N | −1 |
| 210 | 7/16 | 0.438 | NE | NE | NE | 0.182 | P | ||
| 222 | 5/16 | 0.313 | NE | NE | NE | 0.412 | P | ||
| 224 | 1/16 | 0.063 | NE | NE | NE | 0.208 | P | ||
| 226 | 2/16 | 0.125 | NE | NE | NE | 0.120 | P | ||
| 228 | 1/16 | 0.063 | NE | NE | NE | 0.031 | P | ||
| 230 | — | — | NE | NE | NE | 0.042 | N | +1 | |
| Xgwm437 | 97 | 1/16 | 0.063 | 0.146 | 0.121 | 0.088 | 0.037 | P | |
| 109 | 5/16 | 0.313 | 0.271 | 0.288 | 0.256 | 0.244 | P | ||
| 119 | 1/16 | 0.063 | 0.064 | 0.030 | 0.008 | 0.007 | P | ||
| 127 | — | — | 0.006 | 0.030 | — | 0.020 | N | −1 | |
| 129 | 1/16 | 0.063 | 0.038 | 0.061 | 0.076 | 0.105 | P | ||
| 133 | 1/16 | 0.063 | 0.146 | 0.048 | 0.084 | 0.022 | P | ||
| 134 | 4/16 | 0.250 | 0.185 | 0.339 | 0.420 | 0.398 | P | ||
| 135 | — | — | — | — | — | 0.010 | N | +1 | |
| 137 | 1/16 | 0.063 | 0.096 | 0.061 | 0.060 | 0.151 | P | ||
| 139 | 2/16 | 0.125 | 0.048 | 0.021 | 0.008 | 0.007 | P | ||
| Xgwm642 | 206 | 7/16 | 0.438 | 0.605 | 0.512 | 0.455 | 0.559 | P | |
| 208 | — | — | 0.045 | 0.08 | 0.182 | 0.185 | N | +1 | |
| 210 | 5/16 | 0.313 | 0.207 | 0.225 | 0.186 | 0.116 | P | ||
| 220 | 4/16 | 0.250 | 0.143 | 0.183 | 0.178 | 0.141 | P | ||
| Cfd71_D | 203 | 2/16 | 0.125 | 0.068 | 0.156 | 0.197 | 0.102 | P | |
| 205 | 5/16 | 0.313 | 0.266 | 0.330 | 0.360 | 0.481 | P | ||
| 207 | — | — | — | 0.014 | 0.009 | 0.008 | N | +1 | |
| 211 | 7/16 | 0.438 | 0.568 | 0.365 | 0.360 | 0.243 | P | ||
| 217 | — | — | — | 0.014 | — | 0.025 | N | −1 | |
| 219 | 1/16 | 0.063 | 0.006 | 0.007 | 0.026 | 0.064 | P | ||
| 221 | — | — | 0.019 | 0.007 | — | 0.008 | N | +1 | |
| 223 | — | — | 0.065 | 0.108 | 0.048 | 0.069 | N | −1 | |
| 225 | 1/16 | 0.063 | 0.000 | 0.000 | 0.000 | 0.000 | P | ||
| 227 | — | — | 0.006 | — | — | — | N | +1 | |
Status corresponds to parental (P) or novel (N) alleles. Newly arisen alleles are underlined. Distance from parental allele has been estimated from allele size, considering that mutation involved changes in the number of repeats only. NE, not estimated.
The genetic effective population size Neg based on averaged Fc,l over the 21 loci, estimated between the parents and the G15 generation (Neg = 183), was similar to the genetic effective population size estimated previously at different generations with RFLP markers (e.g., Neg = 123 between G0 and G10 and Neg = 144 between G1 and G10; Goldringer et al. 2001). Yet, it was very low compared to the demographic effective size (Ned = 2625, with an estimated inbreeding coefficient of  = 0.893 and the population census size taken as N = 5000 plants). Studying the individual Fc,l values did not allow us to identify loci that would have locally experienced a reduced effective size compared to the rest of the genome (Neg = 183). When accounting for the multiple testing (21 loci) according to Storey and Tibshirani (2003), none of the loci were significant, even those exhibiting the highest Fc,l values.
Cloning and sequencing of alleles:
Seventeen alleles at five loci presenting a novel diversity were sequenced: one at locus Xgwm181, three at locus Xgwm312, two at locus Xgwm437, three at locus Xgwm642, and eight at locus Cfd71_D. Flanking sequences obtained directly from PCR products were compared to flanking sequences obtained from cloned alleles. The sequence at locus Xgwm181 was obtained from cloning and was compared to the sequence of Triticum turgidum. subsp. durum available on the NCBI web site (Thuillet et al. 2005, accession no. AY579595). The microsatellite flanking sequences were strictly conserved in both species, the only differences reflecting the number of unit repeats. At locus Xgwm312, sequences of the 3 alleles (1 cloned and 2 from PCR products) were compared. The absence of polymorphism in flanking sequences led us to conclude that the observed polymorphism was in the core of the microsatellite. Sequences were then compared to a sequence of T. turgidum. subsp. durum available on the NCBI web site (Thuillet et al. 2002). The sequences of the two species differed only by a single-base deletion in the microsatellite flanking sequence. At locus Xgwm437, the two sequences obtained (corresponding to one cloned allele and one allele sequenced from PCR product) were also compatible with a polymorphism in the microsatellite number of repeats. At locus Xgwm642, the three cloned sequences were compared to the sequence of Aegilops tauschii available on the NCBI web site (see supplemental Figure 1). The observed polymorphism among all alleles was systematically due to the number of microsatellite repeats. The flanking sequences were strictly conserved between the two species. At locus Cfd71_D, eight sequences (4 parental and 4 new alleles) were obtained. Although no reference sequence was available for this locus, the polymorphism observed seemed to be also due to the number of repeats. All the new alleles sequenced in this study differed from parental alleles in the core of the microsatellite and polymorphism observed in cloned sequences was due to changes in the number of microsatellite motifs regardless of the species.
Origin of new alleles:
Among the four bread wheat varieties (namely Recital, Festival, Soissons, and Thesee), cultivated at Le Moulon since 1984 and identified as potential sources of migrants for the population, none of them contained any of the new alleles observed in G15 (see supplemental Table 1 for more details).
Among the 287 individuals genotyped in G15, 176 had at least one new allele, but no individual had more than four new alleles simultaneously. The chi-square test for independent associations of new alleles at different loci was not significant (P = 0.43), indicating that independence could not be rejected.
Mutation rate estimation:
Mutation rates were estimated for each of the six loci studied at intermediate generations between parents and G1, and between G1 and G15, and were estimated for each of the nine loci with new alleles between parents and G15 on the basis of the observed number of new alleles appearing between the two generations studied. The gene-genealogy estimators and their derivation are described in the appendix. The results about the difference between the estimators are detailed and discussed in the appendix. In short they provided fairly consistent estimates (Table 2). Whenever computable, the μ1 and μ2 estimators based on the continuous-time Kingman model provided similar results, suggesting that the correlation among internode durations was not a major effect for our set of parameter values. These two estimators gave values close to that of μ3 and the simulated μ4 (Wright–Fisher model), but provided a slightly greater estimate of the mutation rate. The first two estimators probably underestimated the size of the tree, mainly because of the continuous-time approximation: with our set of parameter values, many coalescent events would be estimated to occur before a single generation ended. Multiple common ancestries occurring at the same generation would introduce a bias in the opposite direction and seemed therefore to affect the estimates to a lesser extent. The μ3 and μ4 estimators based on the same—more appropriate—WF model provided virtually identical results, showing that the (A5) analytic approximation is a reliable approximation. We report below only results from the estimator μ4 based on genealogy simulations, the closest model to our experimental design, which should provide the most reliable estimates and allows for computation of standard errors, although other estimators may well be more useful for other sets of parameter values and design.
TABLE 2.
Mutation rate estimations derived by the four coalescent-related methods (see text) in the population
| Parents–G1
|
G1–G15
|
Parents–G15
|
|||||||||||||
|---|---|---|---|---|---|---|---|---|---|---|---|---|---|---|---|
| Locus | μ1 | μ2 | μ3 | μ4 | SE μ4 | μ1 | μ2 | μ3 | μ4 | SE μ4 | μ1 | μ2 | μ3 | μ4 | SE μ4 |
| Xgwm181 | 2.76 | NE | 2.64 | 2.63 | 1.86 | 0.73 | NE | 0.70 | 0.70 | 0.70 | 1.21 | 1.21 | 1.16 | 1.16 | 0.82 |
| Xgwm260 | 4.97 | NE | 4.78 | 4.79 | 2.77 | 0.76 | 1.03 | 0.72 | 0.72 | 0.72 | 2.49 | 2.50 | 2.40 | 2.40 | 1.20 |
| Xgwm312 | 2.74 | NE | 2.61 | 2.61 | 1.85 | 1.46 | NE | 1.39 | 1.39 | 0.98 | 2.41 | 2.42 | 3.32 | 2.32 | 1.16 |
| Xgwm437 | 1.36 | NE | 1.29 | 1.30 | 1.30 | 0.85 | 0.89 | 0.82 | 0.82 | 0.82 | 1.38 | 1.38 | 1.33 | 1.33 | 0.94 |
| Xgwm642 | 1.36 | NE | 1.30 | 1.30 | 1.30 | 0.00 | 0.00 | 0.00 | 0.00 | NE | 0.60 | 0.61 | 0.58 | 0.58 | 0.58 |
| Cfd71_D | 4.13 | NE | 3.94 | 3.94 | 2.27 | 1.52 | 2.07 | 1.45 | 1.45 | 1.03 | 2.50 | 2.50 | 2.40 | 2.40 | 1.20 |
| Xgwm272 | NA | NA | NA | NA | NA | NA | NA | NA | NA | NA | 0.62 | 0.62 | 0.60 | 0.60 | 0.60 |
| Xgwm408 | NA | NA | NA | NA | NA | NA | NA | NA | NA | NA | 1.81 | 1.81 | 1.73 | 1.74 | 1.00 |
| Xgwm427 | NA | NA | NA | NA | NA | NA | NA | NA | NA | NA | 1.22 | 1.22 | 1.17 | 1.17 | 0.83 |
Mutation rate is 10−3; NE, not estimated; NA, not available.
We tested the distribution homogeneity of the number of new alleles across the whole set of 21 loci between parents and G15 (see appendix). The distribution of new alleles across loci was the following: (0, 1, 2, 3, 4) new alleles at (12, 2, 3, 1, 3) loci, respectively. The parameter of the Poisson distribution was estimated as 1.095. Because of the restricted number of loci we split the distribution into three classes (no new alleles, 1 new allele, and ≥2 new alleles). Due to the 0.005 probability associated with the chi-square test, we rejected the null hypothesis of homogeneity of the number of new alleles across the 21 loci. The comparison between the two distributions revealed an excess of loci with no new alleles and a deficit of loci with 1 new allele. Loci with new alleles did not show any clear discrepancy with a Poisson distribution that could lead to a different realized genealogy size. Thus, we considered the 9 loci with new alleles as homogeneous.
For these nine loci, the mean mutation rate estimated between the parents and the 15th generation was 1.68 × 10⁻³. The 95% confidence interval was estimated as [1.50 × 10⁻³; 1.86 × 10⁻³]. The highest estimates of the mutation rate were obtained between parents and G1 (calculated on six loci), where μ4 ranged from 1.29 × 10⁻³ to 4.79 × 10⁻³ with an average of 2.98 × 10⁻³ (C.I.95% = [2.71 × 10⁻³; 3.26 × 10⁻³]). The averaged estimation for G1–G15 was 0.93 × 10⁻³ (C.I.95% = [0.79 × 10⁻³; 1.07 × 10⁻³]). Note that the six mutation rates between G1 and G15 all had smaller estimated values than their counterparts calculated between parents and G1. Under the assumptions of a constant mutation rate whatever the period (parents–G1 or G1–G15) and no bias of estimation linked with the period, the expected probability of this event (six estimates of six with a lower value in the second phase) was 0.0156 (1/26). So we can reject the null hypothesis at the 5% level.
Factors influencing locus diversity and mutation:
A significant effect of the number of repeats in the microsatellite motif was found on the number of new alleles detected in G15 (P < 0.05, R2 = 0.21), but not on the number of parental alleles. The Nei polymorphism index (H) calculated on the French wheat collection with the same 21 loci had a highly significant correlation with the number of parental alleles (P < 0.01, R2 = 0.54) and with the number of new alleles observed in the population (P < 0.01, R2 = 0.33). Similarly, the number of alleles detected with the same set of markers on the wheat collection was correlated with the number of parental (P < 0.01, R2 = 0.52) and new alleles (P < 0.01, R2 = 0.40).
DISCUSSION
Mutation rate estimators:
We used an experimental wheat population to assess mutation rates at microsatellite loci using four new gene genealogy-based methods. We found two classes of loci: 12 without mutation and 9 with mutation rates estimated as 10−3–10−4 that were positively correlated to the length of the microsatellites.
The methods developed here based on gene genealogy approaches proved to be useful to estimate mutation rates on populations with temporally spaced samples. The present experimental design facilitates such estimation since the initial variation is entirely known and all newly arisen mutations can be unambiguously identified. Thus it is necessary to estimate only the size of the tree. This might well not be a common case. It could, however, also apply to experiments starting from a clonal monomorphic population such as those involving microorganisms. A more frequent problem concerns time-series data, e.g., ancient DNA data, pathogen evolution, and other empirical studies with several sampling points in time, where the initial variation is not exhaustively typed. Extension of the method would then require adding explicitly a mutational model and a more elaborate method such as MCMC Bayesian or frequentist approaches (Drummond et al. 2002). Such a Bayesian approach can be adapted to our model (Kingman continuous-time approximation; M. Blum, personal communication). It can be extended to allow for a more complex mutational model, taking into account the complicating homoplasy issue common with microsatellite data. A classical (power) issue is to disentangle the mutation rate from the effective size. Independently obtaining an estimate of the effective size, as in the present case, whenever possible, would certainly help. Moreover, it is not clear that there would be much power to assess which part of the newly detected variation is due to mutations or to ancestral variation not sampled before. An estimate of the mutation rate could combine timescale information, variability preexisting the sampling, and newly arisen variability. Which one would be most useful to estimate the mutation rate remains unclear, being highly dependent on the sampling scheme and the set of parameter values (see the appendix for a discussion of other related issues on gene genealogy-based methods).
Mutation vs. migration:
Although the experimental population was grown in isolation from other wheat cultures, the occurrence of new alleles at subsequent generations can be either due to migration or due to mutation. Here, independent observations and analyses provided evidence that most new alleles were generated by mutation:
The emergence of new alleles at different loci between the 16 parents of the population and the generations studied (G1, G5, G10, G15) suggested that the new alleles appeared independently and, therefore, there was no indication that they could be due to recent migration events.
Moreover, their presence could not be explained by migration of pollen or seeds of the wheat varieties identified as possible sources of migration because the new alleles did not correspond to the alleles of these varieties, or, when they did correspond, their respective growing years were not compatible.
Sequencing results showed polymorphism in the core of the microsatellite; for instance, the three alleles cloned at locus Xgwm642 differed only by their number of repeats, and no indel in the flanking sequences was observed. Most new alleles differed from parental alleles by only one or a few microsatellite repeats in agreement with stepwise-like mutational models.
Comparison with previous mutation rate estimates:
The estimates of mutation rates obtained in this study for loci showing new mutations (10−3–10−4) were consistent with but somewhat in the upper range of mutation rates estimated at microsatellite loci in T. turgidum (Thuillet et al. 2002) and Zea mays (Vigouroux et al. 2002) on the basis of mutation-accumulation lines and also on distantly related species like barn swallows (Brohede et al. 2004), avians (Beck et al. 2003), Gastropoda (Gow et al. 2005), and humans (Weber and Wong 1993; Heyer et al. 1997; Whittaker et al. 2003) with pedigree- or parent–offspring-based estimations. In contrast, estimations in mutation-accumulation lines of Drosophila were smaller (∼10−6, Schug et al. 1998; Vazquez et al. 2000), possibly due to shorter microsatellite sequences, as were estimations based on interspecific comparison between humans and chimps (∼10−4–10−5, Webster et al. 2002; Sainudiin et al. 2004) that might suffer from the confounding effects of selection, demography, and risks of saturation.
In natural populations, microsatellite mutation rates might be higher than in highly homozygous accumulation lines because the high number of heterozygotes will increase microsatellite instability by increasing the probability of unequal crossing over (Rubinsztein et al. 1995). Consistently, the number of new alleles already detected in G1 (which was separated from the parents by 4 generations of intercrosses followed by 4 generations of multiplications) was higher than the number found over the 15 generations separating G1 from G15. This should not be due to differences in Neg since the estimated Neg over different periods, whether including the intercrosses and multiplication or not, were very similar, as previously detailed. Homoplasy should mostly lead to substantial underestimation of mutation rates in natural populations compared to studies using accumulation lines. Here we provide the first study reporting reliable estimates of mutation rates in an evolving population.
Mutation model:
The observed distribution of the new alleles allowed us to reject the null hypothesis of homogeneity among the 21 loci with an excess of loci with no new alleles. In contrast, no heterogeneity could be detected among the 9 loci with new alleles. Heterogeneity may be due either to different mutation rates or to different realized genealogy sizes. If it is due to different tree sizes, this could reflect different effective sizes and/or variance in tree size for a given effective size. On the basis of their variations in allelic frequencies, no loci were detected as outliers with locally reduced genetic effective population size. Neg differences were unlikely to cause heterogeneity in tree sizes among the 21 loci. For a given (estimated) effective size, our simulations revealed a low (4%) coefficient of variation of partial tree sizes (LT). This is largely due to the fact that the portion of the tree involved during the experiment corresponds to the bottom part of a neutral constant-size coalescent tree, averaging across many coalescence events (thus reducing variances). In contrast, the top part of a coalescent tree—not reproduced during our experiment—usually relies on very few highly stochastic coalescence events and this leads to a large stochastic variance in the age of the MRCA and thus in the tree size. Therefore, in the present study, we can speculate that the heterogeneity was mainly due to differences in mutation rates. To get deeper insight into the mechanisms generating diversity, we studied the effects of some microsatellite intrinsic factors on the number of new alleles in G15. Among the different factors, the motif repeat number of the microsatellite was found to be significantly correlated to the number of new alleles in G15. This result is consistent with mutation studies that suggest that longer microsatellites are more unstable (Wierdl et al. 1997) and have higher mutation rates (Rubinsztein et al. 1995; Schug et al. 1998; Seyfert et al. 2008). In this study, we found no evidence that the motif of the microsatellite locus, its degree of perfection, its chromosomal location, or its genome (A, B, D) position had an effect on the microsatellite diversity, but we had little power to detect weak effects. The literature is inconsistent on these topics on wheat (Maccaferri et al. 2003; Thuillet et al. 2004) or on more distant species like humans (Boyer et al. 2008).
Comparison between allele sequences of bread wheat, durum wheat (A and B genomes), and Ae. tauschii (bread wheat wild ancestor with D genome) showed a fairly good conservation of flanking sequences within bread wheat and between the three species, indicating that polymorphism at these microsatellite loci was due to differences in the number of repeats. Among the nine loci studied, five had new alleles differing from parental alleles by only one microsatellite repeat. This result supported the stepwise mutation model that assumes that new alleles are created by an increase or a decrease of one repeat (Kimura and Ohta 1978). For the four other loci, results were more consistent with the two-phase model that assumes that some mutations are created by addition or deletion of one repeat, while others are created by the indels of several repeats (Di Rienzo et al. 1994). Among the 26 new alleles observed in the population, 7 alleles differed from parental alleles by more than one repeat. While this novel diversity might have arisen from unequal crossing over during recombination (Sia et al. 1997), the 19 other new alleles could have arisen either from unequal crossing over or from polymerase slippage during replication. It was not possible to assess the relative contributions of these two mechanisms.
Mutation has a positive impact on genetic diversity (whose maximal value at a given locus is determined by the number of alleles at this locus) and obviously on allelic richness, as exemplified in our experimental study: of 86 alleles initially present, only 3 were not detected in G15. Moreover, 23 new alleles appeared in the population, resulting in a gain of 20 alleles. Nei's diversity was lower in G15 than in the parents for four loci, but was otherwise similar between these two generations.
On the other hand, it is not likely that mutation influences the evolution of allele frequencies over time except in case of recurrent mutation over a large number of generations. Rather, temporal variation in allele frequencies reflects pressures such as genetic drift and selection.
Evolutionary regime:
Here, the estimated effective size based on allele frequency variation between parents and G15 (Neg = 183) was much smaller than the demographic effective size (Ned = 2625) based on the true number of plants cultivated at each generation. The difference could not be explained by genetic drift alone but selection was suspected.
It is normal for Neg to be lower than Ned, as shown in a review of 192 experiments by Frankham (1995). He analyzed the Ne/N ratios measured in natural animal and plant populations and the mean ratio was ∼0.10, with the most important variables influencing the value of this ratio being the fluctuation in population size and variance in family size. Yet, in the experimental wheat population, the number of individuals was controlled, so that very few demographic fluctuations might have happened. Here, the low Neg (=183) indicates that all plants did not contribute equally to subsequent generations. Instead, there was a large variance in reproductive contribution. This variance in reproductive contribution may be due either to noninherited causes or to inherited causes. In the latter case, selection would increase the variance of reproductive contribution (indirect effect) while modifying the frequency of the genes involved in the control of the fitness-related traits. In a previous study (Goldringer et al. 2001), using the analytical formulas (Caballero 1994) for the calculation of Neg in the case of noninherited variation in the reproductive contribution, we found that only unrealistic variances (much greater than direct empirical estimates) could explain the discrepancy observed between the estimated Neg and the demographic size of the populations. On the other hand, theory (Santiago and Caballero 1995) and some experimental results (Austerlitz and Heyer 1998) showed that low levels of correlation among the effective family sizes for successive generations may strongly reduce genetic effective population size in a quantitative selection way. This led us to conclude that differences in parental contributions were due to inherited genetic causes and that, in other terms, limited effective size in the population was due to selection. The two loci (Xgwm312 and Xgwm642) with the highest (but not significant) individual Fc values also presented new alleles. Introduction of new alleles by mutation is unlikely to drive high Fc values. For the locus Xgwm312, new alleles were detected at low frequencies (<5%) at each generation and the high Fc value was explained only by strong variation in parental allele frequencies. For the locus Xgwm642, the new allele frequency increased across generations, and the high Fc value estimated was due to strong variation of parental and new allele frequencies. This is likely to be due to the selection of favorable variants at closely linked loci (hitchhiking effect, Maynard Smith and Haigh 1974).
The effective size calculated here was also similar to those calculated in previous studies using RFLP markers in the first 10 generations (Goldringer et al. 2001). Despite large differences in the number of alleles detected per locus in the population and in the mutational process between RFLP markers (average of 2.2 alleles per locus in G10, Goldringer et al. 2001) and microsatellite markers (average of 5.0 alleles per locus in G15), using both kinds of markers led to very similar estimated effective size.
Selection pressures assumed to reinforce genetic drift effects on allele frequencies did not decrease the initial variability for most of the loci studied here. While drift and directional selection should increase the probability of allele fixation, mutation and migration allow for the renewal of the allelic stock. Here, allelic richness and genetic diversity already existing for microsatellite markers in the parental population were mostly conserved after 22 generations of evolution in dynamic management, suggesting that for microsatellite markers, emergence of diversity by mutation balanced the loss by selection and drift. Studying allelic diversity and its qualitative and quantitative variations over time allowed us to identify the significant evolutionary forces (mutation and selection) working on this population and their effects on the conservation of neutral diversity.
Acknowledgments
We thank C. Baron and P. Sourdille for the genotyping of the G15 generation, P. Leroy for providing the public International Triticeae Mapping Initiative map data, and S. Santoni for allele sequencing. We are grateful to T. Bataillon, D. Lachaise, and R. Bernardo for their useful comments. This work was supported by a grant from the Bureau des Ressources Génétiques and Action Concertée Incitative Informatique, Mathématiques, Physique en Biologie Moléculaire (French Ministry of Research) to F.D. and A.L.
APPENDIX: DERIVATION OF GENE GENEALOGY ESTIMATORS OF THE MUTATION RATE μ
We consider the issue in terms of gene genealogies (Kingman 1982), as a general and intuitive framework to make inferences in population genetics.
Main assumptions:
Demography:
In general it is difficult to disentangle the mutation rate from the effective size and a compound parameter is commonly inferred: the mutational parameter of the population θ = 4Neμ (for a diploid population, autosomal loci). For the present data set, as in some other instances, we have an independent way of estimating the effective size. Thus it is straightforward to deduce an estimate of the mutation rate from estimates of θ. Indeed, temporal samples are available, so it is possible to estimate the variance effective population size of the population, through temporal variations of the frequency of the ancestral alleles (preexisting the experiment; see above, diversity sections of materials and methods and results). This summary parameter provides a way to capture the demographic effect, which we neglect (nonpanmictic population with variable size). In our experimental application case, this should typically concern the specific crossing regime and increase of (seed) population size at the beginning stage of the experiment. Estimates were fairly consistent between the different time steps of the experiment, suggesting robustness of the estimators to such effects (see application below).
Mutations:
We assume that there is no homoplasy; that is, all new Sl alleles detected in the sample for locus l have a unique mutational origin. However, it is possible that a neomutant arising from one of the original variety's descendants gives rise to an allele identical to that of another original variety. Then the results would depend on the detailed configuration of the parental sample. But many of those parental variety alleles differ substantially in length size. Such homoplasies become rather unlikely under a stepwise-like model. Remaining cases should lead to a slight underestimate of the mutation rate. In addition, the assumptions are similar to the infinitely many sites model (ISM) (Watterson 1975), in the sense that we assume that all mutations occurring in the history of the sample since the beginning of the experiment are detected in the present sample. Note that our model is even more stringent than the infinite-allele model (IAM). Roughly speaking, it is assumed that each mutant occurring in the genealogy is represented in the resulting sample (i.e., that it gives rise to at least one descendant). This seems nevertheless realistic given the small number of newly arisen mutations detected in the samples and the large number of branches in the genealogy (typically ∼30 distinct lineages remain at the beginning of the experiment; see below). Indeed, a sufficient condition for all newly arisen mutants to be detected is that they appear on different subtrees descending from the various ancestors. In the worst-case scenario, with four mutations detected on a locus, the probability that a fifth one is undetected is thus <4/30 (13%) and the probability for a sixth one to remain undetected is (4/30)2 (1.7%). These probabilities clearly indicate that we are unlikely to grossly underestimate the mutation rate. Nevertheless, for two of our three analytical approaches (μ1 and μ3, see below), we extended the results to an IAM, with virtually no change in the results (slightly increased estimates of μ as expected, see below).
Preliminaries:
Since mutations are supposed to occur at a constant rate μ, the total number of mutations occurring during the genealogy of a standing sample of size n is a Poisson variable with parameter and expectation μL, where L is the total length of the genealogy also commonly called the size of the tree. In population genetics terms, L is the sum of all life spans of the common ancestors during the genealogy of the sample, that is, the real-time duration during which currently observable mutations may have occurred. Under an ISM-type model, where all mutations occurring on the tree are readily detectable in the resulting sample, a simple estimator of the mutation parameter is provided by dividing S the observed number of mutations in the current sample by L (Watterson 1975).
Partial tree:
However, in our experimental application, the initial (ancestral) state of the population is entirely known and the process needs to be considered only for the duration T of the experiment and typically not for the whole duration of the genealogy of the sample. The rest of the genealogy is thus considered as a black box leading to the observed initial point of the experiment after which (going forward in time) conditions and parameters are most controlled and finely monitored, which should limit drastically putative biases.
In particular, ST the number of new mutations having occurred since the beginning of the experiment is exactly known (under the above-mentioned mutational assumptions) and our mean estimate of the mutation rate is then provided by dividing this number by the size of the partial genealogy LT since the beginning of the experiment.
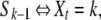
We denote by Xt the number of ancestors of the sample t units of time ago (X0 = n). As we shall see, it is not straightforward to extend general coalescent results to the partial tree case since corresponding properties should depend on the initial state, i.e., on a random variable the number of distinct ancestral founders of the sample T units of time ago XT = p.
The goal of this appendix is thus to investigate the ancestral state at this given time point, the number of ancestors XT, and above all the corresponding size LT of the partial tree.
Size of partial coalescent trees:
We propose four different methods for estimating the size of the partial tree leading to four different estimators of the mutation rate, μ1, μ2, μ3, and μ4, respectively. They rely on two different models of gene genealogies, depending on how time is modeled. The first two estimators are analytical estimators obtained under a continuous-time model (I), classically referred to as Kingman's (1982) coalescent process. The μ1 estimator neglects internode correlation induced by the partial tree conditioning (see below), while μ2 stems from an exact analytical derivation. The latter two estimators are obtained under a discrete-time analogue, the Wright–Fisher model (II). The μ3 estimator is an analytical approximation computed recursively and μ4 is based on genealogy simulations. Times and in particular T are thus real numbers for model I and integers (number of generations) for model II.
Model I—Kingman's coalescent (continuous-time model):
In this model, pairs of genes coalesce at constant rate c = 1/2Ne per time unit (generation). In other words, the most closely related pair of genes, in a sample of k genes, has a closest common ancestor that lived some random time τk ago, where τk is an exponential variable with parameter ck = ck(k − 1)/2.
μ1—neglecting internode correlation:
In Kingman's coalescent, it is easy to compute the size of the tree Lk, not for a fixed time T, but for a given number n – k + 1 of common ancestry events. Indeed, let Sn = 0 and Sk be the time of the n – k + 1th coalescence event backward in time, so that
 |
meaning that the number of ancestor genes is k between times Sk and Sk−1.
Then observe that the total length of the tree since time Sp is equal to
 |
where τk = Sk−1 − Sk is the duration of internode k. However, when T is a fixed time, it depends on the number of ancestors at the beginning of the experiment XT = p. Conditional on a given number p of ancestors, Sp is the last coalescence time, and
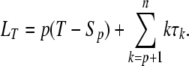 |
(A1) |
As in the standard full genealogy case, the computation of expectation and variance of the tree length are simplified by the independence of the τk's. The expectation of the tree size is then simply computed from (A1), by replacing the internode durations τk by their expectations 1/ck under the Kingman (1982) coalescent and computing the summation (A1) as long as the sum of the τk's (Sk−1) is not greater than T (continuous-time model). Then p ancestral lineages remain and the residual term of (A1) p(T – Sp) is added.
But strictly speaking, when conditioning the model on an absolute duration T, the internode durations become nonindependent from one another since they are conditioned upon their sum Sp remaining lower than T and analytical results are therefore more difficult to obtain.
μ2—taking into account internode correlations, in Kingman's coalescent, exact formulas for the expected tree length and the expected number of alleles:
We can show by induction that the Laplace transform of LT on the event that there are p ancestor genes in the population backward to time T equals
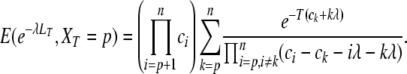 |
Taking this formula at λ = 0, as well as its derivative at λ = 0, yields respectively the probability that XT = p (the distribution of the number of ancestors time T ago) and the expectation of LT with XT = p:
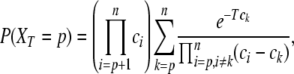 |
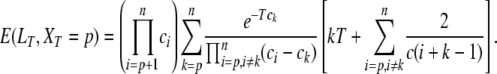 |
(A2) |
It is then straightforward to get the expectation of LT, since
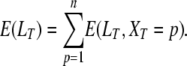 |
(A3) |
However, in this method, a numerical drift issue arose in the computation of the numerical results for some extreme sets of parameter values (low T, high n with respect to Ne). The above first two approaches are in line with the standard Kingman (1982) coalescent, assuming a binary tree (with no higher-order multifurcation, e.g., three individuals showing the same common ancestor or several pairs of individuals reaching their common ancestors at the same generation). They also assume a continuous-time approximation, replacing the geometric distribution for the coalescence times by its exponential limit. Both approximations are intended to apply to populations with large effective size with respect to the sample size and long coalescence time in generation units. Because of this limitation, this approach may not be appropriate for our (and many other) set(s) of parameter values with a small number of generations surveyed and a large sample size and with respect to the effective size.
To overcome this weakness, we now turn to a classical Wright–Fisher model.
Model 2—Wright–Fisher:
The most prominent differences with the previous model are that time is expressed in discrete generations and that more than two genes are allowed to coalesce at the same time (generation).
Each individual gene has exactly one unit of time to undergo mutation before it is passed to the next generation, so that LT is simply the sum of the X t's for t = 0, …, T.
μ3—a simple approximation formula:
It is easy to see that X0, X1, X2, … is a homogeneous nonincreasing Markov chain stopped at 1. In addition, let pk(i) be the probability for k genes to have i ancestor genes at the previous generation,
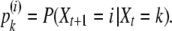 |
It is then possible to get a recurrence relationship for these transition probabilities. Namely, consider a sample of k + 1 genes as a sample of k genes plus one extra gene. This (k + 1) sample has i ancestor genes at the previous generation if either the k sample has i ancestors that include the extra gene's ancestor or the k sample has i − 1 ancestors and the extra gene has a distinct ancestor. This can be written in the neutral setting as
 |
for any i ≤ min(2Ne, k). Then let fk be the generating function of Xt when Xt−1 = k, and γ = 1/2Ne. The last recurrence relationship then translates into
 |
with the condition that f1(s) = s for any s in the interval [0, 1]. Taking derivatives at s = 1 yields the following equation for the expectation of Xt,
 |
where
 |
and α = −ln(1 − γ). Then a simple approximation for the expectation of X2 is Y2 = g(g(n)), which is equivalent to replacing X1 by its expectation in the g function. More generally we take the t-fold composition gt of g for the approximation Yt of E(Xt).
To conclude, the total length of the tree is exactly the sum of the Xk's, so the total length of the tree during the last T generations can be approximated by
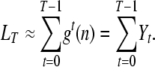 |
(A4) |
To check the limit of this approximation by recursively replacing the number of ancestors by their conditional expectation, we used a simulation approach.
μ4—Monte Carlo simulation of the WF model:
We used a backward coalescent-related Monte Carlo simulation algorithm to estimate the mean size of the trees. The principle of the algorithm is as follows: it proceeds backward, generation by generation. It starts with X0 = n genotyped individuals in the sample, with the size of the tree L0 initialized to 0. To account for the first generation, X0 is added to the current size of the tree (X0 meioses implicitly occur across the current generation in the history of the sample). To get the previous generation, for each of the X0 individuals in the sample, an ancestor is randomly drawn (with replacement) among the Ne possible ones available in the previous generation. We then compute X1, the resulting number of distinct ancestors drawn as ancestral to the sample. To move to the previous generation, X1 replaces X0. The process is repeated for the T generations of the experiment.
Variance of the mutation rate estimate:
We assume that the number S of mutations is Poisson distributed with parameter μLT, where μ is the mutation rate, independent from the total length LT of the tree. The estimator of μ is simply  . It is then well known that
  is unbiased since
 |
The same computation can be done for the variance of  ,
,
 |
so that the variance of  is equal to the mutation rate divided by the harmonic mean of LT.
Hence, an estimate of this standard variance is obtained by dividing the estimate μ4 by the harmonic mean of LT across the simulations, which is easily obtained in this approach since it empirically provides the full distribution of the tree size.
At this point of this section, we point out that the data we have are given in terms of numbers of alleles and not numbers of mutations. If there were no intermediate (not detected in the final sample) mutations, these two numbers would be equal. To take into account that it might not be the case, it is standard to consider an IAM-type model.
Infinite-allele case:
In both ISM and IAM, it is possible to derive the expected number of mutations or alleles (respectively) as a function of the mutation rate. In ISM this function is linear, so that it is straightforward to deduce an estimator of the mutation rate from the expected number of mutations. This is not the case in the IAM, although it is in principle possible to numerically invert this function to estimate the mutation rate given the observed number of alleles KT.
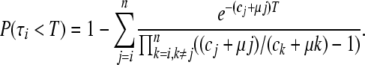
A simple argument allows, however, for a straightforward derivation of an estimate. Under IAM, while tracing the lineages backward in time, common ancestry and/or mutation events can occur. Each time a mutation is encountered before time T, a new allele is added to the sample and the corresponding lineage is stopped, since further mutations will not increment nor decrement the number of alleles KT in the final sample (Griffiths 1980; Tavaré 1984). Then the expected value of KT is calculated by adding the probability of mutation to that of common ancestry in the exponential parameters of interevent durations, and the number of alleles in the sample is simply the number of mutation events having occurred before time T, which is given by
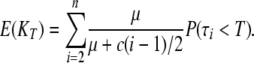 |
(A5) |
In the approximation case μ1, the rightmost term takes only marginal values 0 or 1, and (A4) can then be easily computed and inverted numerically for μ.
In the more exact correlated internode case (see section above), the last term of (A4) can be computed recursively as
 |
But inverting it numerically for μ turns out to be cumbersome, due to the above-mentioned numerical drift issue, and we do not present corresponding results.
In the Wright–Fisher approximation case (μ3), we define Zt similarly as the number of ancestor lineages in generation t backward in time that have not experienced any mutations so far (Z0 = n). Then Zt is computed as the t-fold composition of h(x) = g((1 − μ)x), and μZt accounts for the expected number of new mutations having occurred in generation y, which can then be summed over the T generations of the experiment to approximate the expected KT. This can then be solved numerically for μ.
In the simulation approach μ4, it is easy to compute the mean KT given the mutation rate by drawing in each generation the number of mutant offspring according to a binomial and then removing them from further ancestry. However, estimating the mutation rate from this approach would require more computationally intensive simulation schemes, for example, with Bayesian approaches, which seems beyond the scope of this article given the weakness of the effect involved (see below).
Case study:
Mutation rates were estimated for each of the six loci studied at intermediate generations between parents and G1, and between G1 and G15, and were estimated for each of the nine loci with new alleles between parents and G15. To estimate the mutation rates, we used the Ne estimated between parents and the 15th generation on the 21 loci. Under the null hypothesis “all loci follow the same distribution as to their coalescence time and mutation processes (and in particular show the same mutation rate and Ne),” we compared the observed distribution of the number of new alleles to the expected null Poisson distribution of parameter μLT using a chi-square test, where μ is the mean estimate over loci and LT the expected size of the partial tree. Under these assumptions the Poisson parameter was simply estimated as the mean number of new alleles per locus. The test gave a rough approximation of the homogeneous or heterogeneous behavior of the different loci with respect to their mutation rate and coalescence time. Indeed, rejection of the null hypothesis would mean only that μLT is not constant across loci with no possibility for separating the two possible causes: different mutation rates across loci or different realized LT (either derived from the same Ne value and due to stochasticity in the coalescent or due to different Ne values). For the loci considered to have a homogeneous distribution of new alleles, we applied the central limit theorem to derive the confidence interval of the mean mutation rate across loci [μ − 1.96 SE; μ + 1.96 SE].
The mutational model showed little effect on the estimates, providing slightly greater estimates with IAM as expected (the largest difference was 0.12 × 10⁻³ for μ1 at locus Cfd71_D between parents and G15, results not shown). Similarly, we expect that homoplasy, due to recurrent or reverse mutation occurring during the partial genealogy in any finite-allele or stepwise-like mutational models, should not affect much the estimates.
The μ1 and μ2 estimators based on the continuous-time Kingman model provided similar results, suggesting that the correlation among internode durations was not a major effect for our set of parameter values (Table 2). The effect should, however, be greater if the number of ancestors p at the beginning of the process was smaller. Due to a numerical drift issue for a small number of generations, μ2 could not be estimated between parents and G1, and between G1 and G15, in two cases.
For larger time steps, both μ1 and μ2 were close to the simulated μ4 (Wright–Fisher model), but provided a slightly greater estimate of the mutation rate (Table 2). These estimators probably underestimated the size of the tree and it appeared useful to relax some of the main assumptions of the standard coalescent. Two factors seemed to act in a synergetic way in this study, where many common ancestries could occur before the first generation in the standard coalescent setting. First, it is probably most relevant to allow for multiple common ancestries in such empirical cases, where the sample size might be large compared to the effective size, partly because the census size is much greater than the effective size. This might occur, for instance, in conservation-related issues although in our case even if most common ancestry events occur in the first few generations, they contribute substantially to the partial tree size given the limited total number of generations of the experiment. Since the coalescent process in continuous time does not allow for multifurcation, it may introduce a bias in the opposite direction; that is, it should put more weight on larger trees. Our results probably reflected a bias due to the second factor: the continuous-time approximation. Under this assumption, many lineages did indeed coalesce before the end of the first generation.
A striking result is that μ3 and μ4 estimators based on the same Wright–Fisher model provided virtually identical results (Table 2), showing that our approximation formula (A4) is a quick but accurate estimate of the tree size in the WF model, with very little numerical drift.
As to the effect of putative selection on our estimators, we think the method should be quite robust in comparison to such effects since it is not influenced by the frequency of newly arisen mutations, which could be shifted by selection. Finally, the method relies on an estimate of the effective size that takes into account the overall effect of selection.
A Mathematica notebook implementing the above estimators is available upon request to Frantz Depaulis.
References
- Austerlitz, F., and E. Heyer, 1998. Social transmission of reproductive behavior increases frequency of inherited disorders in a young-expanding population. Proc. Natl. Acad. Sci. USA 95 15140–15144. [DOI] [PMC free article] [PubMed] [Google Scholar]
- Beck, N. R., M. C. Double and A. Cockburn, 2003. Microsatellite evolution at two hypervariable loci revealed by extensive avian pedigrees. Mol. Biol. Evol. 20(1): 54–61. [DOI] [PubMed] [Google Scholar]
- Boutin-Ganache, I., M. Raposo, M. Raymond and C. F. Deschepper, 2001. M13-tailed primers improve the readability and usability of microsatellite analyses performed with two different allele-sizing methods. Biotechniques 31 24–27. [PubMed] [Google Scholar]
- Boyer, J. C., J. D. Hawk, L. Stefanovic and R. A. Farber, 2008. Sequence-dependent effect of interruptions of microsatellite mutation rate in mismatch repair-deficient human cells. Mutat. Res. 640 89–96. [DOI] [PubMed] [Google Scholar]
- Brohede, J., C. R. Primmer, A. Möller and H. Ellegren, 2002. Heterogeneity in the rate and pattern of germline mutation at individual microsatellite loci. Nucleic Acids Res. 30 1997–2003. [DOI] [PMC free article] [PubMed] [Google Scholar]
- Brohede, J., A. P. Möller and H. Ellegren, 2004. Individual variation in microsatellite mutation rate in barn swallows. Mutat. Res. 545 73–80. [DOI] [PubMed] [Google Scholar]
- Caballero, A., 1994. Developments in the prediction of effective population size. Heredity 73 657–679. [DOI] [PubMed] [Google Scholar]
- Chakraborty, R., M. Kimmel, D. N. Stivers, L. J. Davison and R. Deka, 1997. Relative mutational rates at di-, tri-, and tetranucleotide micosatellite loci. Proc. Natl. Acad. Sci. USA 94 1041–1046. [DOI] [PMC free article] [PubMed] [Google Scholar]
- Dellaporta, S., J. Wood and J. Hicks, 1983. A plant DNA minipreparation version II. Plant Mol. Biol. Rep. 1 19–21. [Google Scholar]
- Denver, D. R., K. Orris, A. Kewalramani, K. E. Harris, A. Chow et al., 2004. Abundance, distribution, and mutation rates of homopolymeric nucleotide runs in the genome of Caenorhabditis elegans. J. Mol. Evol. 58 584–595. [DOI] [PubMed] [Google Scholar]
- Di Rienzo, A., A. C. Peterson, J. C. Garza, A. M. Valdes, M. Slatkin et al., 1994. Mutational processes of simple-sequence repeat loci in human populations. Proc. Natl. Acad. Sci. USA 91 3166–3170. [DOI] [PMC free article] [PubMed] [Google Scholar]
- Drummond, A. J., G. K. Nicholls, A. G. Rodrigo and W. Solomon, 2002. Estimating mutation parameters, population history and genealogy simultaneously from temporally spaced sequence data. Genetics 161 1307–1320. [DOI] [PMC free article] [PubMed] [Google Scholar]
- Ellegren, H., 2004. Microsatellites: simple sequences with complex evolution. Nat. Rev. Genet. 5 435–445. [DOI] [PubMed] [Google Scholar]
- Frankham, R., 1995. Inbreeding and extinction—a threshold effect. Conserv. Biol. 9 792–799. [Google Scholar]
- Goldringer, I., and T. Bataillon, 2004. On the distribution of temporal variations in allele frequency: consequences for the estimation of effective population size and the detection of loci undergoing selection. Genetics 168 563–568. [DOI] [PMC free article] [PubMed] [Google Scholar]
- Goldringer, I., J. Enjalbert, A.-L. Raquin and P. Brabant, 2001. Strong selection in wheat populations during ten generations of dynamic management. Genet. Sel. Evol. 33(Suppl. 1): 441–463. [Google Scholar]
- Goldringer, I., C. Prouin, M. Rousset, N. Galic and I. Bonnin, 2006. Rapid differentiation of experimental populations of wheat for heading-time in response to local climatic conditions. Ann. Bot. 98 805–817. [DOI] [PMC free article] [PubMed] [Google Scholar]
- Gow, J. L., L. R. Noble, D. Rollinson and C. S. Jones, 2005. A high incidence of clustered microsatellite mutations revealed by parent-offspring analysis in the African freshwater snail, Bulinus forskalii (Gastropoda, Pulmonata). Genetica 124(1): 77–83. [DOI] [PubMed] [Google Scholar]
- Griffiths, R. C., 1980. Lines of descent in the diffusion approximation of neutral Wright-Fisher models. Theor. Popul. Biol. 17 37–50. [DOI] [PubMed] [Google Scholar]
- Guyomarc'h, H., P. Sourdille, G. Charmet, K. J. Edwards and M. Bernard, 2002. Characterisation of polymorphic microsatellite markers from Aegilops tauschii and transferability to the D-genome of bread wheat. Theor. Appl. Genet. 104 1164–1172. [DOI] [PubMed] [Google Scholar]
- Heyer, E., J. Puymirat, P. Dieltjes, E. Bakker and P. De Knijff, 1997. Estimating Y chromosome specific microsatellite mutation frequencies using deep rooting pedigrees. Hum. Mol. Genet. 6(5): 799–803. [DOI] [PubMed] [Google Scholar]
- Kayser, M., E. J. Vowles, D. Kappei and W. Amos, 2006. Microsatellite length differences between humans and chimpanzees at autosomal loci are not found at equivalent haploid Y chromosomal loci. Genetics 173 2179–2186. [DOI] [PMC free article] [PubMed] [Google Scholar]
- Kimura, M., and T. Ohta, 1978. Stepwise mutation model and distribution of allelic frequencies in a finite population. Proc. Natl. Acad. Sci. USA 75 2868–2872. [DOI] [PMC free article] [PubMed] [Google Scholar]
- Kingman, J. F. C., 1982. The coalescent. Stoch. Proc. Appl. 13 235–248. [Google Scholar]
- Kruglyak, S., R. T. Durrett, M. D. Schug and C. F. Aquadro, 1998. Equilibrium distributions of microsatellite repeat length resulting from a balance between slippage events and point mutations. Proc. Natl. Acad. Sci. USA 95(18): 10774–10778. [DOI] [PMC free article] [PubMed] [Google Scholar]
- Maccaferri, M., M. C. Sanguineti, P. Donini and R. Tuberosa, 2003. Microsatellite analysis reveals a progressive widening of the genetic basis in the elite durum wheat germplasm. Theor. Appl. Genet. 107 783–797. [DOI] [PubMed] [Google Scholar]
- Maynard Smith, J., and J. Haigh, 1974. The hitch-hiking effect of favourable gene. Genet. Res. Camb. 23 23–35. [PubMed] [Google Scholar]
- Mc Connell, R., S. Middlemist, C. Scala, J. E. Strassmann and D. Queller, 2007. An usually low microsatellite mutation rate in Dictyostelium discoideum, an organism with unusually abundant microsatellites. Genetics 177 1499–1507. [DOI] [PMC free article] [PubMed] [Google Scholar]
- Murigneux, A., D. Barloy, P. Leroy and M. Beckert, 1993. Molecular and morphological evaluation of doubled haploid lines in maize. 1. Homogeneity within Dh lines. Theor. Appl. Genet. 86 837–842. [DOI] [PubMed] [Google Scholar]
- Nei, M., 1973. Analysis of gene diversity in subdivided populations. Proc. Natl. Acad. Sci. USA 70 3321–3323. [DOI] [PMC free article] [PubMed] [Google Scholar]
- Nei, M., 1987. Molecular Evolutionary Genetics. Columbia University Press, New York.
- Nei, M., and F. Tajima, 1981. Genetic drift and estimation of effective population size. Genetics 98 625–640. [DOI] [PMC free article] [PubMed] [Google Scholar]
- Pejic, I., P. Ajmone-Marsan, M. Morgante, V. Kozumplick, P. Castiglioni et al., 1998. Comparative analysis of genetic analysis among maize inbred lines detected by RFLPs, RAPDs, SSRs, and AFLPs. Theor. Appl. Genet. 91 1001–1007. [Google Scholar]
- Plaschke, J., M. W. Ganal and M. S. Roder, 1995. Detection of genetic diversity in closely-related bread wheat using microsatellite markers. Theor. Appl. Genet. 91 1001–1007. [DOI] [PubMed] [Google Scholar]
- Röder, M. S., V. Korzun, K. Wendehake, J. Plaschke, M. H. Tixier et al., 1998. A microsatellite map of wheat. Genetics 149 2007–2023. [DOI] [PMC free article] [PubMed] [Google Scholar]
- Roussel, V., J. Koenig, M. Beckert and F. Balfourier, 2004. Molecular diversity in French bread wheat accessions related to temporal trends and breeding programmes. Theor. Appl. Genet. 108 920–930. [DOI] [PubMed] [Google Scholar]
- Rubinsztein, D. C., W. Amos, J. Leggo, S. Goodburn, S. Jain et al., 1995. Microsatellite evolution—evidence for directionality and variation in rate between species. Nat. Genet. 10 337–343. [DOI] [PubMed] [Google Scholar]
- Sainudiin, R., R. T. Durrett, C. F. Aquadro and R. Nielsen, 2004. Microsatellite mutation models: insights from a comparison of humans and chimpanzees. Genetics 168 383–395. [DOI] [PMC free article] [PubMed] [Google Scholar]
- Santiago, E., and A. Caballero, 1995. Effective size of populations under selection. Genetics 139 1013–1030. [DOI] [PMC free article] [PubMed] [Google Scholar]
- SAS, 1999. SAS/STAT User's Guide, Version 8.1. SAS Institute, Cary, NC.
- Schlötterer, C., 2000. Evolutionary dynamics of microsatellite DNA. Chromosoma 109 365–371. [DOI] [PubMed] [Google Scholar]
- Schug, M. D., C. M. Hutter, M. A. Noor and C. F. Aquadro, 1998. Mutation and evolution of microsatellites in Drosophila melanogaster. Genetica 102–103 359–367. [PubMed] [Google Scholar]
- Seyfert, A. L., M. E. A. Cristescu, L. Frisse, S. Schaack, W. K. Thomas et al., 2008. The rate and spectrum of microsatellite mutation in Caenorhabditis elegans and Daphnia pulex. Genetics 178 2113–2121. [DOI] [PMC free article] [PubMed] [Google Scholar]
- Sia, E. A., S. Jinks-Robertson and T. D. Petes, 1997. Genetic control of microsatellite stability. Mutat. Res. 383 61–70. [DOI] [PubMed] [Google Scholar]
- Storey, J. D., and R. Tibshirani, 2003. Statistical significance for genome-wide experiments. Proc. Natl. Acad. Sci. USA 100 9440–9445. [DOI] [PMC free article] [PubMed] [Google Scholar]
- Symonds, V. V., and A. M. Lloyd, 2003. An analysis of microsatellite loci in Arabidopsis thaliana: mutational dynamics and application. Genetics 165 1475–1488. [DOI] [PMC free article] [PubMed] [Google Scholar]
- Tavaré, S., 1984. Line-of-descent and genealogical processes and their applications in population genetics models. Theor. Popul. Biol. 26 119–164. [DOI] [PubMed] [Google Scholar]
- Thuillet, A. C., D. Bru, J. David, P. Roumet, S. Santoni et al., 2002. Direct estimation of mutation rate for 10 microsatellite loci in durum wheat, Triticum turgidum (L.) Thell. ssp durum desf. Mol. Biol. Evol. 19 122–125. [DOI] [PubMed] [Google Scholar]
- Thuillet, A. C., T. Bataillon, P. Sourdille and J. L. David, 2004. Factors affecting polymorphism at microsatellite loci in bread wheat [Triticum aestivum (L.) Thell]: effects of mutation processes and physical distance from the centromere. Theor. Appl. Genet. 108 368–377. [DOI] [PubMed] [Google Scholar]
- Thuillet, A. C., T. Bataillon, S. Poirier, S. Santoni and J. L. David, 2005. Estimation of long-term effective population sizes through the history of durum wheat using microsatellite data. Genetics 169 1589–1599. [DOI] [PMC free article] [PubMed] [Google Scholar]
- Tixier, M. H., P. Sourdille, M. Röder, P. Leroy and M. Bernard, 1997. Detection of wheat microsatellites using a non radioactive silver-nitrate staining method. J. Genet. Breed. 51 175–177. [Google Scholar]
- Vazquez, J. F., T. Pérez, J. Albornoz and A. Dominguez, 2000. Estimation of microsatellite mutation rates in Drosophila melanogaster. Genet. Res. Camb. 76 323–326. [DOI] [PubMed] [Google Scholar]
- Vigouroux, Y., J. S. Jaqueth, Y. Matsuoka, O. S. Smith, W. D. Beavis et al., 2002. Rate and pattern of mutation at microsatellite loci in maize. Mol. Biol. Evol. 19 1251–1260. [DOI] [PubMed] [Google Scholar]
- Waples, R. S., 1989. A generalized approach for estimating effective population size from temporal changes in allele frequency. Genetics 121 379–391. [DOI] [PMC free article] [PubMed] [Google Scholar]
- Watterson, G. A., 1975. On the number of segregation sites. Theor. Popul. Biol. 7 256–276. [DOI] [PubMed] [Google Scholar]
- Wierdl, M., M. Dominska and T. D. Petes, 1997. Microsatellite instability in yeast: dependence on the length of the microsatellite. Genetics 146 769–779. [DOI] [PMC free article] [PubMed] [Google Scholar]
- Weber, J. L., and C. Wong, 1993. Mutation of human short tandem repeats. Hum. Mol. Genet. 2(8): 1123–1128. [DOI] [PubMed] [Google Scholar]
- Webster, M. T., N. G. C. Smith and H. Ellegren, 2002. Microsatellite evolution inferred from human-chimpanzee genomic sequence alignments. Proc. Natl. Acad. Sci. USA 99(13): 8748–8753. [DOI] [PMC free article] [PubMed] [Google Scholar]
- Whittaker, J. C., R. M. Harbord, N. Boxall, I. Mackay, G. Dawson et al., 2003. Likelihood-based estimation of microsatellite mutation rates. Genetics 164 781–787. [DOI] [PMC free article] [PubMed] [Google Scholar]
- Wolfram, S., 1996. The Mathematica Book. Cambridge University Press, Cambridge/London/New York.
- Wu, K. S., and S. D. Tanksley, 1993. Abundance, polymorphism and genetic-mapping of microsatellites in rice. Mol. Gen. Genet. 241 225–235. [DOI] [PubMed] [Google Scholar]
- Xu, X., M. Peng, Z. Fang and X. Xu, 2000. The direction of microsatellite mutations is dependent upon allele length. Nat. Genet. 24 396–399. [DOI] [PubMed] [Google Scholar]
- Xu, H. Y., R. Chakraborty and Y. X. Fu, 2005. Mutation rate variation at human dinucleotide microsatellites. Genetics 170 305–312. [DOI] [PMC free article] [PubMed] [Google Scholar]
- Zhivotovsky, L. A., P. A. Underhill and M. W. Feldman, 2006. Difference between evolutionarily effective and germline mutation rate due to stochastically varying haplogroup size. Mol. Biol. Evol. 23(12): 2268–2270. [DOI] [PubMed] [Google Scholar]