

Abstract
Recent technological breakthroughs allow the quantification of hundreds of thousands of genetic interactions (GIs) in Saccharomyces cerevisiae. The interpretation of these data is often difficult, but it can be improved by the joint analysis of GIs along with complementary data types. Here, we describe a novel methodology that integrates genetic and physical interaction data. We use our method to identify a collection of functional modules related to chromosomal biology and to investigate the relations among them. We show how the resulting map of modules provides clues for the elucidation of function both at the level of individual genes and at the level of functional modules.
Keywords: data integration, gene modules, genetic interactions, protein interaction networks
Introduction
One of the central tasks of current cell biology is to reveal and understand the functional relationships between cell components. Physical interaction (PI) and genetic interaction (GI) data provide largely complementary functional information that can be used to elucidate these relationships. In particular, quantitative GIs can be a powerful source for understanding both functions of individual genes and the interplay between pathways in the cell.
GIs convey information about the phenotype of a double mutant in comparison to the phenotypes of single mutants. GIs can be crudely classified into alleviating, neutral and aggravating interactions (Segre et al, 2005; Beyer et al, 2007). In an aggravating interaction, the fitness of the double mutant is lower than expected given that of the single mutants. The most extreme example of an aggravating interaction is synthetic lethality, in which the joint deletion of two non-essential genes leads to a lethal phenotype. In an alleviating interaction, on the other hand, the double mutant is healthier than expected. The ‘expected' fitness is usually defined using a multiplicative model, as the product of the fitnesses of the single mutants (Schuldiner et al, 2005; Segre et al, 2005; St Onge et al, 2007). High-throughput mapping of aggravating interactions, in particular synthetic lethality, has first been performed in Saccharomyces cerevisiae using the SGA (Tong et al, 2004) and dSLAM (Pan et al, 2006) methods. Recently, the exploration of GI data was pushed forward by the development of the Epistatic MiniArray (E-MAP) technology, building on SGA and allowing a quantitative estimation of both aggravating and alleviating information (Schuldiner et al, 2005; Collins et al, 2007b). The largest published E-MAP to date (Collins et al, 2007b) covers GIs between 743 S. cerevisiae genes involved in various aspects of chromosome biology (we will refer to this map as the ChromBio E-MAP). It was shown that the use of quantitative data can significantly increase the amount of information on gene function (Collins et al, 2007b).
The computational analysis of E-MAPs has to address several problems. First, due to technical and biological difficulties, the ChromBio E-MAP contains as many as 40% missing values. Imputation of these values is difficult, and the computational methods require the development of ad hoc techniques to handle missing data. Second, as the single deletion mutants are not measured in the same experiment, a multiplicative model cannot be directly fitted to the data and thus it is difficult to properly interpret every individual GI. For this reason, the insights derived from the E-MAP data were so far mostly based on correlations of GI profiles, and not on the GIs themselves (Schuldiner et al, 2005; Collins et al, 2007b; Ihmels et al, 2007).
The development of high-throughput GI assays has occurred in parallel to the development of methods for genome-wide mapping of protein–protein interactions (PPIs; Collins et al, 2007a). It was recently shown that joint analysis of GIs and PIs can shed additional light on the organization of cellular pathways. This integration is particularly appealing due to the complementarity of the two interaction types: PIs describe direct spatial association between molecules, whereas GIs refer to functional associations between genes, connecting the physical architecture to phenotypes (Beyer et al, 2007). The integration of genetic and physical data was used to classify GIs as occurring between or within different pathways (Kelley and Ideker, 2005). Between-pathway GIs usually indicate partial pathway redundancy, as deletion of a single gene affects only one of the pathways, while deletion of two genes from distinct pathways leads to the inactivation of both (Tucker and Fields, 2003). Accordingly, it was found that most aggravating interactions occur between pathways (Kelley and Ideker, 2005). Zhang et al (2005) mapped pairs of complexes with many aggravating GIs between them. We have previously extended the analysis of between-pathway explanations for GIs and shown that further physical evidence can shed light on additional properties of such pathway pairs (Ulitsky and Shamir, 2007b). However, within-pathway aggravating interactions also exist: mutations in one of the two subunits of the same complex may have only a mild phenotype, as long as the complex survives. However, deletion of both subunits may lead to a complex failure and to an aggravating phenotype. On the other hand, alleviating interactions were shown to occur mostly within pathways (Collins et al, 2007b). These are the result of a drastic effect of any of the single deletions on pathway activity, which abolishes the effects of additional deletions.
In this study, we propose a novel methodology for integrating GI and PI data. While extant methods (Kelley and Ideker, 2005; Ulitsky and Shamir, 2007b) have used GI data to characterize a single pathway or a pathway pair at a time, we propose a method for analyzing all the available data together and producing a set of modules identified in the data, alongside the module pairs that exhibit significant complementarity, as evidenced by the presence of multiple aggravating GIs (Figure 1). Our method can be viewed as a clustering algorithm that explicitly addresses the relation between each pair of modules (which can be complementary or unrelated). By extracting a collection of related modules, rather than a set of module pairs as in Ulitsky and Shamir (2007b), we are able to identify weaker signals in the data and extract a consistent set of modules. Similar ideas have been successfully used by Segre et al (2005) for in silico analysis of GIs.
Figure 1.

Toy example of a modular partition. The genes are partitioned into four modules. Each module induces a connected component in the PI network. Modules A and B have multiple aggravating GIs between them and are thus designated as a CMP. The same is true for modules B and C. Module D is not involved in any CMP. Genes w, x are siblings; genes w, y are cousins; genes y, z are cousins; genes x, z are strangers.
Previous studies analyzed E-MAP data primarily using hierarchical clustering, and successfully recovered known and novel pathways and complexes (Schuldiner et al, 2005; Collins et al, 2007b). Our method has several advantages over hierarchical clustering: (a) it readily provides the pairs of modules exhibiting complementarity; (b) it produces a set of disjoint modules corresponding to putative pathways, rather than a tree; (c) the number of modules is determined by the algorithm and does not have to be determined by the user and (d) hierarchical clustering considers only similarity between pairs of gene profiles. By considering GIs between module pairs in addition to the gene similarity, our method can pick up modules based on a consistent module-wise GI pattern, even if gene profile similarity is relatively weak, e.g. due to missing values. As we shall show, these theoretical advantages indeed yield practical advantage, as we are able to identify important module relations that cannot be identified using gene similarity alone.
We applied our method to the ChromBio E-MAP and obtained a collection of modules as well as a map of related module pairs. In particular, we provided the first comprehensive map of the relationships among ChromBio modules, which could not be obtained by prior means. The results improve over extant methods in terms of the functional enrichment of the obtained modules. Using a collection of single-deletion phenotypes we found that although the modules are based on GIs measured in rich medium, they remain cohesive functional units under other conditions, emphasizing the power of the E-MAP coupled with our methodology in recovering functional modules. We showed that the module map can be utilized for function prediction on several levels: to suggest with high confidence novel functions for individual genes, to identify novel functions of complete modules and to highlight interplay between modules. In particular, we provided genetic and physical evidence for (1) a new role for the nuclear pore in the mitotic spindle checkpoint; (2) a new role for proteolysis in mitosis and (3) an interplay between the THO complex and deubiquitination.
Results
A novel methodology for partitioning E-MAPs into functional module
We developed four methods for partitioning of E-MAPs into functional modules and identifying complementing module pairs (CMPs). The methods are described in detail in Materials and methods. The methods use models that differ in the way they treat inter-module GIs and in their use of PIs. There are two basic models, ‘Alleviating' and ‘Correlated'. Both prefer partitions in which GIs between CMP modules are mostly aggravating. The Alleviating model scores highly partitions in which intra-module GIs are mostly alleviating. The Correlated model scores highly partitions in which the correlation between GI profiles are high within each module. The ‘Connected' variants of the two basic models, termed ‘AlleviatingConnected' and ‘CorrelatedConnected', also require that each module induce a connected component in the PI network.
Analysis of the ChromBio E-MAP and comparison with other methods
We analyzed the E-MAP of GIs among 743 S. cerevisiae genes involved in chromosome biology (the ChromBio E-MAP; Collins et al, 2007b) alongside a network containing 2061 PIs between the genes contained in the E-MAP. The PIs were taken from SGD and BioGrid databases (Cherry et al, 1998; Stark et al, 2006) (Supplementary information). We excluded yeast two-hybrid interactions from the analysis as we found that this improved the results (results not shown).
We compared the results obtained under each of our four formulations and of other methods for extracting modules from these data types: hierarchical clustering of the GI profiles, clustering of the GI profiles using Markov clustering (MCL; Enright et al, 2002), clustering of the PI network using MCL and previous methods for combining binary GI and PI data (Kelley and Ideker, 2005; Ulitsky and Shamir, 2007b). MCL was chosen for clustering PI data as it was recently shown to outperform other alternatives for this task (Brohee and van Helden, 2006). Different parameter values were tested for MCL and hierarchical clustering (see Materials and methods). Results were measured in terms of the enrichment for (a) GO ‘biological process' annotations, (b) MIPS complexes and (c) genes with similar phenotype (taken from SGD; Cherry et al, 1998). In all cases, we considered all the annotations that contained at least two genes in the ChromBio E-MAP (see Supplementary information for annotation lists). Statistics on the modules found by each method are given in Table I. The fraction of annotations enriched in at least one module (which we refer to as ‘recall') and fraction of modules enriched with at least one annotation (which we refer to as ‘precision') are shown in Figure 2.
Table 1.
Comparison of the modules found by different methods
| Algorithm | Reference | Number of modules | Genes in modules |
F-measure |
||
|---|---|---|---|---|---|---|
| GO biological process | MIPS complexes | SGD phenotypes | ||||
| CorrelatedConnected | This study | 62 | 313 | 0.629 | 0.496 | 0.233 |
| AlleviatingConnected | This study | 29 | 182 | 0.389 | 0.423 | 0.276 |
| Connected | This study | 53 | 446 | 0.420 | 0.316 | 0.262 |
| Alleviating | This study | 54 | 457 | 0.257 | 0.213 | 0.187 |
| US | Ulitsky and Shamir (2007b) | 46 | 229 | 0.559 | 0.381 | 0.188 |
| KI | Kelley and Ideker (2005) | 98 | 305 | 0.602 | 0.468 | 0.167 |
| MCL:PPI I=1.2 | Enright et al (2002) | 22 | 597 | 0.397 | 0.202 | 0.113 |
| MCL:PPI I=2 | Enright et al (2002) | 116 | 585 | 0.620 | 0.425 | 0.117 |
| MCL:PPI I=3 | Enright et al (2002) | 154 | 552 | 0.574 | 0.333 | 0.114 |
| MCL:PPI I=4 | Enright et al (2002) | 161 | 517 | 0.553 | 0.292 | 0.078 |
| MCL:PPI I=5 | Enright et al (2002) | 158 | 477 | 0.528 | 0.259 | 0.082 |
| MCL:E-MAP I=3 | Enright et al (2002) | 3 | 754 | 0.179 | 0.065 | 0.220 |
| MCL:E-MAP I=5 | Enright et al (2002) | 10 | 750 | 0.326 | 0.211 | 0.249 |
| MCL:E-MAP I=7 | Enright et al (2002) | 21 | 735 | 0.381 | 0.330 | 0.225 |
| MCL:E-MAP I=9 | Enright et al (2002) | 33 | 690 | 0.425 | 0.284 | 0.196 |
| MCL:E-MAP I=11 | Enright et al (2002) | 40 | 654 | 0.378 | 0.267 | 0.170 |
| Hierarchical t=0.2 | Collins et al (2007b) | 110 | 736 | 0.407 | 0.212 | 0.210 |
| Hierarchical t=0.3 | Collins et al (2007b) | 124 | 567 | 0.508 | 0.271 | 0.198 |
| Hierarchical t=0.4 | Collins et al (2007b) | 90 | 384 | 0.547 | 0.314 | 0.209 |
| Hierarchical t=0.5 | Collins et al (2007b) | 78 | 269 | 0.526 | 0.250 | 0.209 |
| Hierarchical t=0.6 | Collins et al (2007b) | 52 | 167 | 0.429 | 0.198 | 0.105 |
| Hierarchical t=0.7 | Collins et al (2007b) | 29 | 92 | 0.337 | 0.169 | 0.138 |
Only modules with at least two genes are considered. The highest F-measure (see Results) in each column is in bold. In MCL clustering, the I parameter is the ‘inflation' parameter of the algorithm. In hierarchical clustering, the t parameter is the threshold used to extract modules from the clustering tree (see Materials and methods).
Figure 2.

Comparison of the functional coherence of modules found by different methods. Only modules with at least two genes and categories with at least two genes in the E-MAP were considered. The methods are compared in terms of the fraction of annotations enriched with P<0.001 in at least one module and the fraction of modules enriched with P<0.001. ‘US' is an implementation of a method that is similar to CorrelatedConnected, but looks for a single CMP pair at a time (Ulitsky and Shamir, 2007b). ‘KI' is an implementation of the method proposed by Kelley and Ideker (2005) where edges in the GI graph appear between any pair of genes with an S-score below −3. MCL clustering of the PPI network and of the E-MAP correlations was executed with different parameters (see Table I). For clarity, only the execution with the highest F-measure is shown. Different symbols represent different data sources. All the methods were applied to the same E-MAP and PI data sets.
We summarized recall and sensitivity using the F-measure (Van Rijsbergen, 1979), which is the weighted harmonic mean of precision and recall: F=2̇(precisioṅrecall)/(precision+recall). The F-measures of the different methods are listed in Table I. It is evident that both ‘Correlated' variants usually outperform the corresponding ‘Alleviating' variants. An inspection of well-characterized yeast complexes (Supplementary Figure 2) reveals the reason for this superiority. Except for a few complexes (e.g., prefoldin and SWR1), pairs of genes within the same complex generally do not exhibit strong alleviating GIs. We found many cases in which the S-scores between members of the same complex were missing (e.g. in the mediator complex), neutral or aggravating (e.g., in the SAGA complex). Our results thus indicate that although positive S-scores (corresponding to alleviating GIs) do, to some extent, enable extraction of functional modules, correlations of S-score profiles are more helpful for this task.
As expected, it is also evident that using information on the PI network allows for a more biologically meaningful solution, as the ‘CorrelatedConnected' formulation usually outperforms the ‘Correlated' one (an exception is the phenotype analysis, where connectivity seems to worsen the results, see also Supplementary Figure 4). When considering all three benchmarks together, using GIs together with PIs improves upon using the PI data alone for module identification, as evident by higher F-measures of our methods when compared to MCL clustering of the PI network.
A comparison of the methods thus reveals that the ‘CorrelatedConnected' formulation outperforms other alternatives. We therefore used the results of the CorrelatedConnected formulation (Figure 3) in all subsequent analysis. Figure 3 presents a ‘heatmap' of the solution focusing on intra-module and inter-complementing module pairs (CMP) interactions. An alternative presentation showing all interactions is shown in Supplementary Figure 3. A searchable interface to the module collection obtained using this method is available at http://acgt.cs.tau.ac.il/emap/chromBio/.
Figure 3.

A summary map of the modules found in the ChromBio E-MAP. (A) The heat map shows the ChromBio S-scores between genes appearing in modules with at least two genes found using the CorrelatedConnected method. Rows and columns correspond to genes, ordered so that genes in the same module appear consecutively. Selected module names and functions are listed on the right. Green lines separate modules. Modules are sorted by their size. To facilitate recognition of CMPs, rectangles corresponding to NMPs are drawn in black. In rectangles corresponding to CMPs, the S-scores are colored by scale (blue––alleviating, red––aggravating, white––neutral). Missing values are in gray. (B) Module examples. The node labels correspond both to the gene and to the protein and therefore capitalised. Edges correspond to protein–protein interactions. In each module, the genes having the GO annotation most enriched in the module are in yellow. Module networks were drawn using MATISSE (Ulitsky and Shamir, 2007a). (C) A blowup of the submatrix showing the S-scores between genes in modules 15, 14 and 8. Modules 15 and 8 form a CMP; Modules 15 and 14 form a CMP; modules 14 and 8 do not.
Functional characterization of the modules
When correcting for multiple testing using TANGO (Shamir et al, 2005), we found that 27 out of 62 modules were significantly enriched (P<0.05) for GO ‘biological process' and 32 were enriched for a GO ‘cellular compartment' (looking only at subterms of ‘protein complex'). Together, 45 modules (72.5%) were enriched with a known annotation. Manual inspection of the remaining 17 modules revealed that 11 of them in fact match known complexes, which are not annotated in GO. A full listing of the modules and their functions appears in Supplementary information. The fact that the vast majority of the modules (56 out of 62) correspond to known protein complexes demonstrates the ability of our approach to identify functionally cohesive units. In addition, as we show below, it appears that the main power of the modular approach is in identifying novel protein functions.
Protein function prediction
As our method can extract functionally coherent modules, it can reveal novel gene functions through ‘guilt by association'. When a module is significantly enriched with a function, unannotated genes in the module can be predicted to have the same function. Using cross-validation (see Materials and methods), we estimate that this method can predict the correct function for a protein in 161 out of 204 (78.9%) of the cases. This figure is likely to be an underestimate of the specificity of our method, as even for some of the most studied proteins not all the functions are known. After manual evaluation of the obtained modules, we identified several cases where our predictions had some support from other experimental evidence:
Gbp2 is a poly(A+) RNA-binding protein, involved in the export of mRNAs from the nucleus to the cytoplasm. It shares a module together with four members of the NuA4 histone acetyltransferase complex, as well as with a histone methyltransferase (Set2) and Rco1, part of the Rpd3S histone deacetylase complex (Figure 4A). Evidence for co-transcriptional processing of RNA has accumulated in the recent years, and it is becoming clear that RNA expression, stability and export from the nucleus are tightly regulated (Keene, 2007). Indeed, ChIP experiments have shown that Gbp2 is localized to the promoters of actively transcribed genes (Hurt et al, 2004). We thus propose that the interaction between Gbp2 and chromatin remodelers plays a role in the coupling of transcription with mRNA export.
YDL176W is a non-essential gene of unknown function, which appears in module 17, together with five genes involved in the ubiquitination of fructose-1,6-bisphosphatase (FBPase), as part of the gluconeogenesis pathway (Figure 4B). Indeed, a structure-based study has recently suggested that this protein is involved in glycolysis and gluconeogenesis (Ferre and King, 2006). The fact that our method suggests the same function, using a completely different methodology and data, further supports the conjecture that YDL176W is involved in gluconeogenesis. The five genes in module 17 with a known role in FBPase degradation were identified using a genome-wide reverse genetics screen (Regelmann et al, 2003). We suggest that analysis of the stability of an FBPase-β-galacosidase fusion in strains deleted for YDL176W can be carried out to further analyze its function.
Module 25 contains YTA7 (YGR270W), an ATPase of unknown function, alongside five genes involved in chromatin silencing at the telomeres and other heterochromatic regions (Figure 4C). Indeed, it has been found that mutations in YTA7 lead to shortened telomeres (Askree et al, 2004). In addition, YTA7 was recently shown to be required for preventing the spreading of silencing beyond the heterochromatic HMR locus (Jambunathan et al, 2005). A better characterization of its role will require genomic location studies to characterize its genomic distribution (Ren et al, 2000).
Module 27 contains YKL023W, a protein of unknown function, together with three known members of the SKI complex (Ski2, Ski3 and Ski8; Figure 4D). The SKI complex is involved in exosome-mediated 3′–5′ mRNA degradation and the inhibition of translation of non-poly(A) mRNAs. YKL023W was shown to physically interact with a fragment of Nmd2, involved in nonsense-mediated mRNA decay (He et al, 1997). We thus suggest that YKL023W is involved in mRNA degradation. Further insights into this role will require characterization of some RNA forms processed by the exosome, such as U4 snRNA (van Hoof et al, 2000), in a strain deleted for YKL023W.
Figure 4.

Modules with proposed novel protein functional annotations. Edges correspond to PIs. In each module, genes associated with the main annotation are drawn in yellow and with a thick border. (A) Module 14. The highlighted (yellow) genes belong to the NuA4 histone acetyltransferase complex. (B) Module 17. Genes associated with gluconeogenesis are highlighted. (C) Module 25. Genes associated with chromatin silencing at the telomere are highlighted. (D) Module 27. SKI complex genes are highlighted.
Phenotype analysis
Our algorithm partitions the genes into modules based on GIs and PIs, both of which are usually measured in rich medium. We tested the similarity between the phenotypes exhibited by mutants of genes in the same module in other growth conditions. To this end, we used data from the high-throughput phenotype profiling performed by Brown et al (2006). We defined phenotypic similarity as the Pearson correlation between the phenotypic profiles of the mutants. We found that genes within the same module tended to exhibit phenotypic similarity far greater than expected at random (average r=0.424, P<0.01). Examples of highly coherent modules include the modules 50 (‘Postreplication DNA repair', the genes are required for survival following treatment with DNA-damaging factors such as UV, IR, cisplastin and oxaloplatin), 20 (‘HIR', a strong phenotype in environments with a high or low pH and high salt) and 14 (‘Elongator', a strong phenotype after treatments with antimycin, benomyl, idarubicin and in elevated pH and salinity). The full list appears in Supplementary information.
We also examined the phenotypic similarity in CMPs. The average phenotypic similarity between genes in different modules that constitute a CMP was 0.156, as opposed to 0.087 between non-complementary module pairs (P<0.001). Interestingly, we also observed several CMPs with very dissimilar phenotypic profiles. The most dissimilar pair (r=−0.25) was formed by modules 49 and 18 (‘SAGA'; Supplementary Figure 5). Both modules contain deubiquitination complexes, and in particular the ubiquitin-specific proteases Ubp3 and Ubp8. In this case, the negative correlation probably results from the combination of largely different specificity of the proteases (Zhang, 2003), and partial functional buffering, reflected in the aggravating GIs between the modules.
A map of modules and their relations
One of the merits of our approach is its ability to identify, on top of the modular decomposition, complementarity between modules. We identified 153 CMPs in the ChromBio E-MAP. A map of the modules we identified in the ChromBio E-MAP and their relationships is shown in Figure 5. We used the various annotations and, where possible, manually assigned module names, which are used below (listed in Supplementary information). Coarse-grained annotation of the module map into main cellular processes (Figure 5) reveals a complex picture of interplay between modules, indicating the pleiotropy of the genes involved in chromosome biology. Evidently, most CMPs are formed by modules annotated by similar biological processes (Figure 5). In addition, a large number of CMPs link transcription with chromatin modification and DNA repair with DNA replication. Using GO semantic similarity (Lord et al, 2003), we found a significant negative correlation between the average S-scores and the functional similarity over all module pairs (Spearman correlation ρ=−0.105, P=7.38 × 10⁻⁶). Importantly, this correlation was much higher than the correlation between functional similarity and S-scores for individual gene pairs (ρ=−0.023). This suggests that redundancy is manifested more strongly at the level of the functional unit, i.e. the module, than on the level of individual genes. We provide several examples of how CMPs formed by seemingly functionally unrelated modules can lead to biological insight. Note that these relationships could not be identified by methods using solely S-score profile similarity, as in all cases the similarity between the S-score profiles of genes from different modules was close to 0 (Figure 6).
Figure 5.

Modules identified in the ChromBio E-MAP and relationships among them. Every node in the network represents a module. Node radius is proportional to the module's size. Node labels are the module number or its primary annotation. Edges connect pairs of modules that form a CMP. The edge width is inversely proportional to the average S-score between the two modules in the CMP: thicker edges correspond to stronger aggravating GIs, dashed edges correspond to weak aggravating GIs (−3⩽ S-score ⩽0). Edge color is proportional to the GO semantic similarity (Lord et al, 2003) between cousins in the CMP. Figure was produced using Cytoscape (Shannon et al, 2003).
Figure 6.

CMP examples. In each example, on the left the two subnetworks forming the pair are shown in different colors. In the middle, the S-scores between the genes in the CMP are color-coded. Blue rectangles correspond to alleviating GIs and red rectangles correspond to aggravating GIs. On the right, the correlations between the S-score profiles of genes in the CMP are color-coded. Green lines separate the modules.
The role of nuclear pore in the mitotic spindle checkpoint
An interesting CMP linking seemingly unrelated processes consists of modules 21 (‘mitotic spindle checkpoint') and 63 (Figure 6A). Module 63 contains two genes: SAC3 and THP1, both associated with the nuclear pore, with roles in transcription regulation and mRNA export. Some evidence of a relationship between the nuclear pore and the mitotic spindle checkpoint can be found in the literature. The spindle checkpoint proteins Mad1 and Mad2 (both part of the module 21) were shown to reside predominantly at the nuclear pore throughout the cell cycle (Iouk et al, 2002). Several components of the nuclear pore complex (such as Nup170) are specifically associated with chromosome segregation (Iouk et al, 2002; Scott et al, 2005). Furthermore, Mad1 has a role in transport of specific proteins, such as Pho4, through the nuclear pore (Iouk et al, 2002). A role for nuclear pore complexes in the spindle assembly was also shown in higher eukaryotes (Orjalo et al, 2006). However, we found no reports of this novel relationship between the Sac3-Thp1 complex and the mitotic spindle checkpoint proteins. sac3 deletion mutants accumulate in mitosis as large budded cells with extended microtubules, and have an increased rate of chromosome loss compared to wild-type strains (Bauer and Kolling, 1996). As evident in Figure 5, the genes in both modules exhibit GIs with several other modules, and thus the specific elucidation of the connection between Sac3-Thp1 and the mitotic spindle checkpoint would have been very difficult without a focused module map such as the one presented here. Moreover, this connection could not be picked up using S-score correlations alone, as the smallest hierarchical clustering subtree that contained the genes in modules 21 and 63 consisted of 231 genes.
The role of the proteasome in mitosis
Another CMP that crosses process boundaries and connects seemingly unrelated modules links module 12 (‘Proteasome') with module 46 (Figure 6B). Module 46 contains three proteins (Kar3, Cik1 and Vik1) involved in microtubule-related processes in mitosis and meiosis. Kar3 is a kinesin-14 protein that forms heterodimers with both Cik1 and Vik3 and acts as a motor to pull chromosomes apart. The proteasome (the complex in charge of most protein degradation in the cell) is known to affect progression through cell cycle (Gordon and Roof, 2001; May and Hardwick, 2006). Inspection of single-deletion phenotypes reveals that mutants of genes from module 12 (in particular Rpn10, Sem1 and Ump1) show relative benomyl resistance (Brown et al, 2006). Benomyl is an antimitotic drug that destabilizes microtubules and inhibits microtubule-mediated processes, including nuclear division, nuclear migration and nuclear fusion (Hampsey, 1997). The fact that we observe particularly strong aggravating GIs between the proteasome and the three members of module 46 suggests another link between proteolysis and the mitotic spindle, involving the Kar3 kinesin. One possible explanation for this relation is that alternative kinesin motors are prevented from functioning by a protein(s) that is a substrate for proteasomal degradation. Thus, lack of proteasome activity is genetically equivalent to lack of the alternative motor, exhibiting strong aggravating GIs. A similar parallel pathway is the one that restricts the activity of the alternative kinesin motors Cin8 and Kip1 by CDK-mediated proteasomal degradation (Crasta et al, 2006).
Deubiqutination and the THO complex
Module 49 contains Bre5 and Ubp3, which together form a deubiquitination complex with known roles in regulating vesicle traffic (Cohen et al, 2003), transcriptional regulation through TFIID (Auty et al, 2004) and DNA damage (Bilsland et al, 2007). These roles closely correspond to the CMPs that include module 49 (Figure 5). Our map shows a strong GI between this module and module 31, which contains three proteins from the THO complex, involved in transcription elongation and its coupling to mRNA export (Figure 6C). Our analysis thus uncovers a coordinated activity of the Bre5-Ubp3 deubiquitination and the THO complexes, most likely during transcription elongation. Such coordination might be required to prevent DNA damage from occurring during transcription; indeed, mutations in members of either complex result in increased sensitivity to DNA-damaging agents and hyper-recombination (Bilsland et al, 2007; Garcia-Rubio et al, 2008). In addition, recent experiments demonstrate a new role for the THO complex in transcription-coupled DNA damage repair (Gaillard et al, 2007). A connection was found between THO complex activity during transcription, and an alternative DNA repair pathway involving ubiquitin-mediated inactivation of RNA polymerase II (Somesh et al, 2005). On the basis of our results, we propose that under specific circumstances, deubiquitination of RNA polymerase II by the Bre5-Ubp3 complex may allow resumption of transcription.
Discussion
Analysis of GI data is an important challenge in computational biology. It was previously demonstrated that integrated analysis of GIs and PIs is a powerful approach for outlining pathways and for identifying pairs of complementing pathways (Kelley and Ideker, 2005; Ulitsky and Shamir, 2007b). Here, we have shown how this integration can be extended in two important directions. First, we handle a richer source of GI data, provided by the E-MAP technology. Second, we describe an algorithmic approach that is capable of extracting a comprehensive map of multiple modules along with their relationships, rather than focusing on a single module or on a module pair. This approach is capable of identifying significant modules that exhibit weak but consistent GIs.
As our formulation of the module-finding problem is computationally hard, we use an efficient greedy heuristic for finding high-scoring partitions. As a very large percentage of the modules we identify correspond to known complexes or pathways, it is evident that this heuristic performs quite well in detecting functional modules. However, as a local search algorithm, our algorithm may converge to a local minimum. More precise algorithms for the problem could further improve the results. Addition of an ability to assign confidence to individual predictions is also expected to boost the applicability of our method. In the PPI network used in this study, we chose to exclude yeast two-hybrid interactions as we found that this improved the results. However, this exclusion may bias our current results toward detection of protein complexes. PI confidence schemes (Qi et al, 2006; Suthram et al, 2006) should be helpful for a better incorporation of all possible interaction evidence into our framework.
The terminology of a ‘module' is frequently used in different settings in systems biology (Hartwell et al, 1999). On some level, the entire collection of genes tested in the ChromBio E-MAP can be considered a module, as they were all selected based on their role in chromosome biology. Some methods for analysis of GI data (e.g. Segre et al, 2005; Collins et al, 2007b) produce a hierarchical collection of modules. This approach has some advantages as description of biological processes is inherently hierarchical (e.g., different chromatin remodeling complexes form a ‘chromatin remodeling' module). However, systematic prediction of gene function and module function is more difficult in this setting. A hierarchical tree for the ChromBio E-MAP encompasses hundreds of highly overlapping modules. Here, we use PI data in an attempt to identify distinct modules of genes acting cooperatively in the cell, which can be used for systematic prediction.
We compared two methods for scoring gene similarity: one based on alleviating interactions and another based on similarity of GI profiles across the entire E-MAP. Our results indicate that the use of profile similarity is generally superior when analyzing the ChromBio E-MAP. A recent study by Bandyopadhyay et al (2008), which was published while this article was in revision, used a combination of PIs and GIs, and found that modules enriched with aggravating interactions are also of interest, as they frequently correspond to essential complexes. It was also suggested that pairs of pathways could exhibit multiple alleviating interactions between them in some cases (Segre et al, 2005). Therefore, further research on alternative scoring schemes may reveal other types of interactions within functional modules.
The main contribution of our approach to the analysis of E-MAP data is in our ability to identify not only the modules in the data but also the relationships among them. As we illustrate above, analysis of the data in light of the CMP relationship is a powerful tool for improving our understanding of the roles played by the modules.
Materials and methods
Problem formulation and the probabilistic model
We are given a PI network G=(V, E) and a matrix of GI scores S (which we denote S-scores as in Collins et al, 2006). We are interested in obtaining a partition of the network nodes into subsets M={M1, … , Mm, R}, in which each module Mi corresponds to a cohesive biological unit and R is a set of singleton genes that do not belong to modules. We distinguish between two types of module pairs: (a) module pairs exhibiting a large number of aggravating GIs, which we call CMPs and (b) pairs of unrelated modules, which we call neutral module pairs (NMPs). We refer to a pair of genes as: (a) siblings if both genes are assigned to the same module; (b) cousins if they are assigned to two different modules that together form a CMP and (c) strangers otherwise (see toy examples in Figure 1). The modular decomposition we seek to score consists of the partition M alongside the set of CMPs C={(Mi, Mj)}.
We tested four different problem formulations; the formulations differ in the way they treat within-module similarity and connectivity of a module. We denote the different formulations Alleviating, AlleviatingConnected, Correlated and CorrelatedConnected. In all formulations, we modeled the set of S-scores as coming from a mixture of three Gaussian distributions: Gm for pairs of genes with exceptionally high scores (corresponding to alleviating GIs); Gf for pairs of genes with exceptionally low scores (corresponding to aggravating GIs) and Gn for pairs with neutral S-scores. These assumptions have a theoretical justification (Sharan and Shamir, 2000), and we verified that they hold on the E-MAP data using quantile plots (see Supplementary Figure 1 and Supplementary information).
The Alleviating model
We first describe the Alleviating model formulation. In this variant, we looked for modules with the following properties: (a) siblings exhibit mostly alleviating GIs and (b) cousins exhibit mostly aggravating GIs. We formulate the score of a putative solution as a hypothesis-testing question. Given the partition M and the set of CMPs C, the null hypothesis H0 is: M is a random partition, and the modular hypothesis H1 is: M exhibits a biologically plausible modularity. Formally, in the modular hypothesis: (a) the S-scores between siblings come from Gm with a high probability βm and from Gn otherwise; (b) the S-scores between cousins come from Gf with a high probability βf and from Gn otherwise and (c) The S-scores between strangers come from distribution Gm with probability pm, from Gf with probability pf, and from Gn otherwise. Thus, the likelihood of an S-score between two genes under the module hypothesis is:  Under the null hypothesis, for each gene pair, the probability that its S-score comes from distribution Gx is px. The probability under the null model is thus:
  . By setting the partition score to
 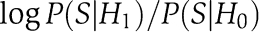 , we get that by maximizing this score we obtain partitions of maximum likelihood ratio. Assuming independence between gene pairs, the partition score can be decomposed over all pairs of nodes:
 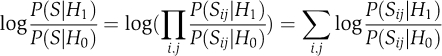 Note that if we denote
 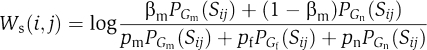 and
and 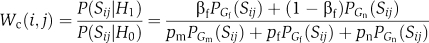 the partition score is
The Correlated model
The Correlated model formulation scores GIs between cousins as before, but differs in scoring GIs between siblings. Instead of scoring a pair of genes based on the single GI between them, it scores the pair based on their full GI profiles. The same score was used with hierarchical clustering in Collins et al (2006). Let Cij denote the correlation between the GI profiles of genes i and j (which we call the C-score). We model the distribution of C-scores as a mixture of two Gaussian distributions, GmC for siblings and GnC for non-siblings (see Supplementary Figure 1 and Supplementary information). In the model hypothesis, we assume that correlations between the profiles of genes within the same module come from GmC with probability βmC and from GmC otherwise. The likelihood of the C-score under the module hypothesis is thus: 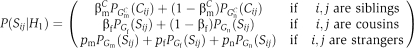
Connectivity requirements
We tested two variants for each of the two models described above: one that used solely the E-MAP data and another in which each module was required to induce a connected subnetwork in G. We denote the latter models as AlleviatingConnected and CorrelatedConnected.
Finding high-scoring partitions
We first established that the problems we are studying are computationally hard by a reduction from the related correlation clustering problem (see Supplementary information). While several approximation algorithms for the latter problem are available (Demaine and Immorlica, 2003; Demaine et al, 2006), they cannot be applied directly in our setting. We thus developed a greedy heuristic for detection of high-scoring partitions. Starting from a partition in which each module contains a single node from V, we iteratively apply two update steps. In the first step, the node whose module re-assignment provided the highest score improvement is selected and re-assigned accordingly. When no such node is found, we look for pairs of modules that could be merged to improve the partition score. In the Connected formulations, we require that the re-assignments maintain the connectivity of all the modules. In the second step, the set of CMPs is re-computed. For every pair of modules Mi and Mj, we compute the contribution to the score of the solution if (Mi, Mj) is included in the set of CMPs:  . The pair is included in the CMP set if this contribution is significantly high (see below).
We found that the above algorithm has difficulties in finding good improving moves when starting from singleton sets. We therefore developed a two-phase approach: we first execute the greedy algorithm until convergence when using only the first step, i.e. keeping C empty. In the second phase, we execute the full algorithm as described above.
Identifying significant CMPs
To assess each candidate CMP (M1, M2), we evaluated the significance of the aggravating GIs between the modules given their overall GI profiles. To this end, for every gene gi∈M1, we compared the values of the Wp weights between gi and the genes in M2 to the entire weight profile of gi using the Wilcoxon rank-sum test. Let us denote the significance by pi1. {pi1} is then transformed into a single significance level using the z-transform (Stouffer's method; Hedges and Olkin, 1985). p2 is computed in a similar way, evaluating the significance of the weights between M1 and M2 given the weight profiles of the genes in M2. Finally, M1 and M2 are declared as CMPs if and only if max(p1, p2)<0.005. Note that these P-values are not corrected for multiple testing due to evaluation of a large number of possible CMPs by the algorithm. Therefore, this score is a heuristic, which, as we shall show, is successful as identifying biologically meaningful CMPs.
Parameter estimation
The parameters of the Gaussian distributions (including pm and pf) were estimated using a standard expectation-maximization algorithm (Bilmes, 1997). In all the results reported here, we used βm=βf=0.7. We validated that the results reported here are robust to the choice of these parameters (see Supplementary information).
Hierarchical clustering analysis
Hierarchical clustering of the E-MAP data was performed using average linkage as in Collins et al (2007b). Pearson correlation was used as a distance measure between pairs of GI profiles. When computing the correlation between profiles Xi and Xj, only positions in which neither profile had missing data were used. For comparison with other methods, modules were constructed using the hierarchical clustering tree, by extracting maximal subtrees in which the average correlation of the GI patterns was above a threshold t.
Assessing the reliability of function prediction
We performed cross-validation to assess the reliability of function prediction using the modular partition. The following process was repeated for each annotated gene in every module. We hid the gene's annotation and predicted it based on the annotations of the rest of the module's genes. We used the GO biological process annotation and predicted a function only if its enrichment in the module had P<0.001. A prediction was considered correct if the majority of the predicted biological processes were correct, and wrong otherwise. The reliability was defined as the fraction of correct predictions. All GO biological process categories with at least two genes in the E-MAP were considered. To predict a relatively narrow function, we considered only genes that shared at least one GO category with no more than 30 other genes in the E-MAP. In total, 204 genes were considered.
Supplementary Material
Supplementary File 1
Supplementary File 2
Supplementary File 3
Supplementary Information
Acknowledgments
We thank Roded Sharan, Eytan Ruppin, Trey Ideker and Nevan Krogan for helpful discussions regarding this study. We thank the referees of this study for many helpful comments. IU is a fellow of the Edmond J Safra Bioinformatics program at Tel-Aviv University. Research in the MK lab was supported by grants from the Israel Science Fund and the Israel Ministry of Science and Technology. RS was supported in part by the Wolfson foundation and by the Raymond and Beverly Sackler Chair for Bioinformatics at Tel Aviv University.
References
- Askree SH, Yehuda T, Smolikov S, Gurevich R, Hawk J, Coker C, Krauskopf A, Kupiec M, McEachern MJ (2004) A genome-wide screen for Saccharomyces cerevisiae deletion mutants that affect telomere length. Proc Natl Acad Sci USA 101: 8658–8663 [DOI] [PMC free article] [PubMed] [Google Scholar]
- Auty R, Steen H, Myers LC, Persinger J, Bartholomew B, Gygi SP, Buratowski S (2004) Purification of active TFIID from Saccharomyces cerevisiae. Extensive promoter contacts and co-activator function. J Biol Chem 279: 49973–49981 [DOI] [PubMed] [Google Scholar]
- Bandyopadhyay S, Kelley R, Krogan NJ, Ideker T (2008) Functional maps of protein complexes from quantitative genetic interaction data. PLoS Comput Biol 4: e1000065. [DOI] [PMC free article] [PubMed] [Google Scholar]
- Bauer A, Kolling R (1996) The SAC3 gene encodes a nuclear protein required for normal progression of mitosis. J Cell Sci 109 (Part 6): 1575–1583 [DOI] [PubMed] [Google Scholar]
- Beyer A, Bandyopadhyay S, Ideker T (2007) Integrating physical and genetic maps: from genomes to interaction networks. Nat Rev Genet 8: 699–710 [DOI] [PMC free article] [PubMed] [Google Scholar]
- Bilmes JA (1997) A gentle tutorial of the EM algorithm and its application to parameter estimation for Gaussian mixture and hidden Markov models. International Computer Science Institute, Berkeley, CA, Technical Report ICSI-TR-97-021
- Bilsland E, Hult M, Bell SD, Sunnerhagen P, Downs JA (2007) The Bre5/Ubp3 ubiquitin protease complex from budding yeast contributes to the cellular response to DNA damage. DNA Repair (Amst) 6: 1471–1484 [DOI] [PubMed] [Google Scholar]
- Brohee S, van Helden J (2006) Evaluation of clustering algorithms for protein–protein interaction networks. BMC Bioinformatics 7: 488. [DOI] [PMC free article] [PubMed] [Google Scholar]
- Brown JA, Sherlock G, Myers CL, Burrows NM, Deng C, Wu HI, McCann KE, Troyanskaya OG, Brown JM (2006) Global analysis of gene function in yeast by quantitative phenotypic profiling. Mol Syst Biol 2: 0001. [DOI] [PMC free article] [PubMed] [Google Scholar]
- Cherry JM, Adler C, Ball C, Chervitz SA, Dwight SS, Hester ET, Jia Y, Juvik G, Roe T, Schroeder M, Weng S, Botstein D (1998) SGD: Saccharomyces Genome Database. Nucleic Acids Res 26: 73–79 [DOI] [PMC free article] [PubMed] [Google Scholar]
- Cohen M, Stutz F, Belgareh N, Haguenauer-Tsapis R, Dargemont C (2003) Ubp3 requires a cofactor, Bre5, to specifically de-ubiquitinate the COPII protein, Sec23. Nat Cell Biol 5: 661–667 [DOI] [PubMed] [Google Scholar]
- Collins SR, Kemmeren P, Zhao XC, Greenblatt JF, Spencer F, Holstege FC, Weissman JS, Krogan NJ (2007a) Toward a comprehensive atlas of the physical interactome of Saccharomyces cerevisiae. Mol Cell Proteomics 6: 439–450 [DOI] [PubMed] [Google Scholar]
- Collins SR, Miller KM, Maas NL, Roguev A, Fillingham J, Chu CS, Schuldiner M, Gebbia M, Recht J, Shales M, Ding H, Xu H, Han J, Ingvarsdottir K, Cheng B, Andrews B, Boone C, Berger SL, Hieter P, Zhang Z et al. (2007b) Functional dissection of protein complexes involved in yeast chromosome biology using a genetic interaction map. Nature 446: 806–810 [DOI] [PubMed] [Google Scholar]
- Collins SR, Schuldiner M, Krogan NJ, Weissman JS (2006) A strategy for extracting and analyzing large-scale quantitative epistatic interaction data. Genome Biol 7: R63. [DOI] [PMC free article] [PubMed] [Google Scholar]
- Crasta K, Huang P, Morgan G, Winey M, Surana U (2006) Cdk1 regulates centrosome separation by restraining proteolysis of microtubule-associated proteins. EMBO J 25: 2551–2563 [DOI] [PMC free article] [PubMed] [Google Scholar]
- Demaine ED, Emanuel D, Fiat A, Immorlica N (2006) Correlation clustering in general weighted graphs. Theor Comput Sci 361: 172–187 [Google Scholar]
- Demaine ED, Immorlica N (2003) Correlation clustering with partial information. Approximation, Randomization, and Combinatorial Optimization: Algorithms and Techniques: 6th International Workshop on Approximation Algorithms for Combinatorial Optimization Problems, APPROX 2003, and 7th International Workshop on Randomization and Approximation Techniques in Computer Science, RANDOM 2003. Princeton, NJ, USA, 24–26 August 2003: Proceedings
- Enright AJ, Van Dongen S, Ouzounis CA (2002) An efficient algorithm for large-scale detection of protein families. Nucleic Acids Res 30: 1575–1584 [DOI] [PMC free article] [PubMed] [Google Scholar]
- Ferre S, King RD (2006) Finding motifs in protein secondary structure for use in function prediction. J Comput Biol 13: 719–731 [DOI] [PubMed] [Google Scholar]
- Gaillard H, Wellinger RE, Aguilera A (2007) A new connection of mRNP biogenesis and export with transcription-coupled repair. Nucleic Acids Res 35: 3893–3906 [DOI] [PMC free article] [PubMed] [Google Scholar]
- Garcia-Rubio M, Chavez S, Huertas P, Tous C, Jimeno S, Luna R, Aguilera A (2008) Different physiological relevance of yeast THO/TREX subunits in gene expression and genome integrity. Mol Genet Genomics 279: 123–132 [DOI] [PubMed] [Google Scholar]
- Gordon DM, Roof DM (2001) Degradation of the kinesin Kip1p at anaphase onset is mediated by the anaphase-promoting complex and Cdc20p. Proc Natl Acad Sci USA 98: 12515–12520 [DOI] [PMC free article] [PubMed] [Google Scholar]
- Hampsey M (1997) A review of phenotypes in Saccharomyces cerevisiae. Yeast 13: 1099–1133 [DOI] [PubMed] [Google Scholar]
- Hartwell LH, Hopfield JJ, Leibler S, Murray AW (1999) From molecular to modular cell biology. Nature 402: C47–C52 [DOI] [PubMed] [Google Scholar]
- He F, Brown AH, Jacobson A (1997) Upf1p, Nmd2p, and Upf3p are interacting components of the yeast nonsense-mediated mRNA decay pathway. Mol Cell Biol 17: 1580–1594 [DOI] [PMC free article] [PubMed] [Google Scholar]
- Hedges LV, Olkin I (1985) Statistical Methods for Meta-Analysis. Orlando: Academic Press [Google Scholar]
- Hurt E, Luo MJ, Rother S, Reed R, Strasser K (2004) Cotranscriptional recruitment of the serine–arginine-rich (SR)-like proteins Gbp2 and Hrb1 to nascent mRNA via the TREX complex. Proc Natl Acad Sci USA 101: 1858–1862 [DOI] [PMC free article] [PubMed] [Google Scholar]
- Ihmels J, Collins SR, Schuldiner M, Krogan NJ, Weissman JS (2007) Backup without redundancy: genetic interactions reveal the cost of duplicate gene loss. Mol Syst Biol 3: 86. [DOI] [PMC free article] [PubMed] [Google Scholar]
- Iouk T, Kerscher O, Scott RJ, Basrai MA, Wozniak RW (2002) The yeast nuclear pore complex functionally interacts with components of the spindle assembly checkpoint. J Cell Biol 159: 807–819 [DOI] [PMC free article] [PubMed] [Google Scholar]
- Jambunathan N, Martinez AW, Robert EC, Agochukwu NB, Ibos ME, Dugas SL, Donze D (2005) Multiple bromodomain genes are involved in restricting the spread of heterochromatic silencing at the Saccharomyces cerevisiae HMR-tRNA boundary. Genetics 171: 913–922 [DOI] [PMC free article] [PubMed] [Google Scholar]
- Keene JD (2007) RNA regulons: coordination of post-transcriptional events. Nat Rev Genet 8: 533–543 [DOI] [PubMed] [Google Scholar]
- Kelley R, Ideker T (2005) Systematic interpretation of genetic interactions using protein networks. Nat Biotechnol 23: 561–566 [DOI] [PMC free article] [PubMed] [Google Scholar]
- Lord PW, Stevens RD, Brass A, Goble CA (2003) Investigating semantic similarity measures across the gene ontology: the relationship between sequence and annotation. Bioinformatics 19: 1275–1283 [DOI] [PubMed] [Google Scholar]
- May KM, Hardwick KG (2006) The spindle checkpoint. J Cell Sci 119: 4139–4142 [DOI] [PubMed] [Google Scholar]
- Orjalo AV, Arnaoutov A, Shen Z, Boyarchuk Y, Zeitlin SG, Fontoura B, Briggs S, Dasso M, Forbes DJ (2006) The Nup107-160 nucleoporin complex is required for correct bipolar spindle assembly. Mol Biol Cell 17: 3806–3818 [DOI] [PMC free article] [PubMed] [Google Scholar]
- Pan X, Ye P, Yuan DS, Wang X, Bader JS, Boeke JD (2006) A DNA integrity network in the yeast Saccharomyces cerevisiae. Cell 124: 1069–1081 [DOI] [PubMed] [Google Scholar]
- Qi Y, Bar-Joseph Z, Klein-Seetharaman J (2006) Evaluation of different biological data and computational classification methods for use in protein interaction prediction. Proteins 63: 490–500 [DOI] [PMC free article] [PubMed] [Google Scholar]
- Regelmann J, Schule T, Josupeit FS, Horak J, Rose M, Entian KD, Thumm M, Wolf DH (2003) Catabolite degradation of fructose-1,6-bisphosphatase in the yeast Saccharomyces cerevisiae: a genome-wide screen identifies eight novel GID genes and indicates the existence of two degradation pathways. Mol Biol Cell 14: 1652–1663 [DOI] [PMC free article] [PubMed] [Google Scholar]
- Ren B, Robert F, Wyrick JJ, Aparicio O, Jennings EG, Simon I, Zeitlinger J, Schreiber J, Hannett N, Kanin E, Volkert TL, Wilson CJ, Bell SP, Young RA (2000) Genome-wide location and function of DNA binding proteins. Science 290: 2306–2309 [DOI] [PubMed] [Google Scholar]
- Schuldiner M, Collins SR, Thompson NJ, Denic V, Bhamidipati A, Punna T, Ihmels J, Andrews B, Boone C, Greenblatt JF, Weissman JS, Krogan NJ (2005) Exploration of the function and organization of the yeast early secretory pathway through an epistatic miniarray profile. Cell 123: 507–519 [DOI] [PubMed] [Google Scholar]
- Scott RJ, Lusk CP, Dilworth DJ, Aitchison JD, Wozniak RW (2005) Interactions between Mad1p and the nuclear transport machinery in the yeast Saccharomyces cerevisiae. Mol Biol Cell 16: 4362–4374 [DOI] [PMC free article] [PubMed] [Google Scholar]
- Segre D, Deluna A, Church GM, Kishony R (2005) Modular epistasis in yeast metabolism. Nat Genet 37: 77–83 [DOI] [PubMed] [Google Scholar]
- Shamir R, Maron-Katz A, Tanay A, Linhart C, Steinfeld I, Sharan R, Shiloh Y, Elkon R (2005) EXPANDER––an integrative program suite for microarray data analysis. BMC Bioinformatics 6: 232. [DOI] [PMC free article] [PubMed] [Google Scholar]
- Shannon P, Markiel A, Ozier O, Baliga NS, Wang JT, Ramage D, Amin N, Schwikowski B, Ideker T (2003) Cytoscape: a software environment for integrated models of biomolecular interaction networks. Genome Res 13: 2498–2504 [DOI] [PMC free article] [PubMed] [Google Scholar]
- Sharan R, Shamir R (2000) CLICK: a clustering algorithm with applications to gene expression analysis. Proc Int Conf Intell Syst Mol Biol 8: 307–316 [PubMed] [Google Scholar]
- Somesh BP, Reid J, Liu WF, Sogaard TM, Erdjument-Bromage H, Tempst P, Svejstrup JQ (2005) Multiple mechanisms confining RNA polymerase II ubiquitylation to polymerases undergoing transcriptional arrest. Cell 121: 913–923 [DOI] [PubMed] [Google Scholar]
- St Onge RP, Mani R, Oh J, Proctor M, Fung E, Davis RW, Nislow C, Roth FP, Giaever G (2007) Systematic pathway analysis using high-resolution fitness profiling of combinatorial gene deletions. Nat Genet 39: 199–206 [DOI] [PMC free article] [PubMed] [Google Scholar]
- Stark C, Breitkreutz BJ, Reguly T, Boucher L, Breitkreutz A, Tyers M (2006) BioGRID: a general repository for interaction datasets. Nucleic Acids Res 34: D535–D539 [DOI] [PMC free article] [PubMed] [Google Scholar]
- Suthram S, Shlomi T, Ruppin E, Sharan R, Ideker T (2006) A direct comparison of protein interaction confidence assignment schemes. BMC Bioinformatics 7: 360. [DOI] [PMC free article] [PubMed] [Google Scholar]
- Tong AH, Lesage G, Bader GD, Ding H, Xu H, Xin X, Young J, Berriz GF, Brost RL, Chang M, Chen Y, Cheng X, Chua G, Friesen H, Goldberg DS, Haynes J, Humphries C, He G, Hussein S, Ke L et al. (2004) Global mapping of the yeast genetic interaction network. Science 303: 808–813 [DOI] [PubMed] [Google Scholar]
- Tucker CL, Fields S (2003) Lethal combinations. Nat Genet 35: 204–205 [DOI] [PubMed] [Google Scholar]
- Ulitsky I, Shamir R (2007a) Identification of functional modules using network topology and high-throughput data. BMC Syst Biol 1: 8. [DOI] [PMC free article] [PubMed] [Google Scholar]
- Ulitsky I, Shamir R (2007b) Pathway redundancy and protein essentiality revealed in the Saccharomyces cerevisiae interaction networks. Mol Syst Biol 3: 104. [DOI] [PMC free article] [PubMed] [Google Scholar]
- van Hoof A, Lennertz P, Parker R (2000) Yeast exosome mutants accumulate 3′-extended polyadenylated forms of U4 small nuclear RNA and small nucleolar RNAs. Mol Cell Biol 20: 441–452 [DOI] [PMC free article] [PubMed] [Google Scholar]
- Van Rijsbergen CJ (1979) Information Retrieval. Newton, MA, USA: Butterworth-Heinemann [Google Scholar]
- Zhang LV, King OD, Wong SL, Goldberg DS, Tong AH, Lesage G, Andrews B, Bussey H, Boone C, Roth FP (2005) Motifs, themes and thematic maps of an integrated Saccharomyces cerevisiae interaction network. J Biol 4: 6. [DOI] [PMC free article] [PubMed] [Google Scholar]
- Zhang Y (2003) Transcriptional regulation by histone ubiquitination and deubiquitination. Genes Dev 17: 2733–2740 [DOI] [PubMed] [Google Scholar]
Associated Data
This section collects any data citations, data availability statements, or supplementary materials included in this article.
Supplementary Materials
Supplementary File 1
Supplementary File 2
Supplementary File 3
Supplementary Information