

Abstract
Genetic diversity and differentiation within and among nine G. morsitans morsitans populations from East and southern Africa was assessed by examining variation at seven microsatellite loci and a mitochondrial locus, cytochrome oxidase (COI). Mean COI diversity within populations was 0.63 ± 0.33 and 0.81 taken over all populations. Diversities averaged over microsatellite loci were high (mean number of alleles/locus ≥7.4; mean HE ≥ 65%) in all populations. Diversities averaged across populations were greater in East Africa (mean number of alleles = 22 ± 2.6; mean he = 0.773 ± 0.033) than in southern Africa (mean number of alleles = 18.7 ± 4.0; mean he = 0.713 ± 0.072). Differentiation among all populations was highly significant (RST = 0.25, FST = 0.132). Nei’s Gij statistics were 0.09 and 0.19 within regions for microsatellites and mitochondria, respectively; between regions, Gij was 0.14 for microsatellites and 0.23 for mitochondria. GST among populations was 0.23 for microsatellite loci and 0.40 for mitochondria. The F, G and R statistics indicate highly restricted gene flow among G. m. morsitans populations separated over geographic scales of 12–917 km.
Keywords: Glossina morsitans, Genetic diversity, Genetic differentiation, Gene flow, Microsatellites
Introduction
Tsetse flies constitute a small, highly specialized taxon of exclusively blood-feeding flies (Diptera: Glossinidae). They reproduce slowly, first producing a single mature larva at about 16 or 17 days of age, and thereafter at 9- or 10-day intervals, given adequate blood meals. A number of tsetse species are important vectors of pathogenic trypanosomes (Trypanosoma spp.) that cause sleeping sickness in humans and a lethal wasting disease, nagana, in domestic animals. There are 33 species and sub-species of tsetse flies (Gooding and Krafsur 2005) distributed discontinuously throughout much of sub-Saharan Africa (Leak 1999; Rogers and Robinson 2004).
Glossina morsitans sensu lato inhabits wooded savannah regions (Buxton 1955; Ford and Katondo 1977) where its distribution is determined mostly by mammalian host distribution and climate (Robinson et al. 1997a, b, Rogers 1998). There are three allopatric sub-species within the Glossina morsitans complex, G. m. centralis, G. m. morsitans, and G. m. submorsitans. These taxa are reproductively isolated genetically (Gooding and Krafsur 2005). Here we consider G. morsitans morsitans Westwood, an important vector for human and animal trypanosomiasis whose range includes central Mozambique, much of Tanzania and eastern Zambia (Jordan 1993). The most recent map indicates four allopatric belts (Fig. 1, Rogers and Robinson 2004). Populations are discontinuously distributed within these broad belts.
Fig. 1.

Historical distribution of Glossina morsitans morsitans (hatched) and expected distribution (grey) based on environment similarities of the two areas
Allopatric populations can become genetically differentiated by drift at neutral loci when gene flow among them is restricted. A laboratory culture of G. m. morsitans originating from Zimbabwe exhibited higher fecundity and longevity than a culture from Tanzania (Jordan et al. 1977). Single lab cultures, however, may not provide representative samples of geographically diverse populations and offer no replication. Populations with differing biological characteristics may be expected to vary genetically, but attempts by replicate sampling to investigate genetic variability among natural populations of G. m. morsitans were not made until recently. Krafsur and Griffiths (1997) surveyed 45 allozyme loci and found that 20% were polymorphic in G. m. morsitans. Mean expected heterozygosity was only 0.06, a consequence of comparatively small effective population size. Further research using mitochondrial DNA (mtDNA, Wohlford et al. 1999) and microsatellites (Krafsur and Endsley 2002) provided empirical evidence of significant differentiation among five G. m. morsitans populations from southern Africa. Wright’s (1978) fixation index (FST) averaged across four mtDNA and five microsatellite loci were 0.088 and 0.180, respectively. These differentiation levels were surprising given the well-known vagility of morsitans group flies (Vale et al. 1984; Williams et al. 1992).
The foregoing results were obtained from sampling only two of the four allopatric belts of G. m. morsitans. Further sampling was suggested to gain a better understanding of the breeding structure of G. m. morsitans across its range (Wohlford et al. 1999). Here we extended sampling to Tanzania to incorporate flies in the northern belt. We also examined southern Africa samples to determine levels of genetic diversity within and between East and southern Africa. Historical records indicate the occurrence of a severe rinderpest epizootic in southern Africa in the late 1890s, virtually wiping out the mammalian hosts on which tsetse feed (Ford 1971). The magnitude of the rinderpest may not have been quite as severe in East Africa. Objectives of the current research were to: (1) compare gene diversities at microsatellite loci among and within East Africa and southern Africa G. m. morsitans populations, and (2) determine levels of differentiation and gene flow between and within regions.
Materials and methods
Study areas and tsetse sampling
Samples were arranged in two groups. The southern Africa samples included Kakumbi (13°00′ S, 31°54′ E) in Zambia, Changara (16°19′ S, 33°08′ E) in Mozambique, and Mana Angwa (16°00′ S, 30°13′ E), Mana Pools (15°49′ S, 29°21′ E), and Rekomitjie (16°04′ S, 29°21′ E) in Zimbabwe. Most sampling in southern Africa was carried out in 1995–1996. More detailed descriptions of these locations were reported by Wohlford et al. (1999). The East Africa samples, obtained in 2004, included Kazilaumbwa (05°06′ S, 31°39′ E), Kilimamzinga (05°45′ S, 37°53′ E), Lumbe (05°53′ S, 31°46′ E), and Usinga (05°60′ S, 31°37′ E) in Tanzania. G. m. morsitans were collected by using Epsilon F3 cloth traps or by using biconical traps (Challier and Laveissière 1973).
DNA extraction, amplification and microsatellite genotyping
Genomic DNA was extracted from whole bodies of 208 flies by using CTAB as described by Shahjahan et al. (1995) or by using QIAGEN DNeasy extraction kits (Qiagen Inc., Valencia, CA, USA). DNA pellets were re-suspended in 200 μl of sterile double distilled water. Seven polymorphic microsatellite loci (Gms-CAG2, GpCAG133, Gmm5, Gmm8, Gmm9B, GpB20b, and GmsCAG29B) were amplified by the polymerase chain reaction (PCR). PCR primer sequences and conditions were as earlier described (Baker and Krafsur 2001; Krafsur and Endsley 2002). The forward primers were end labelled with fluorescent dyes (FAM-6 or HEX) to allow multiplexing. PCR products were visualized on an ABI 3100 Genetic Analyzer (Applied Biosystems, Foster City, CA) and allele sizes scored against an internal GeneScan-500 (Rox) size standard. Individual flies were genotyped by using GeneScan® 3.1 and Genotyper® 2.5 software programs (Applied Biosystems).
Mitochondrial COI amplification and sequencing
A fragment of 440 bp of the cytochrome oxidase I mitochondrial gene was amplified in 50 ul PCRs consisting of 45 ul of the 1.1× ReddyMix PCR Master Mix (ABgene, Rochester, New York),0.25 μl each of oligonucleotide primers C1-J-1751 [5′-GGA TCA CCT GAT ATA GCA TTC CC-3′] and C1-N-2191 [5′-CCC GGT AAA ATT AAA ATA TAA ACT TC-3′] (Simon et al. 1994), 2.5 ul of water, and 2 ul of DNA extract (ca. 80 ng). Thermocycling was performed in a PTC-100 MJ Research (Woburn MA) programmable thermocycler and consisted of 30 cycles of 93°C for 45 s, 50°C for 1 min, and 72°C for 1 min. DNA sequencing was performed at Iowa State University DNA Sequencing and Synthesis facility on an ABI 3730 automated sequence analyzer. Good amplifications were obtained from seven of the nine sample locations. DNA from Changara and Kakumbi did not give adequate mitochondrial amplifications. Nucleotide sequences were edited and aligned by using BioEdit (Hall 1999). Nucleotide sites with gaps and questionable alignment were excluded from analysis. The sequences are deposited in GenBank under accession numbers DQ779064–779096.
Genetic data analysis
Departures from Hardy–Weinberg and linkage disequilibrium
Tests for deviations from Hardy–Weinberg equilibrium and genotypic linkage disequilibrium were performed by using GENEPOP 3.4 (Raymond and Rousset 1995). Adjustments for multiple significance tests were performed by applying the sequential Bonferroni correction (Rice 1989). Micro-Checker software (Oosterhout et al. 2004) was used to identify genotyping errors and estimate null allele frequencies.
Mitochondrial sampling distribution
The haplotype distribution was tested for conformity with the Wright–Fisher infinite allele model according to Ewen’s (1972) sampling formula. Theta was estimated by using DnaSP 4 software (Rozas et al. 2003).
Diversities
Estimates of mean number of alleles per locus, observed (HO) and expected (HE) heterozygosities were calculated using FSTAT version 2.9.3 (Goudet 2001). Hierarchical analysis of diversity was performed according to Nei (1987) using SAS (SAS 2001). Total diversity HT, was partitioned into diversity within populations HS, diversity among populations within regions DPR, and diversity between regions DRT according to the relation HT = HS + DPR + DRT (regions: East Africa and southern Africa). The corresponding differentiation among populations within regions was estimated by GPR = DPR/HT, and between regions by GRT = DRT/HT. Tests for recent bottlenecks were performed using ‘Bottleneck’ software (Cornuet and Luikart 1996; Piry et al. 1999). In a recently bottlenecked population observed heterozygosity is greater than the expected equilibrium heterozygosity. The two-phase mutation model was used for 70, 80, and 95% SMM, 15% variance, and 1,200 iterations for estimating expected equilibrium heterozygosity. The Wilcoxon sign-rank test (Luikart et al. 1998) was used to test for multilocus heterozygote excess.
Differentiation, gene flow and population structure
Differentiation within and among populations was estimated by calculating F-statistics according to Weir and Cockerham (1984) using GENEPOP ver. 3.4 (Raymond and Rousset 1995) and FSTAT (Goudet 2001). FIS measures the mean departure from random mating within populations. Li and Horvitz (1953) chi-square test was used to determine if FIS differed significantly from zero where χ2 = F2N(k − 1), d.f. = k(k − 1)/2, and k is the number of alleles and N is sample size. The significance of single locus FST values was tested by using the Chi-square test of Workman and Niswander (1970). To test the hypothesis that FST = 0, χ2 = 2NFST(k − 1), with (k − 1)(s − 1) degrees of freedom, where s is the number of populations. Assuming the island model of population structure (Wright 1969) and equilibrium between migration and drift, the numbers of migrants per population per generation (Nm) were estimated according to the equation Nm = (1 − FST)/4FST or (1 − GST)/4GST for nuclear markers, with denominator 2GST for mitochondrial loci. Gene flow was also estimated from the spatial distribution of private alleles (i.e. alleles found in only one population, singletons ignored) as described by Barton and Slatkin (1986) using GENEPOP (Raymond and Rousset 1995). GENEPOP was also used to estimate RST, a measure of microsatellite variation based on variance in allele size. RST is appropriate for the stepwise mutation model and is analogous to FST and GST (Slatkin 1995).
Breeding structure was examined by hierarchical analysis of molecular variance (AMOVA; Excoffier et al. 1992) as implemented in ARLEQUIN version 2.0 (Schneider et al. 2000). Variation was assessed at three levels: (a) among populations; (b) between regions; and (c) populations grouped post hoc according to a chi-square distance map. Correspondence analysis (Greenacre 1993) was performed to examine genetic diversity from the allele and haplotype frequency distributions. Frequency distributions were defined by contingency tables with samples as columns and alleles or haplotypes as rows. The marginal totals described the frequency distributions. Variance was estimated as (χ2/n) = Σ((nij − ni+n+j)/n)2 · (ni+n+j/n)−1, where nij is the observed count for the ith row in the jth column; ni+ and n+j are the ith row and jth column totals, and n is the grand total. It can be interpreted as a measure of discrepancy between rows and columns in a contingency table. Chi-square distance maps were constructed by transforming the first two principle components, explaining 43% nuclear and 53% mitochondrial variance, to Chi-square distance. This approach does not require an a priori hierarchical scheme but groups samples based on the frequency distribution of variants. The hierarchical partition adopted was supported by significant differences in allele frequency between the two regions, revealed by an exact likelihood ratio chi-square test (χ2[6] = 14.27, P = 0.027) and portrayed by the location of samples on the distance map.
Testing for isolation by distance
Isolation by distance, a correlation between genetic and geographical distance was tested by regressing pairwise GST/(1 − GST) against the geographical distance between population pairs according to Smouse et al. (1986). Approximate geographical distances ranged from 12 km (Lumbe versus Usinga) to 917 km (Kilimazinga versus Rekomitjie). The significance of the regression line was determined by the Mantel test with Monte Carlo matrix re-sampling using SAS (Smouse et al. 1986).
Results
Hardy–Weinberg equilibrium and linkage disequilibrium
Eighteen of 126 tests of within-sample HWE were statistically significant after Bonferroni correction. Because all samples showed one or two bands at each locus, all significant values were attributed to null alleles at Gmm9B according to criteria set forth by Oosterhout et al. (2004). Significant linkage disequilibrium was detected in less than 5% of the tests. All scored loci were autosomal (Baker and Krafsur 2001; Ouma et al. 2003).
Allelic distribution
Two hundred alleles were recorded at seven microsatellite loci among 208 flies. Of the 200 alleles, 166 (83%) were detected in frequencies of less than 5% and, therefore, may be considered rare (Fig. 2). Only six alleles were shared among all populations. There were 154 alleles in the East African tsetse sample, and 131 in the southern African tsetse sample (χ2 = 2.64, P ~ 0.10). Of 200 alleles, 32 private (16%) and 44 singular (22%) alleles were recorded (singular alleles were not scored as private). Twenty-three of the 32 private alleles were restricted to East Africa (72%) and only 9 were detected in southern Africa (χ2 = 6.6, P ~ 0.01). Similarly, the proportion of singletons was greater in East Africa (29 of 44 = 66%) than in southern Africa (15 of 44; χ2 = 4.45, P ~ 0.03). These data are consistent with the occurrence of population bottlenecks in southern Africa. Tests for recent bottlenecks, however, did not indicate disequilibrium between allele numbers and heterozygosities according to criteria established by Cornuet and Luikart (1996). Probabilities among populations varied from 0.41 to 0.99 in one-tail Wilcoxon tests for heterozygosity excess.
Fig. 2.
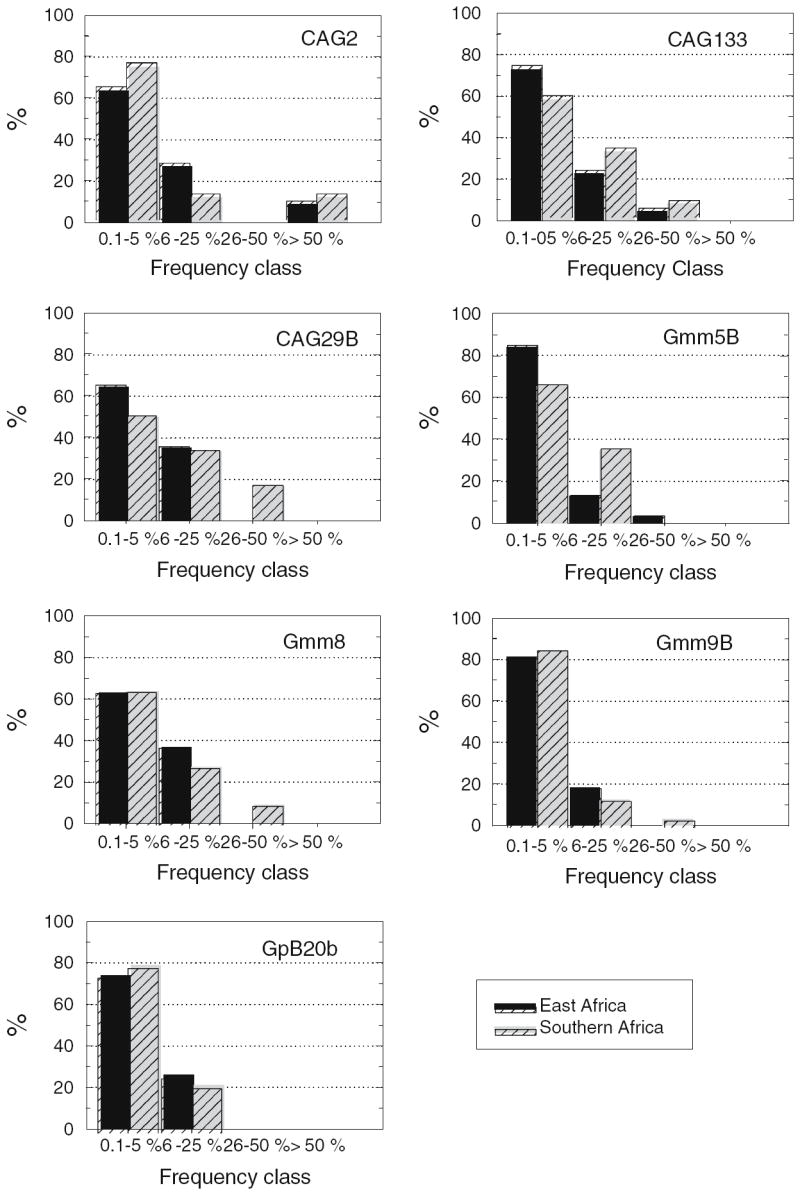
Microsatellite allele frequency class distribution in G. morsitans morsitans
Haplotype distribution
Thirty-three COI haplotypes were observed among 96 flies sampled from seven populations. One haplotype was shared by six samples, accounting for 42% of all flies. Five haplotypes were private (15%) and 24 haplotypes were singular (73%), with the East African samples showing most of the private (60%) and singular (79%) haplotypes. Similar proportions of private variants were found among microsatellite loci. The haplotype distribution did not differ from that expected under the Wright–Fisher infinite allele model when tested by Ewen’s (1972) sampling formula, given an estimate of θ = 2Nμ = 6.93 (Rozas et al. 2003). The parameter θ is the mutation rate scaled to the effective population number, estimated from the average number of variable sites. We then have probability Pθ (k ≤ 33| θ = 6.93, N = 96) = 0.999, the probability of retrieving k ≤ 33 haplotypes in the observed frequencies in a sample of 96 genes.
Genetic diversities
Mitochondrial diversities in populations varied from zero to 0.93 and varied significantly (tα/2, 6 = 5.01, P = 0.002); the mean population diversity = 0.63 ± 0.33. Mitochondrial diversity pooled over populations HS = 0.81, meaning that the odds of two randomly chosen flies having the same COI haplotype were 19%. Observed and expected microsatellite diversities in populations are set forth in Table 1. Average numbers of alleles ranged from 7.4 in Changara to 12.1 in Lumbe. Changara also showed the least heterozygosity. Departures from random matings within populations FIS are shown averaged over 7 and 5 loci, and indicate that Gmm5b and Gmm9B, loci with very high null allele frequencies, contributed 42% of the overall departure. The overall mean FIS for nine loci = 0.17 and for five loci, FIS = 0.10.
Table 1.
Microsatellite diversities in G. m. morsitans populations from East and southern Africa
| Population | N | Mean alleles per locus ± SD | Average heterozygosity
|
FbIS | FcIS | |
|---|---|---|---|---|---|---|
| Observed ± SD | Expected ± SDa | |||||
| East Africa | ||||||
| Kazilaumbwa | 24 | 9.3 ± 2.8 | 0.754 ± 0.034 | 0.801 ± 0.036 | 0.059 | 0.038 |
| Kilimamzinga | 24 | 8.7 ± 5.0 | 0.509 ± 0.040 | 0.652 ± 0.072 | 0.219 | 0.053 |
| Lumbe | 24 | 12.1 ± 3.9 | 0.764 ± 0.034 | 0.829 ± 0.053 | 0.078 | 0.027 |
| Usinga | 24 | 10.0 ± 3.6 | 0.697 ± 0.036 | 0.801 ± 0.032 | 0.13 | 0.136 |
| Southern Africa | ||||||
| Changara | 24 | 7.4 ± 3.2 | 0.494 ± 0.039 | 0.639 ± 0.105 | 0.227 | 0.165 |
| Kakumbi | 16 | 7.4 ± 3.4 | 0.565 ± 0.048 | 0.730 ± 0.068 | 0.226 | 0.001 |
| Mana Angwa | 24 | 8.9 ± 4.6 | 0.554 ± 0.039 | 0.674 ± 0.073 | 0.178 | 0.133 |
| Mana Pools | 24 | 10.3 ± 5.6 | 0.495 ± 0.039 | 0.730 ± 0.077 | 0.322 | 0.27 |
| Rekomitjie | 24 | 9.7 ± 5.4 | 0.655 ± 0.037 | 0.770 ± 0.062 | 0.149 | 0.086 |
Microsatellite diversities by locus are seen in Table 2. Diversities were greater in East than in southern Africa. Average numbers of alleles were 22 ± 2.6 and 18.7 ± 4.0 in East and southern Africa, respectively. HE was 0.773 ± 0.033 in East Africa, and 0.713 ± 0.072 in southern Africa (Table 3). These values, however, were not significantly different (P ≥ 0.24, Wilcoxon test). The most diverse loci were Gmm5B, Gmm9B, and GpB20b and the least diverse was CAG2, a trinucleotide repeat.
Table 2.
Single locus microsatellite diversities averaged over populations
| Locus | No. Haploid genomes scored | East Africa
|
Southern Africa
|
Combined data
|
|||
|---|---|---|---|---|---|---|---|
| No. alleles | he | No. alleles | he | No. alleles | he | ||
| CAG2 | 410 | 11 | 0.615 | 8 | 0.328 | 12 | 0.456 |
| CAG133 | 410 | 22 | 0.792 | 12 | 0.723 | 24 | 0.754 |
| Gmm5B | 404 | 31 | 0.842 | 23 | 0.848 | 37 | 0.845 |
| Gmm8 | 414 | 19 | 0.792 | 11 | 0.653 | 24 | 0.715 |
| Gmm9B | 372 | 27 | 0.848 | 32 | 0.856 | 44 | 0.852 |
| GpB20b | 406 | 27 | 0.829 | 33 | 0.879 | 40 | 0.857 |
| CAG29B | 414 | 17 | 0.691 | 12 | 0.702 | 19 | 0.697 |
| Mean | 404.29 | 22 | 0.773 | 18.7 | 0.713 | 28.6 | 0.739 |
| SE | 5.56 | 2.6 | 0.033 | 4.0 | 0.072 | 4.5 | 0.054 |
Table 3.
Hierarchical partition of diversities by methods of Nei (1987)
| Index | Microsatellites (9 populations)
|
Mitochondria (7 populations)
|
||
|---|---|---|---|---|
| Estimate | SE | Estimate | SE | |
| Diversity | ||||
| Within populations HS | 0.736 | 0.044 | 0.624 | 0.013 |
| Among populations within regionsa DSR | 0.091 | 0.006 | 0.192 | 0.098 |
| Between regions DRT | 0.137 | 0.010 | 0.227 | 0.027 |
| Total HT | 0.964 | 0.229 | 1.043 | 0.225 |
| Differentiation | ||||
| Among populations within regions GSR | 0.094 | 0.006 | 0.184 | 0.010 |
| Between regions GRT | 0.142 | 0.008 | 0.217 | 0.038 |
| Among populations GST | 0.233 | 0.045 | 0.402 | 0.080 |
| Gene flow Nm | ||||
| Among populations within regions | 2.41 | 2.2 | ||
| Between regions | 1.51 | 1.8 | ||
| Among populations | 0.82 | 0.75 | ||
Regions: East Africa and southern Africa
Hierarchical partition of microsatellite diversity is set forth in Table 3. Most of the diversity lay within populations (HS = 0.736 ± 0.044). Unshared microsatellite diversities between regions (DRT) and among populations within regions (DPR) were ~0.14 and 0.09, respectively. The coefficient of differentiation between regions (GRT = 0.142) was greater than that among populations within regions (GSR = 0.094) by a factor of ~ 1.5.
Mitochondrial diversities differed significantly among the seven populations when based on a t test (tα/2, 6 = 5.01, P = 0.002). COI diversities were 0.72 in East Africa and 0.50 in southern Africa but the difference was not significant (F = 0.71, P ≈ 0.44, ANOVA). Most (60%) COI diversity lay within samples and similar degrees of differentiation were found within and between regions, GSR = 0.18, GRT = 0.22, respectively and differentiation over all populations, GST = 0.40 (Table 3).
Genetic differentiation and gene flow within populations
Averaged over loci, random mating within populations was observed in both regions and overall (FIS = 0.17 ± 0.07, P > 0.05). Significant FIS estimates indicated substantial single locus heterozygote deficiencies, however, at Gmm9B and Gmm5B. These deficiencies were attributed to null alleles following the criteria of Oosterhout et al. (2004). Recompilation of summary statistics without Gmm9B and Gmm5B showed that FIS estimates became greatly reduced as already discussed.
Genetic differentiation and gene flow among populations
Significant departures from random mating among populations were detected in East (FST = 0.132, P < 0.001) and southern Africa (FST = 0.104, P < 0.001). When populations were pooled over regions, mean FST = 0.129 ± 0.014. These estimates are biased downward by high frequencies of private and singular alleles.
Pairwise estimates of differentiation at COI varied from 0.06 (Mana Angwa versus Lumbe to 0.62 (Rekomitjie versus Mana pools, Table 4). Four of 21 pairwise comparisons indicated no shared haplotypes and only Kilimamzinga and Mana Angwa shared two haplotypes. The remaining 16 pairwise comparisons were of one shared haplotype (Table 4).
Table 4.
Genetic differentiation (GST, upper diagonal), number of haplotypes (bold font), and number of shared mitochondrial haplotypes (lower diagonal) among G. m. morsitans in East and southern Africa
| Sample | Kazilaumbwa | Kilimamzinga | Lumbe | Usinga | Mana Angwa | Mana Pools | Rekomitjie |
|---|---|---|---|---|---|---|---|
| Kazilaumbwa | 4 | 0.35 | 0.14 | 0.33 | 0.11 | 0.45 | 0.12 |
| Kilimamzinga | 1 | 8 | 0.15 | 0.19 | 0.18 | 0.18 | 0.51 |
| Lumbe | 1 | 1 | 10 | 0.15 | 0.06 | 0.23 | 0.30 |
| Usinga | 1 | 1 | 1 | 6 | 0.19 | 0.26 | 0.50 |
| Mana Angwa | 1 | 2 | 1 | 1 | 6 | 0.28 | 0.27 |
| Mana Pools | 0 | 1 | 0 | 0 | 1 | 6 | 0.62 |
| Rekomitjie | 1 | 1 | 1 | 1 | 1 | 0 | 1 |
Pairwise FST varied from 0.027 to 0.207 among East Africa G. m. morsitans populations, and from 0.031 to 0.161 among southern Africa populations. Overall, pairwise genetic differences were high with the exceptions of Kazilaumbwa versus Lumbe (FST ~ 0.03) and Kakumbi versus Mana Angwa (FST = 0.03, Table 5).
Table 5.
Pairwise genetic distances at microsatellite loci in terms of FST (lower diagonal) and gene flow (Nm, upper diagonal) among populations of G. m. morsitans
| East Africa
|
Southern Africa
|
||||||||
|---|---|---|---|---|---|---|---|---|---|
| Lumbe | Kilimamzinga | Usinga | Kazilaumbwa | Rekomitjie | Mana Pools | Mana Angwa | Changara | Kakumbi | |
| Lumbe | 1.2 | 2.4 | 9.0 | 2.6 | 2.5 | 1.5 | 1.3 | 1.9 | |
| Kilimamzinga | 0.173 | 1.1 | 1.0 | 1.1 | 1.3 | 3.0 | 1.8 | 2.6 | |
| Usinga | 0.095 | 0.186 | 2.4 | 1.7 | 1.4 | 1.5 | 1.1 | 1.8 | |
| Kazilaumbwa | 0.027 | 0.207 | 0.094 | 2.3 | 1.8 | 1.2 | 1.0 | 1.4 | |
| Rekomitjie | 0.089 | 0.179 | 0.128 | 0.097 | 2.8 | 1.8 | 1.3 | 2.0 | |
| Mana Pools | 0.092 | 0.165 | 0.151 | 0.124 | 0.083 | 2.0 | 1.6 | 2.1 | |
| Mana Angwa | 0.141 | 0.076 | 0.139 | 0.173 | 0.120 | 0.109 | 3.4 | 7.8 | |
| Changara | 0.162 | 0.124 | 0.180 | 0.208 | 0.161 | 0.135 | 0.069 | 4.0 | |
| Kakumbi | 0.116 | 0.088 | 0.122 | 0.149 | 0.112 | 0.105 | 0.031 | 0.059 | |
Analysis of variance in allele sizes over populations afforded a weighted estimate of RST = 0.25. This estimate is analogous to FST and GST and leads to an estimate of gene flow Nm of a mean 0.75 reproducing flies exchanged among populations per generation, according to the island model of migration. Assuming the infinite allele mutation model, genetic differentiation was greater among East Africa (FST ~ 0.13) than among southern Africa populations (FST ~ 0.1) indicating that the mean rate of gene flow was greater among southern African (Nm ~ 2.2) than among East African (Nm = 1.7) populations. Conversely, estimates of Nm based on private alleles by the method of Barton and Slatkin (1986) were 1.5 among southern and 2.3 among East African populations. The mean frequency of private alleles over all populations was 0.051 and the corresponding estimate of gene flow was 2.3 reproductive flies per generation.
Population structure
To examine further the degree of population structure, a hierarchical analysis of F-statistics was carried out by using a nested AMOVA (Table 6). Most of the variation (≥85%) lay within populations. Only ~2% of the total variance was attributed to differences between East and southern Africa. But populations placed by chi-square distance into three groups (Fig. 3) accounted for 8% of the total variance. Nearly equal proportions of variance were attributed to differences among the three groups, and to populations within groups (Table 6).
Table 6.
Analysis of molecular variance in microsatellite loci (Excoffier et al. 1992) within and among G. m. morsitans populations
| Sources of variation | Degrees of freedom | Variance component | % variation | FXY | P |
|---|---|---|---|---|---|
| Nine populations | |||||
| Among populations | 8 | 0.3677 | 13.2 | FST = 0.132 | < 0.0001 |
| Within populations | 407 | 2.4232 | 86.8 | ||
| East versus southern Africa | |||||
| Between regions | 1 | 0.0609 | 2.2 | FRT = 0.022 | ~0.088 |
| Among populations within regions | 7 | 0.3336 | 11.8 | FSR = 0.121 | < 0.0001 |
| Within populations | 407 | 2.4232 | 86.0 | FST = 0.140 | < 0.0001 |
| Groups according to chi-square distance (Fig. 2)a | |||||
| Among groups | 2 | 0.2242 | 8.0 | FGT = 0.079 | < 0.0001 |
| Among populations within groups | 6 | 0.2041 | 7.0 | FSG = 0.078 | < 0.0001 |
| Within populations | 407 | 2.4232 | 85.0 | FST = 0.150 | < 0.0001 |
Lumbe, Usinga, and Kazilaumbwa versus Rekomitjie and Mana Pools versus Changara, Kakumbi, Kilimazinga, Mana Angwa
Fig. 3.
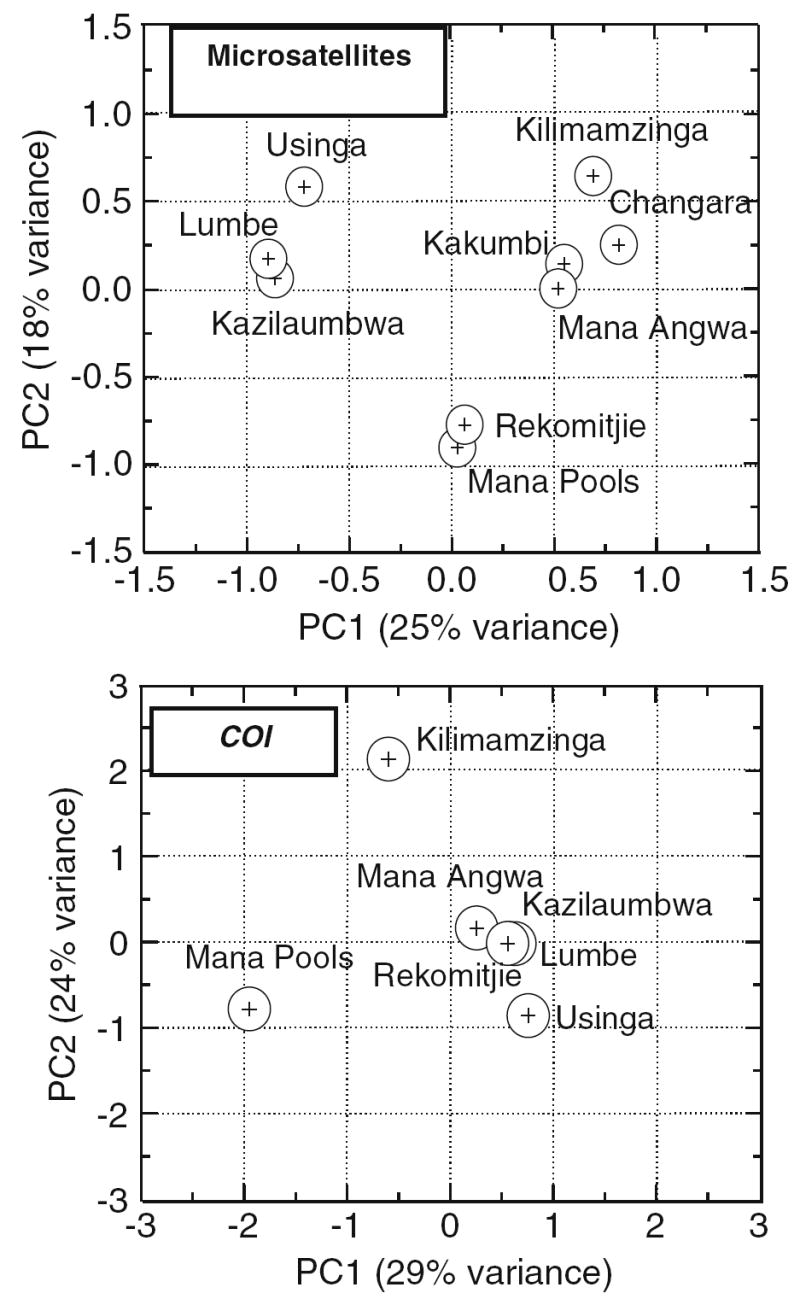
Chi-Square distance map of G. morsitans morsitans from East and Southern Africa
Isolation by distance
Pairwise geographical distances varied by two orders of magnitude (12–917 km) while pairwise estimates of microsatellite genetic distance Gij/(1 − Gij) among populations varied roughly 3-fold, from ~0.04 to 0.15 (Fig. 4). There was a significant correlation between pairwise genetic and geographical distances among all populations (r = 0.41, P = 0.01, Mantel test). This result is consistent with the isolation by distance model although the slope was shallow. No significant correlation was detected, however, between geographic and genetic distance based on COI.
Fig. 4.
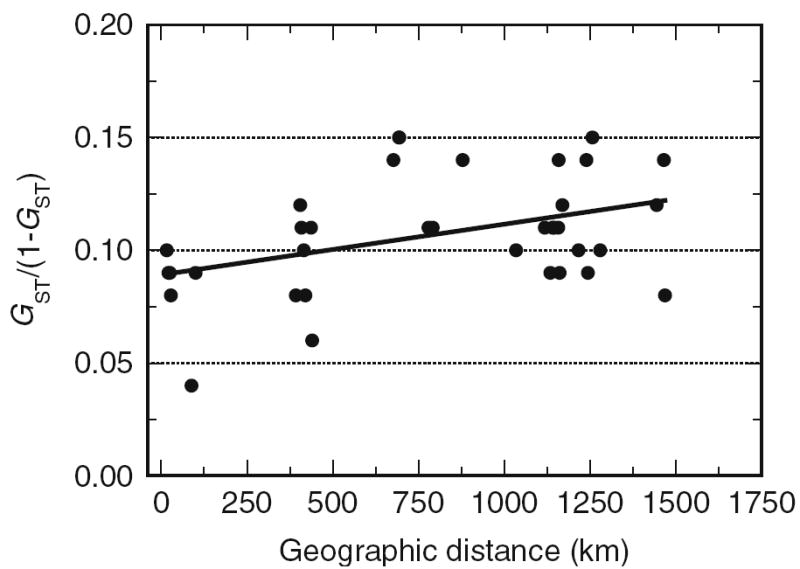
Regression of pairwise genetic differentiation indices Gij/(1 − Gij) at microsatellite loci on geographic distance in kilometres. The Mantel test indicated r = 0.41, P = 0.01
Discussion
Microsatellite allelic diversity was high—200 alleles detected among seven loci, for an overall mean of 28.6 alleles per locus. Only 55 alleles among five loci were recorded in G. m. morsitans by using silver-stained acrylamide gels (Krafsur and Endsley 2002).
Microsatellite markers were used to determine levels of genetic diversity, differentiation, and gene flow within and among populations of G. m. morsitans from East and southern Africa. Five of the seven microsatellite loci used in this study were isolated from G. morsitans s.l. (Baker and Krafsur 2001). CAG133 (Baker and Krafsur 2001) and GpB20b (Ouma et al. 2003) were isolated from G. pallidipes but were useful for unambiguously scoring genotypes in G. m. morsitans.
Highly polymorphic microsatellite loci underestimate genetic differentiation and gene flow particularly when migration rates are low. High frequencies of singletons downwardly bias FST. Nei’s (1987) indices, however, alleviate the foregoing problem because alleles contribute to diversity and differentiation estimates proportionally to their frequencies. High mutation rates violate Hardy–Weinberg assumptions and lead to underestimates of genetic differentiation. Allele size homoplasy is a common problem with microsatellites because the infinite allele mutation model is inappropriate (Estoup et al. 1995). The stepping stone mutation model is biased and inappropriate for our data because there are many single nucleotide polymorphisms and many outlying alleles greatly increase within-locus variance (Balloux and Lugon-Moulin 2002) that can lead to exaggerated RST estimates. Population structuring within populations, as indicated by high FIS estimates, can lead to underestimates of among population differentiation (Balloux and Lugon-Moulin 2002). Finally, commonly used estimates of genetic differentiation are constrained because they cannot exceed the average level of within-population homozygosity (Hedrick 1999, Hedrick 2005) and our microsatellite loci were highly variable. The chief conclusion we adopt in the face of the foregoing, well-recognized problems with microsatellites, is that our estimates of genetic differentiation are highly conservative and estimates of gene flow are correspondingly exaggerated. The consequences in tsetse fly ecology are considerable and are discussed further below.
Allele and haplotype frequency distributions
A larger proportion of private and singular alleles and haplotypes occurred in East than southern Africa. Private alleles occurred in moderate frequencies (≤6.5%) leading to estimates of gene flow consistent with those based on FST and GST. Singletons accounted for 22% of microsatellite genotypes and a seemingly extraordinary 73% of the mitochondrial variants. The mitochondrial sampling distribution, however, did not significantly differ from the expected given an a priori estimate of θ = 2Nμ from analysis of nucleotide sequences.
Diversities
Mean expected heterozygosities exceeded 60% in all populations, not an uncommon finding when evaluating microsatellite loci. Mean number of alleles and expected heterozygosities were greater in East Africa than in southern Africa, consistent with findings in other morsitans group tsetse flies (Krafsur 2003; Gooding and Krafsur 2005). Average diversities at mitochondrial loci in G. pallidipes were 0.55 in Ethiopia and Kenya but only 0.15 in Zimbabwe, when estimated by the SSCP method (Krafsur and Wohlford 1999). In contrast, heterozygosities averaged over 11 allozyme loci in G. pallidipes were slightly greater in southern Africa (HE = 0.212 ± 0.085) than in Kenya (HE = 0.163 ± 0.075) but not significantly so (Krafsur et al. 1997). Further work (Krafsur 2002) suggested that the high allozyme heterozygosities in southern Africa were maintained by balancing selection (Kreitman and Akashi 1995). The lesser microsatellite diversities in southern Africa can be attributed to the rinderpest panzootic of 1889–1896 with additional episodes in the early 20th century (Buxton 1955; Ford 1971). Rinderpest was said to have killed about 90% of the mammalian fauna thereby greatly reducing tsetse fly opportunity to obtain blood meals. A transient bottleneck in morsitans group tsetse flies occurred as a result (reviewed in Buxton 1955; Ford 1971) but statistical tests (Cornuet and Luikart 1996; Piry et al. 1999) for recent bottlenecks in tsetse fly populations were not significant (e.g., G. morsitans centralis, Krafsur et al. 2001). The most likely reason is that sufficient time has elapsed (c. 90–100 years, some 720–800 generations) between the presumptive bottlenecks and genetic sampling to allow re-establishment of mutation-drift equilibrium.
Among the southern Africa samples, Changara was the least diverse. Changara is in the southern belt of G. m. morsitans and additional samples from Mozambique are necessary to determine if its sample was representative of the entire fly belt.
Differentiation and gene flow
Within populations
Gmm9B, CAG2, and Gmm5B deviated significantly from Hardy–Weinberg expectations within populations. The cause of these departures was not inbreeding because all seven selectively neutral loci would be affected in the same manner. FIS averaged across loci, though positive, was not statistically different from zero (FIS ≥ 0.17, P > 0.05; Table 4), consistent with random matings within populations. FIS ~ 0.10 when Gmm5B and Gmm9B were not included. Krafsur and Endsley (2002) also observed random matings in six G. m. morsitans populations from southern Africa where FIS averaged over five microsatellite loci was 0.029. The present FIS estimates were greater but a direct comparison cannot be made because different numbers of loci were analysed and Krafsur and Endsley scored genotypes on silver-stained polyacrylamide gels whereas we used Genescan.
Among populations
Significant differentiation at microsatellite loci was found when all G. m. morsitans populations were considered together (FST ranged from 0.129 to 0.15), and when East and southern Africa populations were grouped separately (FST = 0.104 and 0.132, respectively). As already indicated, these estimates are downwardly biased. Average homozygosity was 0.26 in G. m. morsitans, thus the maximum value that FST and GST can take is 0.26. Estimated values were ~50% of that. Nevertheless, at face value the FSTs indicate restricted gene flow and are comparable with earlier published estimates. For example, average FST among six southern Africa G. m. morsitans was 0.088 at mtDNA loci (Wohlford et al. 1999) and 0.185 across five microsatellite loci (Krafsur and Endsley 2002).
Population structure
Nei’s (1987) methods disclosed highly significant genetic differentiation at microsatellite and mitochondrial loci within and between the East and southern African regions. Within region gene flow amounted to 2.2–2.4 reproductive flies per generation based on microsatellite and mitochondrial variation, respectively. Gene flow between regions was estimated to be 1.5–1.8 flies by the same kinds of variation. Gene flow among all populations was 0.7–0.8 flies. RST indicated a mean rate of gene flow of 0.75 and the private allele method a rate of 2.5 reproductives per generation. Simulations suggest that FST (and, by implication, its multilocus analogue GST) often provide less biased estimates of differentiation than RST (Gaggioti et al. 1999; Balloux and Goudet 2002). RST and GST provided nearly equal estimates of gene flow among the G. m. morsitans populations.
The AMOVA, on the other hand, indicated an insignificant amount of variance attributable to regions (2.2%). This small variance is a direct consequence of singular alleles. A significant result was obtained (FGT = 0.08, P < 0.0001), however, when data were grouped according to their Chi-square distances.
Isolation by distance
Isolation by distance (IBD) describes patterns of genetic variation that derive from spatially limited gene flow (Wright 1969, p. 298). In the simplest case it is assumed that genetic similarity between populations decreases as the geographic distance between them increases. The positive correlation (r = 0.41, P = 0.01) of genetic and geographical distances suggests that geographical distance limits gene flow among G. m. morsitans populations on a north–south transect. Weak IBD was also observed in G. pallidipes (Krafsur and Wohlford 1999), and implies that immigrants are more likely to be exchanged with nearby populations than with those far away. A closer look at Table 5, however, shows that distance is unlikely to be the only factor shaping the breeding structure of G. m. morsitans. For example, Mana Angwa cf. Mana Pools (~59 km apart) and Rekomitjie cf. Kakumbi (~272 km apart) each exchange approximately two flies per generation, given assumptions of the island model.
Concluding remarks
The high differentiation and corresponding low rates of gene flow are ecologically significant because G. morsitans flies are said to have a great capacity for dispersal (Rogers 1977; Vale et al. 1984; Williams et al. 1992; Hargrove 2000). Our estimates of gene flow vary from 0.7 to 1.7 reproductive flies per generation, taken over the nine sampled populations. Moreover, the relationship between genetic geographical distances was weak though statistically significant, suggesting the simple island model of population structure is appropriate for tsetse flies. Clearly the force of genetic drift greatly exceeds the force of migration and is caused by discontinuously distributed populations of small effective size. The results in G. m. morsitans mirror those in other morsitans group taxa (Krafsur 2003). Perhaps dispersed tsetse flies are at a reproductive disadvantage relative to their locally adapted cousins. Indeed, physiological studies have showed significant geographic variation in thermal tolerance and water loss among four populations of the closely related tsetse fly G. pallidipes (Terblanche et al. 2005). Experiments demonstrated, however, that the differing responses to temperature extremes were almost fully compensated by accommodation. Phenotypic plasticity, therefore, explained differing population responses thereby falsifying an hypothesis of genetically based differences in physiology. In any case, it seems that morsitans group tsetse fly populations may not be quite as vagile as ecological studies have suggested and this could have important economic considerations when considering area-wide vector control programmes, which may prove to be more effective than are now anticipated by knowledgeable tsetse fly ecologists.
Acknowledgments
We thank Dra Imna Malele, Dr. John Terblanche, Messrs Godfrey Mashenge, Cassim Omari and Juma Mwita of TTRI for assistance with sampling G. m. morsitans in Tanzania. Dr. Nigel Griffiths did the southern African samplings. Thanks to Prof. David Rogers, TALA Research Group, Zoology department, Oxford, for the distribution map of G. m. morsitans. This research was supported by NIH USPHS Grants AI-40048 and AI-52456 to ESK.
References
- Baker MD, Krafsur ES. Identification and properties of microsatellite markers in tsetse flies Glossina morsitans sensu lato (Diptera: Glossinidae) Mol Ecol Notes. 2001;1:234–236. doi: 10.1046/j.1471-8278.2001.00087.x. [DOI] [PMC free article] [PubMed] [Google Scholar]
- Balloux F, Goudet J. Statistical properties of population differentiation estimators under stepwise mutation in a finite island model. Mol Ecol. 2002;11:771–783. doi: 10.1046/j.1365-294x.2002.01474.x. [DOI] [PubMed] [Google Scholar]
- Balloux F, Lugon-Moulin N. The estimation of population differentiation with microsatellite markers. Mol Ecol. 2002;11:155–165. doi: 10.1046/j.0962-1083.2001.01436.x. [DOI] [PubMed] [Google Scholar]
- Barton NH, Slatkin M. A quasi-equilibrium theory of distribution of rare alleles in a subdivided population. Heredity. 1986;56:409–415. doi: 10.1038/hdy.1986.63. [DOI] [PubMed] [Google Scholar]
- Buxton PA. The natural history of tsetse flies: memoir of the London School of Hygiene and Tropical Medicine no. 10. H K Lewis; London: 1955. [Google Scholar]
- Challier A, Laveissière C. Un nouveau piège pour la capture des glossines (Glossina; Diptera, Muscidae): description et essays sur le terrain. Cah ORSTOM Sér Ent Méd Parasit. 1973;11:251–262. [Google Scholar]
- Cornuet JM, Luikart G. Description and power analysis of two tests for detecting recent population bottlenecks from allele frequency data. Genetics. 1996;144:2001–2014. doi: 10.1093/genetics/144.4.2001. [DOI] [PMC free article] [PubMed] [Google Scholar]
- Estoup A, Garnery L, Solignac M, Cornuet JM. Microsatellite variation in honey bee (Apis mellifera L.) populations: hierarchical genetic structure and test of the infinite allele and stepwise mutation models. Genetics. 1995;140:679–695. doi: 10.1093/genetics/140.2.679. [DOI] [PMC free article] [PubMed] [Google Scholar]
- Ewens WJ. The sampling theory of selectively neutral alleles. Theor Popul Biol. 1972;3:87–112. doi: 10.1016/0040-5809(72)90035-4. [DOI] [PubMed] [Google Scholar]
- Excoffier L, Smouse P, Quattro J. Analysis of molecular variance inferred from metric distances among DNA haplotypes: application to human mitochondrial DNA restriction data. Genetics. 1992;131:479–491. doi: 10.1093/genetics/131.2.479. [DOI] [PMC free article] [PubMed] [Google Scholar]
- Ford J. The role of trypanosomiases in African ecology. Clarendon Press; Oxford: 1971. [Google Scholar]
- Ford J, Katondo KM. The distribution of tsetse flies (Glossina) in Africa (1973) organization of African unity—scientific and technical research commission. Cook, Hammond & Kell; London: 1977. [Google Scholar]
- Gaggioti OE, Lange O, Rassmann K, Gliddon C. A comparison of two indirect methods for estimating average levels of gene flow using microsatellite data. Mol Ecol. 1999;8:1513–1520. doi: 10.1046/j.1365-294x.1999.00730.x. [DOI] [PubMed] [Google Scholar]
- Gooding RH, Krafsur ES. Tsetse genetics: contributions to biology, systematics, and control of tsetse flies. Annu Rev Entomol. 2005;50:101–123. doi: 10.1146/annurev.ento.50.071803.130443. [DOI] [PMC free article] [PubMed] [Google Scholar]
- Goudet J. FSTAT, a program to estimate and test gene diversities and fixation indices (version 2.9.3.2) 2001 available from http://www.unil.ch/izea/softwares/fstat.html.
- Greenacre MJ. Correspondence analysis in practice. Academic Press; London: 1993. [Google Scholar]
- Hall TA. BioEdit: a user-friendly biological sequence alignment editor and analysis program for Windows 95/98/ NT. Nucleic Acids Symp Ser. 1999;41:95–98. [Google Scholar]
- Hargrove JW. A theoretical study of the invasion of cleared areas by tsetse flies (Diptera: Glossinidae) Bull Entomol Res. 2000;90:201–209. doi: 10.1017/s0007485300000328. [DOI] [PubMed] [Google Scholar]
- Hedrick PW. Highly variable loci and their interpretation in evolution and conservation. Evolution. 1999;53:313–318. doi: 10.1111/j.1558-5646.1999.tb03767.x. [DOI] [PubMed] [Google Scholar]
- Hedrick PW. A standardized genetic differentiation measure. Evolution. 2005;59:1633–1638. [PubMed] [Google Scholar]
- Jordan AM. Tsetse flies (Glossinidae) In: Lane RP, Crosskey RW, editors. Medical insects and arachnids. Chapman & Hall; London: 1993. pp. 333–388. [Google Scholar]
- Jordan AM, Trewern MA, Southern DI, Pell PE, Davies EDG. Differences in laboratory performance between strains of Glossina morsitans morsitans Westwood from Rhodesia and Tanzania and associated chromosome diversity. Bull Entomol Res. 1977;67:35–48. [Google Scholar]
- Krafsur ES. Population structure of the tsetse fly Glossina pallidipes estimated by allozyme, microsatellite and mitochondrial gene diversities. Insect Mol Biol. 2002;11:37–45. doi: 10.1046/j.0962-1075.2001.00307.x. [DOI] [PMC free article] [PubMed] [Google Scholar]
- Krafsur ES. Tsetse fly population genetics: an indirect approach to dispersal. Trends Parasitol. 2003;19:162–166. doi: 10.1016/s1471-4922(03)00034-5. [DOI] [PubMed] [Google Scholar]
- Krafsur ES, Endsley MA. Microsatellite diversities and gene flow in the tsetse fly, Glossina morsitans s.l. Med Vet Entomol. 2002;16:292–300. doi: 10.1046/j.1365-2915.2002.00378.x. [DOI] [PMC free article] [PubMed] [Google Scholar]
- Krafsur ES, Griffiths N. Genetic variation at structural loci in the Glossina morsitans species group. Biochem Genet. 1997;35:1–11. doi: 10.1023/a:1022252311715. [DOI] [PubMed] [Google Scholar]
- Krafsur ES, Wohlford DL. Breeding structure of Glossina pallidipes populations evaluated by mitochondrial variation. J Hered. 1999;90:635–642. doi: 10.1093/jhered/90.6.635. [DOI] [PubMed] [Google Scholar]
- Krafsur ES, Endsley MA, Wohlford DL, Griffiths NT, Allsopp R. Genetic differentiation of Glossina morsitans centralis populations. Insect Mol Biol. 2001;10:387–395. doi: 10.1046/j.0962-1075.2001.00277.x. [DOI] [PMC free article] [PubMed] [Google Scholar]
- Krafsur ES, Griffiths N, Brockhouse CL, Brady J. Breeding structure of G. pallidipes in East and southern Africa. Bull Entomol Res. 1997;87:67–73. [Google Scholar]
- Kreitman M, Akashi H. Molecular evidence for natural selection. Annu Rev Ecol Syst. 1995;26:403–422. [Google Scholar]
- Leak SGA. Tsetse biology and ecology: their role in the epidemiology and control of trypanosomosis. CABI Publishing; Wallingford: 1999. p. 568. [Google Scholar]
- Li CC, Horvitz DG. Some methods of estimating the inbreeding coefficient. Am J Hum Genet. 1953;5:107–117. [PMC free article] [PubMed] [Google Scholar]
- Luikart G, Allendorf FW, Cornuet J-M, Sherwin WB. Distortion of allele frequency distributions provides a test for recent population bottlenecks. J Hered. 1998;89:238–247. doi: 10.1093/jhered/89.3.238. [DOI] [PubMed] [Google Scholar]
- Nei M. Molecular evolutionary genetics. Columbia University Press; New York: 1987. [Google Scholar]
- van Oosterhout C, Hutchinson WF, Wills DPM, Shipley P. MICRO-CHECKER: software for identifying and correcting genotyping errors in microsatellite data. Mol Ecol Notes. 2004;4:535–538. [Google Scholar]
- Ouma JO, Cummings MA, Jones KC, Krafsur ES. Characterization of microsatellite markers in the tsetse fly, Glossina pallidipes (Diptera: Glossinidae) Mol Ecol Notes. 2003;3:450–453. doi: 10.1046/j.1471-8286.2003.00480.x. [DOI] [PMC free article] [PubMed] [Google Scholar]
- Piry S, Luikart G, Cornuet J-M. BOTTLENECK: a computer program for detecting recent reductions in the effective population size using allele frequency data. J Hered. 1999;90:502–503. [Google Scholar]
- Rice WR. Analyzing tables of statistical tests. Evolution. 1989;43:223–225. doi: 10.1111/j.1558-5646.1989.tb04220.x. [DOI] [PubMed] [Google Scholar]
- Raymond M, Rousset F. GENEPOP (version 1.2): population genetics software for exact tests and ecumenicism. J Hered. 1995;86:248–249. Software available at http://wbio-med.curtin.edu.au/genepop/
- Robinson TP, Rogers DJ, Williams B. Mapping tsetse habitat suitability in the common fly belt of Southern Africa using multivariate analysis of climate and remotely sensed vegetation data. Med Vet Entomol. 1997a;11:235–245. doi: 10.1111/j.1365-2915.1997.tb00401.x. [DOI] [PubMed] [Google Scholar]
- Robinson TP, Rogers DJ, Williams B. Univariate analysis of tsetse habitat in the common fly belt of Southern Africa using climate and remotely sensed vegetation data. Med Vet Entomol. 1997b;11:223–234. doi: 10.1111/j.1365-2915.1997.tb00400.x. [DOI] [PubMed] [Google Scholar]
- Rogers DJ. Study of a natural population of tsetse flies and a model for fly movements. J Anim Ecol. 1977;46:309–330. [Google Scholar]
- Rogers DJ. Proceedings of the symposium on the diagnosis and control of livestock disease using nuclear and related techniques: towards disease control in the 21st century. Vol. 1997. IAEA; Vienna: 1998. Satellite imagery and the prediction of tsetse distribution in East Africa; pp. 397–420. [Google Scholar]
- Rogers DJ, Robinson TP. Tsetse distribution. In: Maudlin I, Holmes P, Miles M, editors. The trypanosomiases. CAB International; Oxford: 2004. pp. 139–179. [Google Scholar]
- Rozas J, Sanches-DelBarrio JC, Messeguer X, Rozas R. DnaSP, DNA polymorphism analyses by the coalescent and other methods. Bioinformatics. 2003;19:2496–2497. doi: 10.1093/bioinformatics/btg359. [DOI] [PubMed] [Google Scholar]
- SAS. SAS language reference, version 8.2. SAS Institute Inc.; Cary, North Carolina: 2001. [Google Scholar]
- Schneider S, Roessli D, Excoffier L. A software for population genetics data analysis. Genetics and Biometry Laboratory, University of Geneva; 2000. [Google Scholar]
- Shahjahan RM, Hughes KJ, Leopold RA, DeVault JD. Lower incubation temperature increases yield of insect genomic DNA isolated by the CTAB method. BioTechniques. 1995;19:333–334. [PubMed] [Google Scholar]
- Simon C, Fratti F, Beckenbach A, Crespi B, Liu H, Flook P. Evolution, weighting, and phylogenetic utility of mitochondrial gene sequences and a compilation of conserved polymerase chain reaction primers. Ann Entomol Soc Am. 1994;87:651–701. [Google Scholar]
- Slatkin M. A measure of population subdivision based on microsatellite allele frequencies. Genetics. 1995;139:457–462. doi: 10.1093/genetics/139.1.457. [DOI] [PMC free article] [PubMed] [Google Scholar]
- Smouse PE, Long JC, Sokal RR. Multiple regression and correlation extensions of the Mantel tests of matrix correspondence. Syst Zool. 1986;35:627–632. [Google Scholar]
- Terblanche JS, Klok CJ, Krafsur ES, Chown SL. Phenotypic plasticity and geographic variation in thermal tolerance and water loss in the tsetse Glossina pallidipes (Diptera: Glossinidae): implications for distributional modelling. Am J Trop Med Hyg. 2005;74:786–794. [PMC free article] [PubMed] [Google Scholar]
- Vale GA, Harshey BS, Hargrove JW. The use of small plots to study populations of tsetse (Diptera: Glossinidae) Insect Sci Appl. 1984;5:403–410. [Google Scholar]
- Weir BS, Cockerham CC. Estimating F-statistics for the analysis of population structure. Evolution. 1984;38:1358–1370. doi: 10.1111/j.1558-5646.1984.tb05657.x. [DOI] [PubMed] [Google Scholar]
- Williams B, Dransfield R, Brightwell R. The control of tsetse flies in relation to fly movement and trapping efficiency. J Appl Ecol. 1992;29:163–179. [Google Scholar]
- Wohlford DL, Krafsur ES, Griffiths NT, Marquez JG, Baker MD. Genetic differentiation of some Glossina morsitans morsitans populations. Med Vet Entomol. 1999;13:377–385. doi: 10.1046/j.1365-2915.1999.00185.x. [DOI] [PMC free article] [PubMed] [Google Scholar]
- Workman PL, Niswander JD. Population studies on southwestern Indian tribes. II. Local differentiation in the Papago. Am J Hum Genet. 1970;22:24–49. [PMC free article] [PubMed] [Google Scholar]
- Wright S. The theory of gene frequencies. Vol. 2. University of Chicago Press; Chicago: 1969. Evolution and the genetics of populations. [Google Scholar]
- Wright S. Variability within and among natural populations. Vol. 4. University of Chicago Press; Chicago: 1978. Evolution and the genetics of populations. [Google Scholar]