

Abstract
Motivation: Regulation of gene expression in space and time directs its localization to a specific subset of cells during development. Systematic determination of the spatiotemporal dynamics of gene expression plays an important role in understanding the regulatory networks driving development. An atlas for the gene expression patterns of fruit fly Drosophila melanogaster has been created by whole-mount in situ hybridization, and it documents the dynamic changes of gene expression pattern during Drosophila embryogenesis. The spatial and temporal patterns of gene expression are integrated by anatomical terms from a controlled vocabulary linking together intermediate tissues developed from one another. Currently, the terms are assigned to patterns manually. However, the number of patterns generated by high-throughput in situ hybridization is rapidly increasing. It is, therefore, tempting to approach this problem by employing computational methods.
Results: In this article, we present a novel computational framework for annotating gene expression patterns using a controlled vocabulary. In the currently available high-throughput data, annotation terms are assigned to groups of patterns rather than to individual images. We propose to extract invariant features from images, and construct pyramid match kernels to measure the similarity between sets of patterns. To exploit the complementary information conveyed by different features and incorporate the correlation among patterns sharing common structures, we propose efficient convex formulations to integrate the kernels derived from various features. The proposed framework is evaluated by comparing its annotation with that of human curators, and promising performance in terms of F1 score has been reported.
Contact: jieping.ye@asu.edu
Supplementary information: Supplementary data are available at Bioinformatics online.
1 INTRODUCTION
Detailed knowledge of the expression and interaction of genes is crucial to deciphering the mechanisms underlying cell-fate specification and tissue differentiation. DNA microarrays and RNA in situ hybridization are two primary methods for monitoring gene expression levels on a large scale. Microarrays provide a quantitative overview of the relative changes of expression levels of a large number of genes, but they do not often document the spatial information on individual genes. In contrast, RNA in situ hybridization uses gene-specific probes and can determine the spatial patterns of gene expression precisely. Recent high-throughput investigations have yielded spatiotemporal information for thousands of genes in organisms such as Drosophila (Lécuyer et al., 2007; Tomancak et al., 2002) and mouse (Carson et al., 2005; Lein et al., 2006). These data have the potential to provide significant insights into the functions and interactions of genes (Kumar et al., 2002; Samsonova et al., 2007).
The fruit fly Drosophila melanogaster is one of the model organisms in developmental biology, and its patterns of gene expression have been studied extensively (Arbeitman et al., 2002; Campos-Ortega and Hartenstein, 1997; Lécuyer et al., 2007; Tomancak et al., 2002). The comprehensive atlas of spatial patterns of gene expression during Drosophila embryogenesis has been created by in situ hybridization techniques, and the patterns are documented in the form of digital images (Grumbling et al., 2006; Harmon et al., 2007; Tomancak et al., 2002; Van Emden et al., 2006). Comparative analysis of gene expression pattern images can potentially reveal new genetic interactions and yield insights into the complex regulatory networks governing embryonic development (Estrada et al., 2006; Kumar et al., 2002; Peng and Myers, 2004; Tomancak et al., 2002).
To facilitate pattern comparison and searching, the images of Drosophila gene expression patterns are annotated with anatomical and developmental ontology terms using a controlled vocabulary (Grumbling et al., 2006; Tomancak et al., 2002). The basic requirement for annotation is to assign a unique term, not only for each terminally differentiated embryonic structure, but also for the developmental intermediates that correspond to it. Four general classes of terms, called anlage in statu nascendi, anlage, primordium and organ (ordered in terms of developmental time), are used in the annotation. Such an elaborate naming scheme describes a developing ‘path’, starting from the cellular blastoderm stage until organs are formed, which documents the dynamic process of Drosophila embryogenesis. Due to the overwhelming complexity of this task, the images are currently annotated manually by human experts. However, the number of available images produced by high-throughput in situ hybridization is now rapidly increasing (Gurunathan et al., 2004; Kumar et al., 2002; Peng and Myers, 2004; Tomancak et al., 2007; Ye et al., 2006). It is, therefore, tempting to design computational methods for the automated annotation of gene expression patterns.
The automated annotation of Drosophila gene expression patterns was originally considered difficult due to the lack of a large reference dataset from which to learn. Moreover, the ‘variation in morphology and incomplete knowledge of the shape and position of various embryonic structures’ have made this task more elusive (Tomancak et al., 2002). We attempt to address this problem by resorting to advanced tools developed recently in the computer vision and machine learning research communities and on the large set of annotated data available from the Berkeley Drosophila Genome Project (BDGP) (Tomancak et al., 2002). There are several challenging questions that need to be addressed when approaching this problem by computational methods. As has been stated in (Tomancak et al., 2002), the first challenge is to deal with the issue that the same embryonic structure can appear in different shapes and positions due to the distortions caused by the image acquisition process. Fortunately, recent advances in object recognition research have led to robust methods that can detect interest regions and extract features that are invariant to a class of local transformations from these regions. These two correlated lines of research have reached some maturity now [see Mikolajczyk et al., (2005) and Mikolajczyk and Schmid, (2005) for an overview].
The second challenge of this task lies in the data representation. The embryogenesis of Drosophila has been divided into six discrete stage ranges (1–3, 4–6, 7–8, 9–10, 11–12 and 13–16) in the BDGP high-throughput study (Tomancak et al., 2002). Gene expression patterns are documented collectively by a group of images in a specific stage range. Similarly, annotation terms are also associated with a group of patterns sharing a subset of the named structures (Fig. 1). These attributes of the existing biological data pose challenges, because traditional machine learning tools require that each object in question be represented by a feature vector of fixed length. It is challenging to encode the variable number of images in a group into a fixed-length vector. The existing approach (Zhou and Peng, 2007) is based on the simplifying assumption that the terms are associated with individual images instead of image groups. Kernel methods developed in machine learning are a class of versatile tools for learning from unconventional data types, since they only require that the similarity between objects be abstracted into the so-called kernel matrix (Schölkopf and Smola, 2002). Kernels between various data types, e.g., strings, trees, graphs, and sets of vectors, have been proposed in the literature (Grauman and Darrell, 2005; Kondor and Jebara, 2003; Schölkopf et al., 2004). We propose to extract a number of locally invariant features from each gene expression pattern image, and to compute kernels between sets of images based on the pyramid match algorithm (Grauman and Darrell, 2007a).
Fig. 1.

Sample image sets and the associated terms in the BDGP database in two stage ranges. Only images taken from lateral view with the anterior to the left are shown.
A recent comprehensive study shows that when local features are used to compute kernels between images, a combination of multiple feature types tends to yield better results than even the most discriminative individual feature type (Zhang et al., 2007). This motivates us to extract multiple feature types from each image and obtain multiple kernel matrices, one for each feature type. Thus, the final challenge for automated gene expression pattern annotation is to develop methods that can combine the multiple kernel matrices effectively. Automated methods for combining multiple kernel matrices, called multiple kernel learning (MKL), have been studied in machine learning recently. In such a framework, the optimal kernel matrix is obtained as a convex combination of a set of predefined candidate kernel matrices, and the coefficients for the combination can be computed by optimizing certain criteria. Methods for MKL have been proposed in the contexts of binary-class (Lanckriet et al., 2004a) and multi-class classification (Zien and Ong, 2007), and they have been applied successfully to various biological applications (De Bie et al., 2007; Lanckriet et al., 2004b). For the problem of gene expression pattern annotation, a variable number of terms from the controlled vocabulary can be assigned to a group of patterns. Hence, this problem belongs to the more general framework of multi-label learning. We propose methods based on hypergraph (Agarwal et al., 2006; Zhou et al., 2007) to project and combine the multiple kernel matrices for multi-label data. The proposed formulation can capture the correlation among patterns sharing a common embryonic structure by including them in a common edge in hypergraph. We also show that kernel canonical correlation analysis (Hardoon et al., 2004) is a special case of the proposed formulation. The overall flowchart of the proposed framework is depicted in Figure 2.
Fig. 2.

Illustration of the proposed framework for annotating gene expression patterns. We extract multiple types of features from image groups and construct multiple kernels using the pyramid match algorithm. The multiple kernels are then combined to annotate the image groups. Different shapes represent different types of features, and filled and hollow shapes are used to distinguish features from the two different image groups.
We discuss feature generation and kernel construction in Section 2. The proposed formulation for multi-label multiple kernel learning is presented in Section 3. We report the results on gene expression pattern annotation in Section 4 and conclude this article with future work in Section 5.
2 FEATURE GENERATION AND KERNEL CONSTRUCTION
In this section, we present our methods for extracting features from gene expression pattern images and constructing kernels between sets of patterns.
2.1 Feature generation
There are two primary methods for extracting features. When the images are not well-aligned, the covariant region detector is first applied on the images to detect interest regions. Then, local descriptor is used to extract features from the detected regions. An alternative approach is to apply local descriptor on a dense regular grid, instead of interest regions (Grauman and Darrell, 2007b; Lazebnik et al., 2006). Such an approach is motivated from the bag-of-words model from the text-modeling literature, and competitive performance has been achieved on image applications (Fei-Fei and Perona, 2005). Since the images in our FlyExpress (Van Emden et al., 2006) database are already well-aligned, we take the second approach in this article (Fig. 2). Instead of tuning the local descriptor and grid size manually, we apply several popular local descriptors on regular grids of different sizes, and rely on the MKL framework to select the appropriate local descriptors and grid size. More details on feature generation are described in Section 4.
2.2 Pyramid match kernels
In kernel methods, a symmetric function is called a ‘kernel function’ if it satisfies the Mercer's condition (Schölkopf and Smola, 2002). When used for a finite number of samples in practice, this condition amounts to requiring that the kernel matrix is positive semidefinite. The wide applicability of kernel methods stems from the fact that they only require the characterization of similarities between objects by the use of the kernel trick.
The pyramid match algorithm (Grauman and Darrell, 2005); (Grauman and Darrell, 2007a; Grauman and Darrell, 2007b) computes kernels for variable-sized sets of feature vectors. The main idea of this approach is to convert sets of features to multi-dimensional, multi-resolution histograms, and then compute the similarity between the corresponding histograms based on histogram intersections. The final similarity between two sets of vectors is computed as a weighted sum of the similarities at the histogram levels. This similarity is an approximation to the similarity of the best partial matching between the feature sets. The resulting similarity matrix based on this measure is provably positive definite, and it can be used in existing kernel-based learning algorithms. Details on the pyramid match algorithm can be found in the Supplementary Material.
The pyramid match algorithms proposed in Grauman and Darrell, (2005, 2007a, b) treat the sets of features to be matched as orderless. In some applications, the spatial layout of features within a set may convey critical discriminative information. Lazebnik et al., (2006) proposed the spatial pyramid matching algorithm to perform pyramid matching in the 2D image space, thus taking the spatial information into account directly. The main idea of this approach is to quantize the local features in images into a number of discrete types by applying clustering algorithms, and then place multi-resolution histogram pyramid on the 2D images. It is also possible to integrate geometric information directly into the original pyramid match algorithm by adding the image coordinates as two additional dimensions into each feature vector (Lazebnik et al., 2006, Grauman, K 2007, private communication), and we adopt this approach in this article. Note that the original pyramid match algorithms are proposed to match two images, and that we extend them to match two sets of images.
3 LEARNING WITH MULTIPLE KERNELS
In this section, we present a multi-label, multiple kernel learning formulation based on hypergraph for integrating the kernel matrices derived from various local descriptors. Results in Section 4 show that the integrated kernels yield better performance than that of the best individual kernel.
3.1 Hypergraph spectral learning
Hypergraph generalizes traditional graph by allowing edges, known as ‘hyperedges’, to connect more than two vertices, thus capturing the joint relationship among multiple vertices. We propose to construct a hypergraph (for the collection of gene expression patterns in question) in which each pattern is represented as a vertex. To document the joint similarity among patterns annotated with a common term, we propose to construct a hyperedge for each term in the vocabulary, and include all patterns annotated with a common term into one hyperedge. Hence, the number of hyperedges in this hypergraph equals the number of terms in the vocabulary.
Laplacian is commonly used to learn from a graph (Chung, 1997). To learn from a hypergraph, one can either define hypergraph Laplacian directly, or expand it into a traditional graph for which Laplacian is constructed. Since it has been shown that the Laplacians defined in both ways are similar (Agarwal et al., 2006), we use the expansion-based approaches in this article. The star and clique expansions are two commonly used schemes for expanding hypergraphs. Following the spectral graph embedding theory (Chung, 1997), we propose to project the patterns into a low-dimensional space in which patterns sharing a common term are close to each other. When formulated in the kernel-induced feature space, this can be achieved by solving the following optimization problem:
| (1) |
where K∈ℝn × n is the kernel matrix, n is the number of image sets, C=I−ℒ in which ℒ is the normalized Laplacian matrix derived from the hypergraph, B is the coefficient matrix for reconstructing the projection in feature space and λ>0 is the regularization parameter.
Kernel canonical correlation analysis (kCCA) (Hardoon et al., 2004) is a widely used method for dimensionality reduction. It can be shown that kCCA involves the following optimization problem:
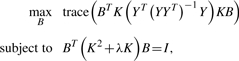 |
(2) |
where Y is the label matrix. Thus, kCCA is a special case of our proposed formulation based on hypergraph.
3.2 A convex formulation
It follows from the theory of reproducing kernels (Schölkopf and Smola, 2002) that the kernel K in Equation (1) uniquely determines a mapping of the patterns to some feature space. Thus, kernel selection (learning) is one of the central issues in kernel methods. Following the multiple kernel learning framework (Lanckriet et al., 2004a), we propose to obtain an optimal kernel matrix by integrating multiple kernel matrices constructed from various features, that is, K=∑j=1pθj Kj where {Kj}j=1p are the p kernels constructed from various local descriptors and {θj}j=1p are the weights satisfying ∑j=1p θj trace(Kj)=1. We show that the optimal weights that maximize the objective function in Equation (1) can be obtained by solving a semi-infinite linear program (SILP) (Hettich and Kortanek, 1993) in which a linear objective is optimized subject to an infinite number of linear constraints. This is summarized in the following theorem (Proof given in the Supplementary Material):
THEOREM 3.1. —
Given a set of p kernel matrices K1, …, Kp, the optimal kernel matrix, in the form of a linear combination of the given p kernel matrices that maximizes the objective function in Equation (1), can be obtained by solving the following SILP problem:
(3)
(4) where Sj(Ψ), for j=1,…,p, is defined as
(5) Ψ=[ψ1,…,ψk], r=(r1,…,rp)T, and rj=trace(Kj).
The SILP formulation proposed in Theorem 3.1 can be solved by the so-called ‘column generation’ technique, and more details can be found in the Supplementary Material.
4 RESULTS
In this section, we apply the proposed framework for annotating gene expression patterns. We use a collection of images obtained from the FlyExpress database (Van Emden et al., 2006), which contains standardized and aligned images. All the images used are taken from lateral view with the anterior to the left. The size of each raw image is 128 × 320.
4.1 Experimental setup
We apply nine local descriptors on regular grids of two different sizes on each image. The nine local descriptors are SIFT, shape context, PCA-SIFT, spin image, steerable filters, differential invariants, complex filters, moment invariants and cross-correlation. These local descriptors are commonly used for objection recognition (more details can be found in Mikolajczyk and Schmid, 2005). The sizes of the grids we used are 16 and 32 pixels in radius and spacing (Fig. 2), and 133 and 27 local features are produced for each image, respectively.
It is known that local textures are important discriminative features of gene expression pattern images, and features constructed from filter banks and raw pixel intensities are effective in capturing such information (Varma and Zisserman, 2003). We, therefore, apply Gabor filters with different wavelet scales and filter orientations on each image to obtain global features of 384 and 2592 dimensions. We also sample the pixel values of each image using a bilinear technique, and obtain features of 10240, 2560 and 640 dimensions. The resulting features are called ‘global features’.
After generating the features, we apply the vocabulary-guided pyramid match algorithm (Grauman and Darrell, 2007a) to construct kernels between image sets. A total of 23 kernel matrices (2 grid sizes × 9 local descriptors + 2 Gabor + 3 pixel) are obtained. Then, the proposed MKL formulation is employed to obtain the optimal integrated kernel matrix. The performance of kernel matrices (either single or integrated) is evaluated by applying the support vector machine (SVM) for each term and treating image sets annotated with this term as positive, and all other image sets as negative. We extract different numbers of terms from the FlyExpress database and use various numbers of image sets annotated with the selected terms for the experiments.
Precision and recall are two commonly used criteria for evaluating the performance of multi-label classification systems (Datta et al., 2008). For each term, let Π and Λ denote the indices of patterns that are annotated with this term by the proposed framework and by human curators in BDGP, respectively. Then, precision and recall for this term are defined to be P=|Π∩Λ|/|Π| and R=|Π∩Λ|/|Λ|, respectively, where |·| denotes the set cardinality. The F1 score is the harmonic mean of precision and recall as F1=(2 × P × R)/(P+R). To measure performance across multiple terms, we use both the macro F1 (average of F1 across all terms) and the micro F1 (F1 computed from the sum of per-term contingency tables) scores, which are commonly used in text and image applications (Datta et al., 2008). In each case, the entire dataset is randomly partitioned into training and test sets with ratio 1:1. This process is repeated 10 times, and the averaged performance is reported. We report the performance of each individual kernel and compare it with methods based on multi-instance learning on a dataset of 10 terms and 1000 image sets in the Supplementary Marterial. Results indicate that kernels constructed from the SIFT and PCA-SIFT descriptors yield the highest performance.
4.2 Annotation results
We apply the proposed formulations (star, clique and kCCA) to combine the various kernel matrices derived from different local descriptors. The performance of multiple kernel learning based on the soft margin 1-norm SVM (SVM1) criterion proposed in Lanckriet et al., (2004a) is also reported. Since the SVM1 formulation is only applicable to binary-class problems, we apply the formulation for each term by treating image sets annotated with this term as positive, and all other image sets as negative. To demonstrate the effectiveness of the proposed formulation for integrating kernels, we also report results obtained by combining the candidate kernels with uniform weight, along with the performance of the best individual kernel (among the 23 kernels) for each dataset. To compare with the existing method proposed in Zhou and Peng, (2007), we extract wavelet features from images and apply the min-redundancy max-relevance feature selection algorithm to select a subset of features. As was done in Zhou and Peng, (2007), we assign terms to individual images and apply linear discriminant analysis to annotate each image. Note that this setup does not consider the image group information and is the same as the one proposed in Zhou and Peng (2007). The annotation results measured by F1 score and precision and recall are summarized in Tables 1–4.
Table 1.
Performance of integrated kernels on gene expression pattern annotation in terms of macro F1 score
| No. of terms | 10 |
20 |
30 |
40 |
50 |
60 |
||||||||||||
|---|---|---|---|---|---|---|---|---|---|---|---|---|---|---|---|---|---|---|
| No. of sets | 1000 | 1500 | 2000 | 1000 | 1500 | 2000 | 1000 | 1500 | 2000 | 1000 | 1500 | 2000 | 1000 | 1500 | 2000 | 1000 | 1500 | 2000 |
| Star | 0.5661 | 0.5741 | 0.5434 | 0.4396 | 0.4903 | 0.4575 | 0.3852 | 0.4437 | 0.4162 | 0.3768 | 0.4019 | 0.3927 | 0.3522 | 0.3850 | 0.3862 | 0.3219 | 0.3364 | 0.3426 |
| Clique | 0.5251 | 0.5220 | 0.4876 | 0.4536 | 0.5125 | 0.4926 | 0.4065 | 0.4747 | 0.4563 | 0.4145 | 0.4346 | 0.4283 | 0.3872 | 0.4106 | 0.4198 | 0.3594 | 0.3631 | 0.3639 |
| kCCA | 0.5487 | 0.5608 | 0.5323 | 0.3987 | 0.4635 | 0.4477 | 0.3497 | 0.4240 | 0.4063 | 0.3538 | 0.3872 | 0.3759 | 0.3303 | 0.3642 | 0.3666 | 0.2996 | 0.3137 | 0.3263 |
| SVM1 | 0.4924 | 0.5413 | 0.5353 | 0.3780 | 0.4640 | 0.4356 | 0.3523 | 0.4352 | 0.4200 | 0.3741 | 0.4048 | 0.3955 | 0.3481 | 0.3869 | 0.3991 | 0.3316 | 0.3462 | 0.3570 |
| Uniform | 0.4947 | 0.5498 | 0.5418 | 0.3727 | 0.4703 | 0.4480 | 0.3513 | 0.4410 | 0.4191 | 0.3719 | 0.4111 | 0.3986 | 0.3436 | 0.3920 | 0.4023 | 0.3298 | 0.3548 | 0.3586 |
| BIK | 0.5418 | 0.5430 | 0.5185 | 0.4241 | 0.4515 | 0.4344 | 0.3782 | 0.4312 | 0.3996 | 0.3914 | 0.3954 | 0.3827 | 0.3701 | 0.3849 | 0.3763 | 0.3456 | 0.3448 | 0.3419 |
| Z&P | 0.3756 | 0.3810 | 0.3775 | 0.2695 | 0.2759 | 0.2804 | 0.2086 | 0.2470 | 0.2379 | 0.2117 | 0.2171 | 0.2310 | 0.1926 | 0.2284 | 0.2167 | 0.1764 | 0.1827 | 0.1679 |
We first select a number of terms and then extract certain number of image sets annotated with at least one of the selected terms. The number of terms used are 10, 20, 30, 40, 50 and 60, and the number of image sets used are 1000, 1500 and 2000 in each case. The first three rows report the F1 scores obtained by kernels combined with star expansion, clique expansion and CCA, respectively. The fourth row presents the F1 scores achieved by kernels combined with the soft margin 1-norm SVM (SVM1) formulation in which an optimal kernel is learned for each term separately. The fifth row shows the F1 scores achieved by kernels combined from the candidate kernels with uniform weights. The performance of the best individual kernel (BIK) over all local descriptors and grid sizes on the same dataset is reported in the sixth row. The results obtained by the method proposed in (Zhou and Peng, 2007) are reported in the last row. The performance shown in this table is the averaged scores over 10 random partitions of the entire dataset into training and test sets with ratio 1:1.
Table 2.
Performance of integrated kernels on gene expression pattern annotation in terms of micro F1 score
| No. of terms | 10 |
20 |
30 |
40 |
50 |
60 |
||||||||||||
|---|---|---|---|---|---|---|---|---|---|---|---|---|---|---|---|---|---|---|
| No. of sets | 1000 | 1500 | 2000 | 1000 | 1500 | 2000 | 1000 | 1500 | 2000 | 1000 | 1500 | 2000 | 1000 | 1500 | 2000 | 1000 | 1500 | 2000 |
| Star | 0.5841 | 0.6011 | 0.5728 | 0.4861 | 0.5199 | 0.4847 | 0.4472 | 0.4837 | 0.4473 | 0.4277 | 0.4470 | 0.4305 | 0.4168 | 0.4347 | 0.4212 | 0.4000 | 0.4171 | 0.3999 |
| Clique | 0.5424 | 0.5429 | 0.5079 | 0.5039 | 0.5422 | 0.5247 | 0.4682 | 0.5127 | 0.4894 | 0.4610 | 0.4796 | 0.4660 | 0.4454 | 0.4546 | 0.4580 | 0.4314 | 0.4420 | 0.4251 |
| kCCA | 0.5727 | 0.5922 | 0.5643 | 0.4581 | 0.4994 | 0.4887 | 0.4209 | 0.4737 | 0.4532 | 0.4095 | 0.4420 | 0.4271 | 0.4000 | 0.4241 | 0.4086 | 0.3778 | 0.4042 | 0.3920 |
| SVM1 | 0.5290 | 0.5781 | 0.5786 | 0.4361 | 0.5024 | 0.4844 | 0.4239 | 0.4844 | 0.4632 | 0.4248 | 0.4570 | 0.4415 | 0.4095 | 0.4420 | 0.4429 | 0.3947 | 0.4234 | 0.4188 |
| Uniform | 0.5341 | 0.5870 | 0.5837 | 0.4390 | 0.5096 | 0.4975 | 0.4242 | 0.4939 | 0.4683 | 0.4268 | 0.4673 | 0.4492 | 0.4092 | 0.4518 | 0.4482 | 0.3999 | 0.4358 | 0.4226 |
| BIK | 0.5585 | 0.5650 | 0.5637 | 0.4614 | 0.4735 | 0.4562 | 0.4189 | 0.4484 | 0.4178 | 0.4100 | 0.4196 | 0.4009 | 0.3914 | 0.4051 | 0.3957 | 0.3869 | 0.3905 | 0.3781 |
| Z&P | 0.4031 | 0.4032 | 0.3796 | 0.3034 | 0.2985 | 0.2827 | 0.2612 | 0.2441 | 0.2125 | 0.2406 | 0.2310 | 0.2203 | 0.2203 | 0.2174 | 0.2114 | 0.1977 | 0.1826 | 0.1586 |
This table shows the performance of each method in terms of micro F1 score. See the footnotes of Table 1 for detailed explanations.
Table 3.
Performance of integrated kernels on gene expression pattern annotation in terms of precision
| No. of terms | 10 |
20 |
30 |
40 |
50 |
60 |
||||||||||||
|---|---|---|---|---|---|---|---|---|---|---|---|---|---|---|---|---|---|---|
| No. of sets | 1000 | 1500 | 2000 | 1000 | 1500 | 2000 | 1000 | 1500 | 2000 | 1000 | 1500 | 2000 | 1000 | 1500 | 2000 | 1000 | 1500 | 2000 |
| Star | 0.5246 | 0.5141 | 0.4861 | 0.4629 | 0.5349 | 0.4842 | 0.4674 | 0.5533 | 0.5089 | 0.5122 | 0.5559 | 0.5510 | 0.4968 | 0.5611 | 0.5509 | 0.5256 | 0.5439 | 0.5614 |
| Clique | 0.4586 | 0.4375 | 0.3968 | 0.4531 | 0.5244 | 0.5053 | 0.4674 | 0.5510 | 0.5379 | 0.5219 | 0.5502 | 0.5660 | 0.5078 | 0.5433 | 0.5831 | 0.5240 | 0.5501 | 0.5665 |
| kCCA | 0.5448 | 0.5443 | 0.5230 | 0.4917 | 0.5737 | 0.5585 | 0.5056 | 0.6120 | 0.6102 | 0.5235 | 0.6116 | 0.6421 | 0.5124 | 0.6154 | 0.6139 | 0.5373 | 0.5894 | 0.6642 |
| SVM1 | 0.5973 | 0.6163 | 0.5985 | 0.5387 | 0.6121 | 0.6211 | 0.5124 | 0.6323 | 0.6227 | 0.5253 | 0.6151 | 0.6476 | 0.5196 | 0.6126 | 0.6429 | 0.5176 | 0.5628 | 0.6427 |
| Uniform | 0.6258 | 0.6462 | 0.6155 | 0.5691 | 0.6417 | 0.6495 | 0.5379 | 0.6576 | 0.6450 | 0.5596 | 0.6511 | 0.6766 | 0.5349 | 0.6504 | 0.6782 | 0.5625 | 0.5986 | 0.6717 |
| BIK | 0.4956 | 0.4830 | 0.4687 | 0.4247 | 0.4994 | 0.4814 | 0.4265 | 0.5089 | 0.4779 | 0.4626 | 0.5200 | 0.5299 | 0.4470 | 0.5093 | 0.5519 | 0.4744 | 0.5125 | 0.573 |
| Z&P | 0.3298 | 0.3244 | 0.3182 | 0.2311 | 0.2455 | 0.2453 | 0.1897 | 0.2164 | 0.2106 | 0.1877 | 0.1958 | 0.2127 | 0.1765 | 0.2037 | 0.1976 | 0.1570 | 0.1627 | 0.1515 |
This table shows the performance of each method in terms of precision. See the footnotes of Table 1 for detailed explanations.
Table 4.
Performance of integrated kernels on gene expression pattern annotation in terms of recall
| No. of terms | 10 |
20 |
30 |
40 |
50 |
60 |
||||||||||||
|---|---|---|---|---|---|---|---|---|---|---|---|---|---|---|---|---|---|---|
| No. of sets | 1000 | 1500 | 2000 | 1000 | 1500 | 2000 | 1000 | 1500 | 2000 | 1000 | 1500 | 2000 | 1000 | 1500 | 2000 | 1000 | 1500 | 2000 |
| Star | 0.6482 | 0.6892 | 0.6694 | 0.5019 | 0.5303 | 0.5117 | 0.4033 | 0.4535 | 0.4338 | 0.3675 | 0.3901 | 0.3811 | 0.3346 | 0.3573 | 0.3606 | 0.2961 | 0.3124 | 0.3143 |
| Clique | 0.6331 | 0.6654 | 0.6527 | 0.5238 | 0.5649 | 0.5479 | 0.4284 | 0.4820 | 0.4636 | 0.4075 | 0.4210 | 0.4063 | 0.3701 | 0.3808 | 0.3834 | 0.3336 | 0.3323 | 0.3244 |
| kCCA | 0.5952 | 0.6285 | 0.5966 | 0.4111 | 0.4483 | 0.4259 | 0.3292 | 0.3854 | 0.3603 | 0.3171 | 0.3366 | 0.3174 | 0.2905 | 0.3075 | 0.3008 | 0.2575 | 0.2603 | 0.2597 |
| SVM1 | 0.4890 | 0.5383 | 0.5211 | 0.3494 | 0.4237 | 0.3890 | 0.3178 | 0.3898 | 0.3665 | 0.3322 | 0.3528 | 0.3300 | 0.3035 | 0.3300 | 0.3298 | 0.2844 | 0.2945 | 0.2878 |
| Uniform | 0.4830 | 0.5378 | 0.5198 | 0.3403 | 0.4219 | 0.3948 | 0.3098 | 0.3919 | 0.3626 | 0.3218 | 0.3569 | 0.3285 | 0.2963 | 0.3325 | 0.3280 | 0.2789 | 0.3014 | 0.2873 |
| BIK | 0.6625 | 0.6991 | 0.6954 | 0.5507 | 0.5726 | 0.5613 | 0.4648 | 0.5156 | 0.4983 | 0.4555 | 0.4764 | 0.4767 | 0.4337 | 0.4638 | 0.4678 | 0.4158 | 0.4335 | 0.4374 |
| Z&P | 0.4990 | 0.5504 | 0.5881 | 0.4242 | 0.3990 | 0.4460 | 0.2599 | 0.3869 | 0.3990 | 0.3271 | 0.2985 | 0.3327 | 0.2783 | 0.3427 | 0.3107 | 0.2757 | 0.3023 | 0.3069 |
This table shows the performance of each method in terms of recall. See the footnotes of Table 1 for detailed explanations.
It can be observed from the results that in terms of both macro and micro F1 scores, the kernels integrated by either star or clique expansions achieve the highest performance on all but one of the datasets. This shows that the proposed formulation is effective in combining multiple kernels and potentially exploiting the complementary information contained in different kernels. For all datasets, the integrated kernels outperform the best individual kernel. In terms of precision and recall, our results indicate that SVM1 and Uniform achieve higher precision than the proposed formulations, while they both yield significantly lower recall. On the other hand, the best individual kernel produces slightly higher recall than the proposed formulations, while it yields significantly lower precision. Note that precision and recall are two competing criteria, and one can always achieve a perfect score on one of them at the price of the other. Hence, the proposed formulation achieves a harmonic balance between precision and recall, as indicated by the F1 scores. Note that BIK can have both higher precision and higher recall than the proposed formulation, since we report the highest precision and the highest recall among all of the candidate kernels separately. Hence, the BIK for precision and recall may not correspond to the same kernel. For all the four measures, the proposed formulations outperform the method proposed in Zhou and Peng, (2007) significantly. This shows that the annotation performance can be improved by considering the image group information.
Figure 3 shows some annotation results obtained by clique expansion for sample patterns in each stage range. Note that the pyramid match algorithm can compute kernels between variable-sized sets of images. Thus, terms can be predicted for image sets of any size. Overall, the proposed computational framework achieves promising performance on annotating gene expression patterns. Meanwhile, we realize that the current framework suffers from some potential limitations. By comparing the BDGP terms and the predicted terms for patterns in stage ranges 7–8 and 9–10, we can see that the structures related to endoderm are predicted correctly while some of those related to mesoderm are prone to error. This may be due to the fact that, when viewed laterally, structures related to mesoderm are more prone to be hidden than those related to endoderm. This phenomenon becomes clearer when we examine the results for stage range 13–16 in Figures 3 and 4. As shown in Figure 4, there are a total of five images in this set in the original BDGP database. Among these five images, only two of them (the first and third) are taken from the lateral view and hence are used in our experiments. The second and the fourth images are taken from the ventral view, and the fifth image is taken from the dorsal view. The structure ventral midline can only be documented by digital images taken from the ventral view as can be seen from the second and the fourth images in Figure 4. Since we only use images from the lateral view, it can be seen from Figure 3 that the proposed framework cannot predict this term correctly. This problem can potentially be solved by using images taken from other views such as ventral and dorsal. However, incorporation of images with multiple views may complicate the computational procedure, so requires a special care.
Fig. 3.

Annotation results for sample patterns in the six stage ranges. BDGP terms denote terms that are assigned by human curators in the Berkeley Drosophila Genome Project (Tomancak et al., 2002), and predicted terms denote terms predicted by the proposed computational framework. These patterns are randomly sampled from each stage range, and hence they may not correspond to the same gene.
Fig. 4.

The original five images in stage range 13–16 from BDGP. The first and the third images are taken from lateral view; the second and the fourth images are taken from ventral view; the fifth image is taken from dorsal view. Only the first and the third images are used in our experiments shown in the bottom of Figure 3.
To evaluate the scalability of the proposed formulations, we vary the number of terms and the number of image sets, and compare the change of computation time. On a machine with Pentium 43.40 GHz CPU and 1 GB of RAM, when the number of terms is increased from 20 to 60 on a dataset of 500 image sets, the computation time increases from approximately 4s to 11s. In terms of the number of image sets, datasets of 1500 and 2000 image sets with 60 terms take around 3 and 4 min, respectively.
5 CONCLUSIONS AND DISCUSSIONS
In this article, we have presented a computational framework for annotating gene expression patterns of Drosophila. We propose to extract invariant features from gene expression pattern images and construct kernels between these sets of features. To integrate multiple kernels effectively, we propose multi-label, multiple kernel learning formulations based on hypegraph. Experimental evaluation shows that the integrated kernels consistently outperform the best individual kernel. Currently, the annotation of patterns by human curators requires multiple passes, and the proposed framework can be used as a preprocessing step whose annotation is further refined by human curators.
In future work, we plan to perform a detailed analysis of the weights obtained by the MKL formulation, and investigate how they are related to the relevance of each kernel. Our experimental results show that features extracted on smaller grids tend to yield better results. However, computational resource limitations prevent the use of a grid size smaller than 16 pixels. We plan to explore ways to overcome this problem. Retrieving gene expression patterns by combining information from images and annotations is an interesting and challenging research issue. The proposed framework can assign a probability of associating each term to each image, producing a probability vector for unannotated images from various high-throughput experiments. Such information can potentially be exploited to facilitate pattern retrieval. Detailed analysis of the annotation results produced by the proposed framework indicates that integration of gene expression pattern images taken from multiple views can potentially improve the annotation performance. In this case, the current pyramid match algorithms need to be adapted so that only images taken from the same view are matched. It can be seen from the third and fifth images in Figure 4 that the annotation terms can also be associated with partial patterns in each image. These partial patterns have been removed in our FlyExpress database (Fig. 3), so these terms cannot be predicted correctly by the proposed framework. We plan to explore ways to incorporate these partial patterns in the future.
Supplementary Material
ACKNOWLEDGEMENTS
We thank Kristen Grauman, John Lee and Zhi-Hua Zhou for fruitful discussions, Hanchuan Peng for the feature selection code, Kristi Garboushian for editorial support, and Bernard Van Emden for help with access to the gene expression data.
Funding: This work is supported in part by research grants from National Institutes of Health under No. HG002516 and National Science Foundation under No. IIS-0612069.
Confilct of Interest: none declared.
REFERENCES
- Agarwal S, et al. Proceedings of the 23rd International Conference on Machine Learning. New York, NY, USA: ACM Press; 2006. Higher order learning with graphs; pp. 17–24. [Google Scholar]
- Arbeitman MN, et al. Science. 2002;297:2270–2275. doi: 10.1126/science.1072152. [DOI] [PubMed] [Google Scholar]
- Campos-Ortega JA, Hartenstein V. The Embryonic Development of Drosophila Melanogaster. 2nd edn. Berlin/Heidelberg, New York: Springer-Verlag; 1997. [Google Scholar]
- Carson J, et al. A digital atlas to characterize the mouse brain transcriptome. PLoS Computat. Biol. 2005;1:e41. doi: 10.1371/journal.pcbi.0010041. [DOI] [PMC free article] [PubMed] [Google Scholar]
- Chung F.RK. Spectral Graph Theory. American Mathematical Society; 1997. [Google Scholar]
- Datta R, et al. ACM Computing Surveys. Vol. 40. New York, NY, USA: ACM Press; 2008. Image retrieval: ideas, influences, and trends of the new age; pp. 1–60. [Google Scholar]
- De Bie T, et al. Kernel-based data fusion for gene prioritization. Bioinformatics. 2007;23:i125–i132. doi: 10.1093/bioinformatics/btm187. [DOI] [PubMed] [Google Scholar]
- Estrada B, et al. An integrated strategy for analyzing the unique developmental programs of different myoblast subtypes. PLoS Genet. 2006;2:160–171. doi: 10.1371/journal.pgen.0020016. [DOI] [PMC free article] [PubMed] [Google Scholar]
- Fei-Fei L, Perona P. Proceedings of the 2005 IEEE Computer Society Conference on Computer Vision and Pattern Recognition. Washington, DC, USA: IEEE Computer Society; 2005. A Bayesian hierarchical model for learning natural scene categories; pp. 524–531. [Google Scholar]
- Grauman K, Darrell T. Proceedings of the Tenth IEEE International Conference on Computer Vision. Washington, DC, USA: IEEE Computer Society; 2005. The pyramid match kernel: discriminative classification with sets of image features; pp. 1458–1465. [Google Scholar]
- Grauman K, Darrell T. Approximate correspondences in high dimensions. In: Schölkopf B, et al., editors. Advances in Neural Information Processing Systems. Cambridge, MA: MIT Press; 2007a. pp. 505–512. [Google Scholar]
- Grauman K, Darrell T. The pyramid match kernel: efficient learning with sets of features. J. Mach. Learn. Res. 2007b;8:725–760. [Google Scholar]
- Grumbling G, et al. FlyBase: anatomical data, images and queries. Nucleic Acids Res. 2006;34:D484–D488. doi: 10.1093/nar/gkj068. [DOI] [PMC free article] [PubMed] [Google Scholar]
- Gurunathan R, et al. Identifying spatially similar gene expression patterns in early stage fruit fly embryo images: binary feature versus invariant moment digital representations. BMC Bioinformatics. 2004;5:13. doi: 10.1186/1471-2105-5-202. [DOI] [PMC free article] [PubMed] [Google Scholar]
- Hardoon DR, et al. Canonical correlation analysis: an overview with application to learning methods. Neural Comput. 2004;16:2639–2664. doi: 10.1162/0899766042321814. [DOI] [PubMed] [Google Scholar]
- Harmon C, et al. Proceedings of the Eleventh Annual International Conference on Research in Computational Molecular Biology. Berlin/Heidelberg: Springer; 2007. Comparative analysis of spatial patterns of gene expression inDrosophila melanogasterimaginal discs; pp. 533–547. [Google Scholar]
- Hettich R, Kortanek KO. Semi-infinite programming: theory, methods, and applications. SIAM Rev. 1993;35:380–429. [Google Scholar]
- KondorR., Jebara T. Proceedings of the Twentieth International Conference on Machine Learning. AAAI Press; 2003. A kernel between sets of vectors; pp. 361–368. [Google Scholar]
- Kumar S, et al. BEST: a novel computational approach for comparing gene expression patterns from early stages ofDrosophlia melanogasterdevelopment. Genetics. 2002;169:2037–2047. doi: 10.1093/genetics/162.4.2037. [DOI] [PMC free article] [PubMed] [Google Scholar]
- Lanckriet G.RG, et al. Learning the kernel matrix with semidefinite programming. J. Mach. Learn. Res. 2004a;5:27–72. [Google Scholar]
- Lanckriet G.RG, et al. A statistical framework for genomic data fusion. Bioinformatics. 2004b;20:2626–2635. doi: 10.1093/bioinformatics/bth294. [DOI] [PubMed] [Google Scholar]
- Lazebnik S, et al. Proceedings of the 2006 IEEE Computer Society Conference on Computer Vision and Pattern Recognition. Washington, DC, USA: IEEE Computer Society; 2006. Beyond bags of features: spatial pyramid matching for recognizing natural scene categories; pp. 2169–2178. [Google Scholar]
- Lécuyer E, et al. Global analysis of mRNA localization reveals a prominent role in organizing cellular architecture and function. Cell. 2007;131:174–187. doi: 10.1016/j.cell.2007.08.003. [DOI] [PubMed] [Google Scholar]
- Lein ES, et al. Genome-wide atlas of gene expression in the adult mouse brain. Nature. 2006;445:168–176. doi: 10.1038/nature05453. [DOI] [PubMed] [Google Scholar]
- Mikolajczyk K, Schmid C. A performance evaluation of local descriptors. IEEE Trans. Pattern Anal. Mach. Intell. 2005;27:1615–1630. doi: 10.1109/TPAMI.2005.188. [DOI] [PubMed] [Google Scholar]
- Mikolajczyk K, et al. A comparison of affine region detectors. Int. J. Comput. Vis. 2005;65:43–72. [Google Scholar]
- Peng H, Myers EW. Proceedings of the Eighth Annual International Conference on Research in Computational Molecular Biology. New York, NY, USA: ACM Press; 2004. Comparingin situmRNA expression patterns ofDrosophilaembryos; pp. 157–166. [Google Scholar]
- Samsonova AA, et al. Prediction of gene expression in embryonic structures ofDrosophila melanogaster. PLoS Comput. Biol. 2007;3:1360–1372. doi: 10.1371/journal.pcbi.0030144. [DOI] [PMC free article] [PubMed] [Google Scholar]
- Schölkopf S, Smola A. Learning with Kernels: Support Vector Machines, Regularization, Optimization and Beyond. Cambridge, MA, USA: MIT Press; 2002. [Google Scholar]
- Schölkopf S, et al. Kernel Methods in Computational Biology. Cambridge, MA, USA: MIT Press; 2004. [Google Scholar]
- Sonnenburg S, et al. Large scale multiple kernel learning. J. Mach. Learn. Res. 2006;7:1531–1565. [Google Scholar]
- Tomancak P, et al. Systematic determination of patterns of gene expression duringDrosophilaembryogenesis. Genome Biol. 2002;3 doi: 10.1186/gb-2002-3-12-research0088. [DOI] [PMC free article] [PubMed] [Google Scholar]
- Tomancak P, et al. Global analysis of patterns of gene expression duringDrosophilaembryogenesis. Genome Biol. 2007;8:R145. doi: 10.1186/gb-2007-8-7-r145. [DOI] [PMC free article] [PubMed] [Google Scholar]
- Van Emden B, et al. 2006. [last accessed date 30 April 2008]. FlyExpress: an image-matching web-tool for finding genes with overlapping patterns of expression inDrosophilaembryos. Available at http://www.flyexpress.net/ [Google Scholar]
- Varma M, Zisserman A. Proceedings of the 2003 IEEE Computer Society Conference on Computer Vision and Pattern Recognition. Washington, DC, USA: IEEE Computer Society; 2003. Texture classification: are filter banks necessary? pp. 691–698. [Google Scholar]
- Ye J, et al. Proceedings of the Computational Systems Bioinformatics Conference. 2006. Classification ofDrosophilaembryonic developmental stage range based on gene expression pattern images; pp. 293–298. [PubMed] [Google Scholar]
- Zhang J, et al. Local features and kernels for classification of texture and object categories: a comprehensive study. Int. J. Comput. Vis. 2007;73:213–238. [Google Scholar]
- Zhou D, et al. Learning with hypergraphs: clustering, classification, and embedding. In: Schölkopf B, et al., editors. Advances in Neural Information Processing Systems. Cambridge, MA: MIT Press; 2007. pp. 1601–1608. [Google Scholar]
- Zhou J, Peng H. Automatic recognition and annotation of gene expression patterns of fly embryos. Bioinformatics. 2007;23:589–596. doi: 10.1093/bioinformatics/btl680. [DOI] [PubMed] [Google Scholar]
- Zhou ZH, Zhang ML. Multi-instance multi-label learning with application to scene classification. In: Schölkopf B, et al., editors. Advances in Neural Information Processing Systems. Cambridge, MA: MIT Press; 2007. pp. 1609–1616. [Google Scholar]
- Zien A, Ong CS. Proceedings of the 24th International Conference on Machine Learning. ACM, New York, NY, USA: Multiclass multiple kernel learning; pp. 1191–1198. 2207. [Google Scholar]
Associated Data
This section collects any data citations, data availability statements, or supplementary materials included in this article.