

Abstract
OBJECTIVE
Individuals with type 2 diabetes exhibit higher DNA damage and increased risk of cardiovascular disease (CVD). However, mechanisms underlying the association between DNA damage and development of type 2 diabetes and CVD are not understood. We sought to link peroxisome proliferator-activated receptor-γ coactivator-1 α (PPARGC1A), a master transcriptional regulator of mitochondrial oxidative phosphorylation and cellular energy metabolism, with DNA damage, type 2 diabetes, and CVD.
RESEARCH DESIGN AND METHODS
We measured DNA damage as urinary 8-hydroxydeoxyguanosine (8-OHdG) concentration and examined the relationship between nine PPARGC1A genetic variants, DNA damage, type 2 diabetes, and self-reported CVD in 959 participants of the Boston Puerto Rican Health Study.
RESULTS
With respect to urinary 8-OHdG, PPARGC1A variants showed significant association, and PPARGC1A haplotypes exhibited significant association after correction for multiple testing. Two independent PPARGC1A variants associated significantly with type 2 diabetes (odds ratios [ORs] 1.35 and 2.46; P = 0.045 and <0.001). Carriers of minor alleles of two other PPARGC1A variants, both in strong linkage disequilibrium and associated with lower DNA damage, showed lower prevalence of CVD (ORs 0.53 and 0.65; P = 0.030 and 0.175). Moreover, we found that physical activity correlated negatively with DNA damage.
CONCLUSIONS
It is plausible that low physical activity combined with risk haplotyes contribute to the high prevalence of type 2 diabetes in this population. We propose that PPARGC1A influences development of type 2 diabetes and CVD via DNA damage. Increasing physical activity, which induces PPARGC1A expression, is a potential strategy to slow DNA damage, thereby decreasing the risk of CVD for individuals with type 2 diabetes.
Type 2 diabetes is a major risk factor for cardiovascular disease (CVD) and other age-related ailments and affects >200 million people worldwide (1). The prevalence of type 2 diabetes differs across regions and ethnicities, being higher in African-American, Asian, Native-American, and Hispanic populations. In addition to the classical disease biomark-ers, type 2 diabetes patients exhibit significantly elevated oxidative DNA damage, as measured by concentrations of 8-hydroxydeoxyguanosine (8-OHdG) or 8-hydrox-yguanosine (8-OHG) in leukocytes (2) or urine (3)— such that their use as biomarkers in the diagnosis of the disease has been considered (3). Mitochondria control both energy metabolism and reactive oxygen species (ROS) production (4–6), Thus, mitochondrial dysfunction may contribute to the development of type 2 diabetes (4). Furthermore, diabetic hamsters treated with inhibitors of advanced glycation end products (AGEs) showed reduced oxidative stress and restored pancreatic β-cell function (7). However, the mechanism underlying the development of type 2 diabetes, how that mechanism relates to DNA damage, and how type 2 diabetes increases the risk of CVD are not well understood.
Peroxisome proliferator-activated receptor-γ coactivator-1 α (PPARGC1A) has been identified as a master transcriptional regulator of a series of nuclear receptors, including hepatocyte nuclear factor 4α (HNF4A), PPARA, and PPARG, through which PPARGC1A controls mitochondrial function, oxidative phosphorylation, and cellular energy metabolism (8–10). PPARGC1A is expressed in a broad range of tissues and, together with PPARGC1B, exhibits enhanced expression in tissues with high oxidative capacity, such as heart, skeletal muscle, brown adipocyte (8–10), brain, and kidney. PPARGC1A expression can be induced by cold exposure in brown fat tissue (11, 12), by exercise in skeletal muscle (13–15), and by fasting in heart, and liver (8, 10). PPARGC1A and PPARGC1B expression is upregulated in response to oxidative stress (13). PPARGC1A is required for the regulation of the ROS defense system, including ROS-detoxifying enzymes glutathione peroxidase 1 (GPX1) and superoxide dismutase 2 (SOD2) (16). Upregulation of PPARGC1A expression can suppress the production of ROS. Individuals with type 2 diabetes exhibit decreased expression of PPARGC1A in skeletal muscle (17, 18). Furthermore, decreased PPARGC1A expression has been linked to reduced oxidative gene expression in this disease (18). Elderly adults show significantly lower PPARGC1A expression in skeletal muscle when compared with young adults (19). Several SNPs in PPARGC1A have been investigated for their relationship with diabetes (20–27). SNP G482S appears to be functional with 482S carriers having ~60% less PPARGC1A expression in skeletal muscle than noncarriers (19). Furthermore, this variant has been associated with type 2 diabetes (20,24,27).
Adult Puerto Ricans who live in the U.S. mainland have been identified as a vulnerable group at increased risk for age-related chronic diseases. Health disparities affecting a high percentage of this population include diabetes, depression, hypertension, and physical impairment (28,29). Thus, this population provides the opportunity to explore the correlation between PPARGC1A genitic variation and risk of age-related diseases. Therefore, we examined the relationship between PPARGC1A variants, DNA damage, type 2 diabetes, and self-reported CVD in adults, aged 45–75 years, participating in the Boston Puerto Rican Health Study.
RESEARCH DESIGN AND METHODS
The study population comprises 273 men and women who were self-identified Puerto Ricans living in the greater Boston metropolitan area and have full data records for demographic and biochemical characteristics, genotypes, and DNA damage. These subjects, aged 45–75 years, were recruited by investigators from the Boston Puerto Rican Center for Population Health and Health Disparities to participate in the Boston Puerto Rican Health Study, a longitudinal cohort study on stress, nutrition, health, and aging (online appendix [available at http://dx.doi.org/10.2337/db07-1238]) (28; http://hnrcwww.hnrc.tufts.edu/departments/labs/prchd/).
Data collection and variable definition
Information on sociodemographics, health status, history, and behavior was collected by home interview administered by billingual interviewers. CVD was defined as a positive response to the question “Have you ever been told by a physician that you had heart disease” or to similar questions on heart attack or stroke. Anthropometric and blood pressure measurements were collected using standard methods. Smoking and alcohol use were determined by questionnaire and defined for this analysis as current, past, or never smokers or drinkers.
Participants were instructed to provide a 12-h urine sample, which was retrieved at the home the following morning. Fasting blood samples were also drawn during this visit by a certified phlebotomist. Aliquots were saved and stored at −80°C until processed. Fasting plasma glucose was analyzed using standard procedures. C-reactive protein (CRP) was analyzed in serum, using an immunoturbidimetric reaction in a Cobas Fara II Centrifugal Analyzer with DiaSorin CRP SPQ test system antibody reagent set II (AM-0039;Atlantic Antibodies, Stillwater, MN)Using American Diabetes Association criteria, subjects were classified as having type 2 diabetes if fasting plasma glucose concentration was ≥126 mg/dl or use of insulin or diabetes medication was reported (30). Physical activity was estimated as physical activity score based on the Paffenbarger questionnaire of the Harvard Alumni Activity Survey (31). The physical activity score is constructed by weighting time spent in various activities by factors that parallel increasing oxygen consumption rates associated with physical activity intensity and is categorized as follows: 0–29, sedentary; 30–39, light activity; 40–49, moderate activity; and >50, heavy activity.
Urinary 8-OHdG DNA damage
Oxidative DNA damage and the whole-body repair of DNA were estimated (4) by measuring 8-OHdG in urine samples with a monoclonal antibody ELISA kit from Assays Designs (Ann Arbor, MI). Briefly, ~10 μl urine, which was collected from each subject after 12-h overnight period, was thawed after storage at −80°C and diluted 20-fold before analysis. Diluted urine samples were measured in duplicate with a standard provided by the vendor in a 96-well microplate format. Concentrations of urinary 8-OHdG were calculated by multiplying the measured concentration by the total volume of 12-h urine and then normalized against the total amount of creatinine in the urine.
PPARGC1A and SNP selection
The PPARGC1A gene maps to 4p15.1 on chromosome 4 and encompasses ~110 Kb, The overall rationate for SNP selection was to balance coverage, and cost with putative functional consequence of one allele against another. The nine SNPs selected for genotyping (Table 1) fall within different haplotype blocks using HapMap (http://www.hapmap.org) genotype data and TAGGER (32) with a pairwise linkage disequilibrium correlation coefficient of r2 = 0.80 and the minor allele frequency ≥0.05 in the CEU Utah residents with ancestry from northern and western Europe population. Additional information factored into selection of certain SNPs. SNPs m9722 is a tag SNP for one of largest haplotype blocks of the upstream region, The minor allele of SNP m1668 is predicted by PATCH (33) to abolish a PXR/RXR(NR112/RXRA) binding site. SNP i5378 is just 65 bp downstream of S74L, and both likely reside in the same haplotype block. SNPs G482S and T612M alter protein sequence and may alter structure/function of PPARGC1A protein, 3′-untranslated region SNP 3U4898 has the potential to alter mRNA structure and stability.
TABLE 1.
Characteristics of PPARGC1A SNPs genotyped in 959 subjects
| SNP name* | rs no. | HUGO name† | Distance from TSS (bp)‡ | Gene region | Minor allele frequency |
|---|---|---|---|---|---|
| m9722 | rs10030083 | NT_006316.15g0.14767780C>A | −9,722 | Upstream | 0.19 ± 0.01 |
| m1668 | rs2970869 | NT_006316.15g0.14568727G>A | −1,668 | Upstream | 0.26 ± 0.01 |
| i5378 | rs2946385 | NM_013261.3r0.234 + 52G>T | 5,378 | Intron 2 | 0.43 ± 0.02 |
| i15867 | Rs10028665 | NM_013261.3r0.234 + 10541C>T | 15,867 | Intron 2 | 0.16 ± 0.01 |
| i27289 | rs4235308 | NM_013261.3r0.2:34 + 21963A>G | 27,289 | Intron 2 | 0.39 ± 0.02 |
| i55301 | rs4697046 | NM_013261.3r0.235–3026A>G | 55,301 | Intron 2 | 0.37 ± 0.02 |
| G482S | rs8192678 | NP_037393.1p.Gly482Ser | 76,089 | Exon 8 | 0.29 ± 0.01 |
| T612M | rs3736265 | NP_037393.1p.Thr612Met | 76,994 | Exon 9 | 0.06 ± 0.01 |
| 3U4898 | rs3774923 | NM_013261.3r0.4778G>A | 96,637 | 3′-Untranslated region, exon 13 | 0.04 ± 0.01 |
Data are means ± SE.
m indicates a SNP is located in the promoter or upstream of the gene; i is in the intron; 3U is in the 3′-untranslated region; and others are substitution changes in exons.
HUGO names of SNPs are based on nomenclature recommendations of the Human Genome Variation Society (http:/www.hgvs.org/rec.html).
TSS, transcription start site.
DNA isolation and genotyping
Genomic DNA was isolated from buffy coats of the peripheral blood using QIAamp DNA Blood mini kit (Qiagen, Hilden, Germany) according to the vender’s recommended protocol SNPs were genotyped with Applied BiosystemsTaqMan SNP genotyping system (34). For all genotyping, blinded no-template controls and replicates of DNA samples were incorporated in each of the DNA sample plates, which were routinely checked by laboratory personnel. Based on our internal quality control and that estimated independently by external laboratories, the genotyping error rate was < 1%.
Statistical analysis
Statistical analyses were performed using SAS 9.1. (Cary. NC). Continuous dependent variables, such as 8-OHdG and plasma glucose concentrations, that were not normally distributed were Box-Cox transformed (35) to achieve normality before fitting statistical models. We assessed the relationship between PPARGC1A variants, urinary 8-OhdG, and plasma glucose concentrations by covariance analysis. For type 2 diabetes and CVD, we used logistic regression. With a rare minor allele, homozygotes and heterozygotes were combined to increase statistical power. In these analyses, the dependent variables were DNA damage. plasma glucose concentration, type 2 diabetes, and CVD status. Independent variables were genotypes of the individual PPARGC1A SNPs. Analyses were adjusted for potential confounders (age, sex, BMI, smoking, alcohol intake, physical activity, and medication use) using a linear logistic regression model. All analyses were further adjusted for population admixture estimated using the program STRUCTURE 2.2 (see below), Men and women were analyzed together, as well as separately, to examine sex-specific effects, P values ≤0.05 were considered statistically significant.
Linkage disequilibrium and haplotype analysis
Pairwise linkage disequilibria among all nine SNPs were estimated as correlation coefficients using the HelixTree program (GOLDEN Helix, Bozeman, MN). For haplotype analysis, we estimated haplotype frequencies using the expectation-maximization algorithm (36) for a subset of SNPs selected on the basis of individual association with a given trait. To determine the association between haplotypes and phenotypes, we used haplotype trend regression analysis with the option of composite haplotype estimation implemented in Helix Tree (37). Analyses were adjusted for potential confounders and population admixture (see below). P values were further adjusted for multiple tests by a permutation test. A stepwise regression analysis was conducted to further identify the most prominent haplotype associated with phenotypes.
Population admixture
Population admixture was calculated using STRUCTURE 2.2, an extension of an earlier method, based on Bayesian clustering, using a Markov chain Monte Carlo algorithm (38). This new method enables estimation of population admixture using linked markers. We estimated population admixture based on 96 SNPs, with minor allele frequencies >0.05 or <0.95, representing 35 genes located on 15 different chromosomes (for details, see the online appendix).
RESULTS
Characteristics of participants
The percentage of individuals who reported smoking or drinking alcohol was significantly higher in men than women (P < 0.001 for both; Table 2). In contrast, BMI (or the percentage of participants who were obese [BMI ≥30]) and CRP levels were significantly higher in women than men (P < 0.001 for both). Other demographic and biochemical characteristics did not differ significantly by sex.
TABLE 2.
Characteristics of participants according to sex
| Men | Women | |
|---|---|---|
| n | 273 | 686 |
| Age (years) | 57.4 ± 7.7(42–75) | 58.0 ± 7.2 (44–75) |
| BMI (kg/m2)* | 29.8 ± 5.3 (18.5–48.6) | 33.2 ±7.3 (17.0–74.2) |
| Obesity* | 85 (31.1) | 299 (43.7) |
| Glucose (mg/dl) | 125 ± 55 (70.0–372) | 122 ± 53 (47.0–587) |
| CRP (mg/l)* | 5.05 ± 10.7(0.10–127) | 6.66 ± 7.8 (0.00–69.8) |
| Physical activity score | 32.7 ±6.4(25.1–66.0) | 31.2 ± 4.3 (24.8–68.7) |
| Drinkers* | 137 (50.7) | 277 (33.2) |
| Smokers* | 86 (32.0) | 133 (19.6) |
| Diabetes | 108 (39.6) | 278 (40.5) |
| Cardiovascular diseases | 67 (24.5) | 147(21.4) |
| On diabetes drug | 88 (32.2) | 228 (33.2) |
| On cardiovascular diseases drug | 53(19.4) | 101(14.7) |
| On depression drug | 84 (30.8) | 347 (50.6) |
Data are means ± SD (range) or n (%).
Statistical significance at P < 0.05. n, sample size.
Minor allele frequencies and pairwise linkage disequilibrium in correlation coefficients (r2) of all nine SNPs are presented in Table 1 and Fig. 1. The frequencies of minor alleles of the selected nine SNPs ranged from 0.04 to 0.43. No significant difference in genotype frequency was observed between men and women. All SNPs at PPARGC1A were in Hardy-Weinberg equilibrium. SNPs T612M and 3U4898 were in strong linkage disequilibrium (r2 = 0.82), whereas i55301 and G482S (r2 = 0.49), i5378 and i15867 (r = 0.35), i55301 and T612M (r2 = 0.33), m9722 and m1668 (r2 = 0.28), i5378 and i27289 (r2 = 0.27), and m1668 and i15867 (r2 = 0.25) exhibited intermediate linkage disequilibrium. Other SNPs showed weak or no linkage disequilibrium (r2 < 0.1). Because all pairwise linkage disequilibria were <0.85, all nine SNPs were retained for further analysis.
Fig. 1.
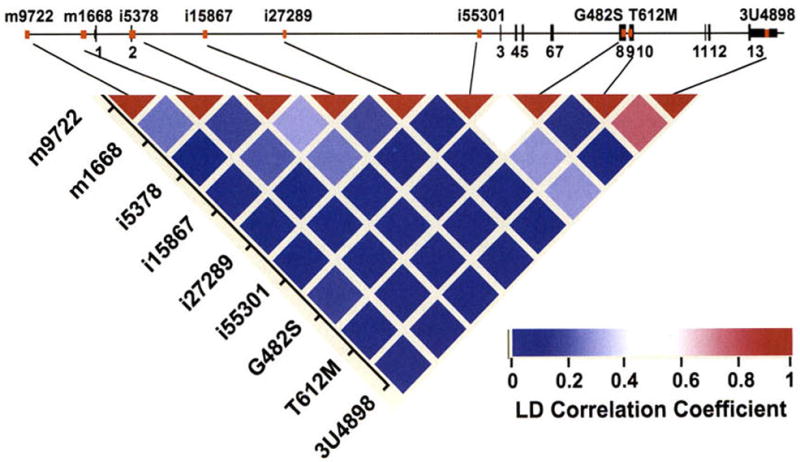
PPARGC1A (or PGC-1α) genomic structure and pairwise linkage disequilibrium estimation. Top: Exon/intron organization of the 120-kb genomic region of PPARGC1A. The 13 exons are numbered and represented by black bars. Commonly studied SNPs of PPARGC1A, including those described in this study, are represented by red bars. Bottom: Pairwise linkage disequilibrium was estimated as the correlation coefficient (r2), the strength of which is indicated by the color scale: red, absolute linkage disequilibrium; white, intermediate; and blue, lack of any linkage.
Association between DNA damage and nongenetic factors and disease states
Women had significantly higher levels of DNA damage than men (150 vs. 138 ng/μg, P = 0.009). Current smokers tended to have higher DNA damage than past smokers or nonsmokers (156 vs, 139 ng/μg; P = 0.004; Fig. 2A). In addition, higher physical activity (score >30) was associated with less DNA damage (142 vs. 154 ng/μg; P = 0.019; Fig. 2B) after adjustment for diabetes, hypertension, BMI, CVD, and depression medication. This was further supported by a negative correlation between physical activity and DNA damage (r = −0.12, P < 0.001). However, age and alcohol use were not correlated with 8-OHdG concentrations (data not shown).
Fig. 2.
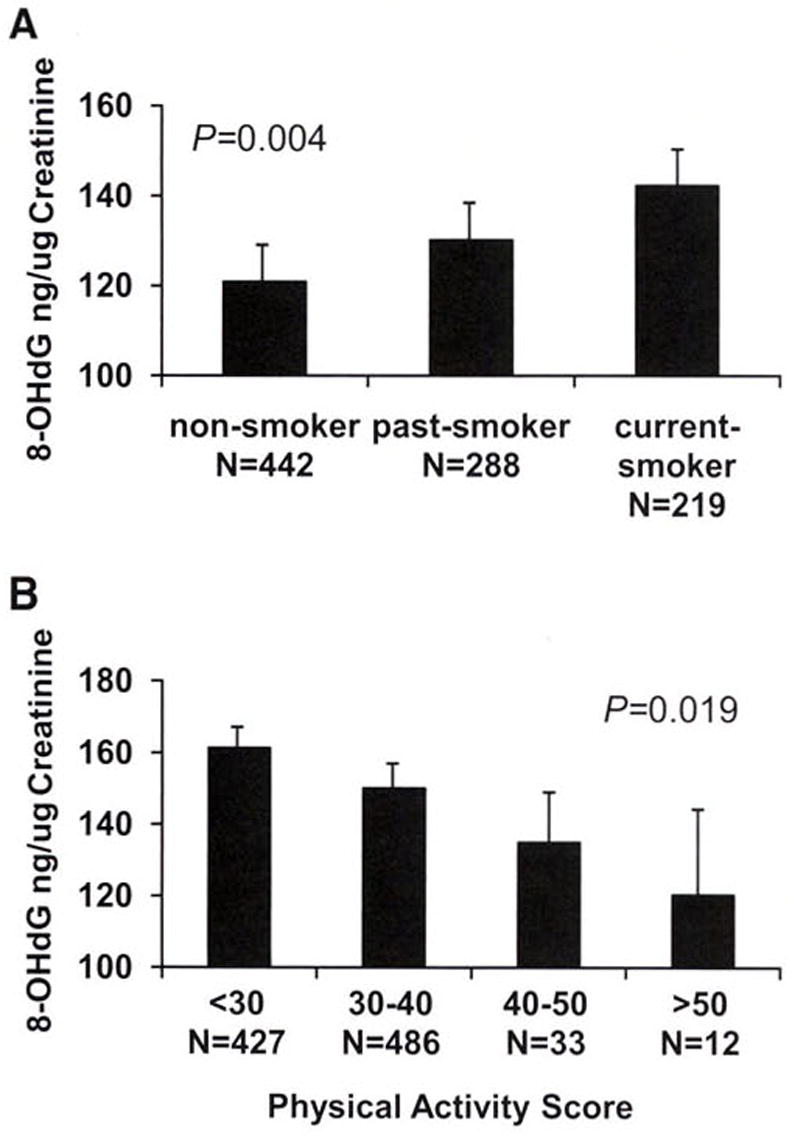
A: DNA damage 8-OHdG concentrations were plotted according to smoking status. P values were calculated using linear regression models with adjustment for age, sex, BMI, diabetes, hypertension, heart disease, and medication use. B: DNA damage 8-OHdG concentrations were plotted by physical activity scores in four groups: 0–29, sedentary; 30–39, light activity; 40–49, moderate activity; and >50, heavy activity. P values were calculated using linear regression models with adjustment for age, sex, BMI, diabetes, hypertension, heart disease, and medication use.
We next examined whether subjects of different disease status showed altered concentrations of 8-OHdG. Subjects who reported CVD, including stroke, heart attack, and other heart disease, had significantly higher concentrations of DNA damage (156 vs. 144 ng/μg; P = 0.035; data not shown). Individuals with type 2 diabetes tended to have more DNA damage than those without diabetes (152 vs. 143 ng/μg), although this was not statistically significant (P = 0.100). Likewise, DNA damage correlated significantly with plasma glucose concentration (r = 0.09, P = 0.004, n = 959), especially in subjects with diabetes but not on diabetes medication (r = 0.50, P = 0.003, n = 31). In addition, taking depression medication is significantly associated with increased DNA damage (data not shown).
Association between PPARGC1A variation and DNA damage
SNP m1668, located in the promoter region, showed significant association with 8-OHdG concentration (P = 0.010; Table 3). Carriers of the m1668A allele had significantly more DNA damage than noncarriers (172 vs. 159 ng/μg). In addition, homozygous subjects (AA) of the i55301A allele also had significantly higher urinary 8-OHdG concentration (P = 0.012) than G carriers (AG and GG). Furthermore, SNP 3U4898 showed significant association with DNA damage: carriers (AA+AG) of the minor allele 3U4898A had low 8-OHdG concentration (P = 0.030). In strong linkage disequilibrium with SNP 3U4898 and 19.6 kb upstream, SNP T612M exhibited a similar association with 8-OHdG concentration; i.e., carriers (AA+AG) of the minor T612M A allele tended to have lower 8-OHdG concentrations (156 vs. 168 ng/μg) than homozygotes (GG), although this was not statistically significant (P = 0.114). However, there were no significant interactions between genotypes and type 2 diabetes or CVD on DNA damage.
TABLE 3.
DNA damage 8-OHdG according to PPARGC1A genotypes
| Genotype | n | Damage (ng/μg) | P value | Adjusted P value* | |
|---|---|---|---|---|---|
| m9722 | AA + AC | 309 | 164.8 ± 6.8 | 0.756 | 0.705 |
| CC | 622 | 167.0 ± 5.9 | |||
| m1668 | AA + AG | 427 | 172.1 ±6.1 | 0.010 | 0.008 |
| GG | 506 | 159.0 ± 6.3 | |||
| i5378 | GG | 320 | 167.0 ± 6.5 | 0.850 | 0.829 |
| GT | 423 | 164.8 ± 6.4 | |||
| TT | 192 | 168.0 ± 7.5 | |||
| i15867 | CC | 669 | 166.6 ± 5.9 | 0.123 | 0.104 |
| CT + TT | 272 | 159.2 ± 6.9 | |||
| i27289 | AA | 356 | 164.3 ± 6.6 | 0.739 | 0.704 |
| AG | 437 | 167.1 ± 6.2 | |||
| GG | 147 | 165.1 ± 7.8 | |||
| i55301 | AA | 355 | 173.0 ± 6.3 | 0.012 | 0.014 |
| AG + GG | 581 | 160.0 ± 6.0 | |||
| G482S | CC | 473 | 163.1 ± 6.4 | 0.103 | 0.109 |
| CT | 384 | 168.7 ± 6.5 | |||
| TT | 77 | 181.9 ± 9.7 | |||
| T612M | AA + AG | 112 | 156.4 ± 8.6 | 0.114 | 0.138 |
| GG | 826 | 167.5 ± 5.8 | |||
| 3U4898 | AA + AG | 79 | 150.9 ± 9.6 | 0.030 | 0.034 |
| GG | 866 | 167.9 ± 5.8 |
Data are means ± SE. All means and P values calculated by ANCOVA using general linear models and adjusted for age, sex, BMI, smoking, alcohol use, physical activity, depression medication, and population admixture. n, sample size.
P values were calculated adjusted for additional covariates: type 2 diabetes and CVD.
Association between PPARGC1A variation and plasma glucose and glycosyiated hemoglobin concentrations
Plasma glucose was highly correlated with DNA damage, especially among subjects with untreated type 2 diabetes. After adjustment for smoking, ago, BMI, sex, physical activity, depression medications, and population admixture, only SNP i5378 showed a significant association with plasma glucose concentration (P = 0.023). However, the fasting plasma glucose or subjects with type 2 diabetes and using diabetes medications may not reflect biological concentrations, Thus, we analyzed the data by dividing subjects into two groups: diabetes medication users and nonusers. Among nonmedication users, we found that four SNPs (m9722, m1668, i15867, and i55301) showed significant association with glucose concentration (Supplemental Table 1). For glycosylated hemoglobin (A1C; Supplemental Table 2), SNPs m9722 and i15867 showed significant association (P = 0.002 and 0.021, respectively) with A1C among subjects not using diabetes medication.
Correlation between PPARGC1A variation and type 2 diabetes and CVD
Homozygotes of the minor allele i5378G had a ~2.5-fold increased likelihood of type 2 diabetes (OR 2.46; P < 0.001) than noncarriers (TT), whereas heterozygotes had a 69% greater likelihood relative to noncarriers (1.69), In addition, homozygous subjects (AA) of the major allele i27289A also had significantly greater likelihood of having type 2 diabetes (1.35; P = 0.045) than those with genotype AG or GG. Other SNPs showed no significant association with type 2 diabetes (Supplemental Table 3).
Because CVD was associated with DNA damage, we examined whether subjects with different PPARGC1A genotypes exhibited differential CVD prevalence. Carriers of the minor alleles for either T612M or 3U4898 (both in strong linkage disequilibrium) showed 50% lower likelihood of self-reported CVD (OR 0.53 and 0.65, P = 0.030 and 0.175, respectively), whereas no significant association was observed for other SNPs (Supplemental Table 4).
Haplotype analysis
To understand the combined effects of multiple variants at PPARGC1A, we conducted haplotype analysis using a subset of PPARGCIA SNPs. Although the best method among proposed strategies to select SNPs for haplotype analysis is debatable (39), the major goal was to explore the interaction among variants and to increase the power to detect associations between genotypes and phenotypes. In this regard, we selected SNPs according to their association with the phenotypes as individual variants. Based on the above analyses and simulation of haplotype association, we only included SNPs for haplotype analysis that showed significant or marginally significant (P < 0.2) association with phenotypes to ensure reasonable statistical power.
For DNA damage, six of the nine SNPs (P < 0.2) met this criterion: m1668, i15867, i55301, G482S, T612M, and 3U4898 (Table 3). There are 12 haplotypes with frequencies ranging from 1 to 21%, accounting for 99% of all haplotypes in this population (Table 4). After adjustment for covariates, haplotype trend regression analysis showed that PPARGC1A haplotypes were significantly associated with DNA damage (global significance, P = 0.007). Based on a permutation test, the probability for observing such an association is 0.009 under a null hypothesis. For individual haplotypes, carriers of the haplotype G-T-A-C-G-G showed significantly less DNA damage (β = −2.54, P = 0.027), whereas carriers of A-C-A-C-G-G, A-C-G-T-G-G, and G-T-A-T-G-G exhibited significantly more DNA damage (β = 1.91, 5.17, and 2.36 and P = 0.032, 0.042, 0.020, respectively; Table 4). We further conducted stepwise regression analysis to identify the most prominent haplotypes associated with DNA damage. Haplotype G-T-A-C-G-G exhibited the lowest level of DNA damage (β = −2.66, P = 0.005).
TABLE 4.
Association between PPARGC1A haplotypes and urinary 8-OHdG levels
| Haplotype* | Frequency† | Coefficient β‡ | SE‡ | P value‡ |
|---|---|---|---|---|
| G-T-G-C-G-G | 0.04 | 0.00 | 1.42 | 0.998 |
| A-C-A-C-G-G | 0.08 | 1.91 | 0.89 | 0.032 |
| A-C-A-T-G-G | 0.08 | −0.07 | 0.93 | 0.941 |
| A-C-G-C-G-G | 0.08 | −0.08 | 0.93 | 0.034 |
| A-C-G-T-G-G | 0.01 | 5.17 | 2.54 | 0.042 |
| G-C-A-C-G-G | 0.21 | 0.75 | 0.58 | 0.199 |
| G-C-A-T-G-G | 0.14 | 0.69 | 0.70 | 0.324 |
| G-C-G-C-A-G | 0.02 | −0.05 | 2.33 | 0.983 |
| G-C-G-C-G-G | 0.19 | 0.15 | 0.63 | 0.820 |
| G-C-G-T-G-G | 0.03 | −2.90 | 1.98 | 0.144 |
| G-T-A-C-G-G | 0.05 | −2.54 | 1.14 | 0.027 |
| G-T-A-T-G-G | 0.06 | 2.36 | 1.01 | 0.020 |
The six SNPs in haplotypes were arranged in the order of m1668, i15867, i55301, G482S, T612M, and 3U4898.
Haplotype frequencies were estimated using the expectation-maximization algorithm (36).
Coefficients, SE, and P values were estimated based on haplotype trend regression analysis implemented in HelixTree program while adjusted for the same set of covariates as in Table 3. These haplotypes showed global association with DNA damage at P = 0.009 after permutation correction for multiple tests.
Two SNPs, i5378 and i27289, with respective P values of <0.001 and 0.045 for individual association with type 2 diabetes, were selected for haplotype analysis. The four haplotypes had frequencies ranging from 16 to 41% (Table 5). These haplotypes showed significant association with type 2 diabetes after permutation correction (global significance, P = 0.002). Carriers of the haplotype G-A showed the greater association with type 2 diabetes, with a ~2.5-fold greater likelihood relative to noncarriers (P = 0.001).
TABLE 5.
Association between PPARGC1A haplotypes and type 2 diabetes
| Haplotype* | Frequency† | Coefficient β‡ | OR‡ | P value‡ |
|---|---|---|---|---|
| G-A | 0.41 | 0.898 | 2.45 | 0.001 |
| G-G | 0.16 | 0.823 | 2.28 | 0.046 |
| T-A | 0.20 | 0.054 | 1.06 | 0.891 |
| {T-G} | 0.23 |
The two SNPs in haplotypes were arranged in the order of i5378 and i27289.
Haplotype frequencies were estimated using the expectation-maximization algorithm (36).
Coefficients, OR, and P values were estimated based on haplotype trend regression analysis with logistic regression option implemented in HelixTree program after adjustment for the same set of covariates as in Table 3. These haplotypes showed global association with type 2 diabetes at P = 0.002 alter permutation correction for multiple tests.
We selected four SNPs—m9722, m1688, T612M, and 3U4898—for haplotype analysis in relation to CVD. There are three major haplotypes (C-G-G-G, C-A-G-G, and A-G-G-G; data not shown) with frequencies of 0.52, 0.24, and 0.18, respectively, accounting for 94% of all haplotypes in this population. Three other haplotypes (A-A-G-G, C-G-A-A, and C-G-A-G; data not shown), each with a frequency of 0.02, represent 6% of all haplotypes. All six haplotypes showed a globally significant association with CVD after permutation correction (P = 0.038; data not shown). The haplotype A-G-G-G, representing 18% of the population, correlated significantly with increased risk of CVD (OR 8.30; P = 0.006). This haplotype represents the most prominent haplotype associated with increased risk for CVD (2,16; P = 0.014) based on stepwise regression analysis.
DISCUSSION
Adult Puerto Ricans who live in the Boston metropolitan area disproportionately bear a number of health problems, including diabetes, obesity, hypertension, stress, and decline in cognitive function (28,29). Such disparities can be attributed to lifestyle, dietary intake, and genetic variation, Here, we measured urinary 8-OHdG concentration as a biomarker of DNA damage. Results showed that DNA damage was substantial in this population and was influenced by smoking, physical activity, sex, and disease status. Current smokers exhibited greater DNA damage than nonsmokers or past smokers. Physical activity was negatively correlated with DNA damage after adjustment for disease status. Average physical activity (31) was low in this population (mean physical score = 31.6 ± 5). Low physical activity could be an important environmental factor contributing to health disparities in this population.
An examination of the relationships between genetic variants at the PPARGC1A locus and DNA damage, type 2 diabetes, and self-reported CVD was undertaken to ascertain biological plausibility. We identified three SNPs at the PPARGC1A locus showing significant association with DNA damage, although none individually passed the Bonferroni correction test (P = 0.006), However, haplotypes consisting of six SNPs at this locus did exhibit significant association with DNA damage after permutation test correction for multiple testing. Considering the limited population size (n = 959) and the overconservative nature of the Bonferroni correction, we believe correct ion for multiple testing in the haplotype analysis by permutation is appropriate. In addition, PPARGC1A SNPs and haplotypes were significantly associated with type 2 diabetes and CVD, It is well established that a hyperglycemio state can lead to an increase in superoxide production in mitochondria due to attenuation of electron transfer within complex III as the voltage gradient reaches its threshold (40,41). Overproduction of superoxide results in mitochondrial DNA (mtDNA) damage. Thus, DNA damage may be the by-product of type 2 diabetes. Conversely, we speculate that DNA damage could stimulate the development of type 2 diabetes (Fig. 3).
FIG. 3.
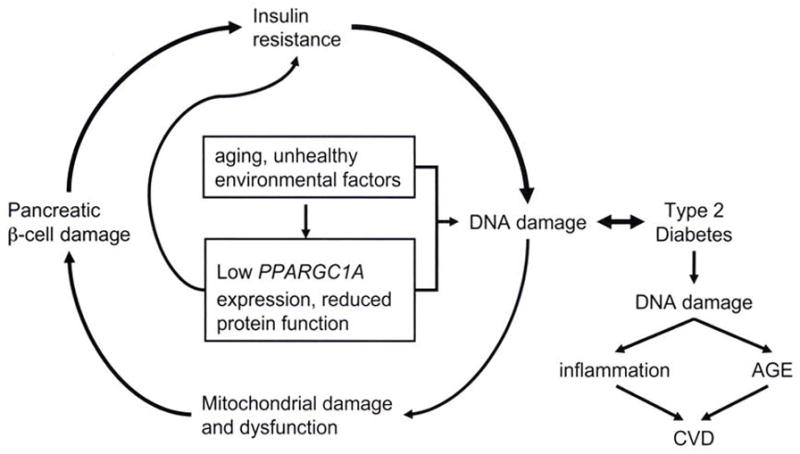
Cycle of DNA damage and type 2 diabetes, Aging and unhealthy environmental and genetic factors initiate DNA damage, which leads to damage of mitochondria, pancreatic β-cells, insulin resistance, hyperglycemia, and further DNA damage. Reduced expression of the PPARGC1A gene or function of the encoded protein is also linked to greater DNA damage. Eventually, repeated cycling through this process may result in type 2 diabetes, which produces greater damage of mtDMA. This can be the cause of inflammation and induction of AGE, leading to CVD.
PPARGC1A has a dual role in regulating mitochondrial oxidative phosphorylation (16). First, PPARGC1A regulates glucose metabolism and mitochondrial electron transport, providing energy to the cell while generating ROS. Second, PPARGC1A is required to activate ROS-defending enzymes, such as SOD1, GPX1, uncoupling protein 2, and catalase, for the clearance of ROS (16). Balance between these two roles of PPARGC1A ensures energy homeostasis without oxidative damage to the mitochondria. An imbalance, however, which could be triggered by environmental factors, including dietary intake (i.e., hyperglycemia) and lack of physical activity (i.e., reduced PPARGC1A expression), can damage mtDNA, leading to mitochondrial malfunction followed by cell apoptosis (4,8,41). This process can occur both in skeletal muscle and in pancreatic β-cells. As individuals age, those who carry the dysfunctional variant of PPARGC1A would not maintain metabolic homeostasis of glucose. This hypothesis is supported by the observation that mitochondrial malfunction or damage leads to apoptosis of pancreatic β-cells (4,41), which, in turn, affects insulin regulation and homeostasis. Individuals then enter a cycle of increasing damage to mtDNA in skeletal muscle cells and pancreatic β-cells, which is augmented by low-performing variants of PPARGC1A. mtDNA damage and dysfunction in muscle and pancreatic β-cells ultimately leads to insulin resistance and eventual development of type 2 diabetes (4,41). Thus, in this population, low physical activity combined with genetic risk factors present one possible explanation for the high prevalence of type 2 diabetes. The cycle by which low activity of the PPARGC1A gene or protein promotes DNA damage and ultimately type 2 diabetes is modeled in Fig. 3.
A remaining question is, why arc SNPs i5378 and i27289 strongly associated with type 2 diabetes but not with DNA damage (Table 3)? Type 2 diabetes is prevalent in this population (42%), and most individuals with diabetes were under treatment to control plasma glucose. Therapy may disrupt the correlation between DNA damage, measured by 8-OHdG, and type 2 diabetes. This is supported by evidence that insulin treatment normalized plasma and tissue 8-OHdG concentrations in streptozotocin-induced diabetic APA rats (42). Here, we report a moderate correlation (r = 0.09, r = 0.004) between glucose and DNA damage in the whole population. However, among untreated individuals with type 2 diabetes, the correlation was strong (r = 0.50, P = 0.003) relative to those undergoing treatment (r = 0.08, P = 0.112). Furthermore, no significant, difference in plasma glucose concentration was observed between genotypes of SNPs i5378 and i27289 after adjustment for diabetes medication, suggesting that drug treatment weakens the correlation between DNA damage and i5378 and i27289 genotypes in this population as the associated phenotypes were targeted for treatment. Alternatively, urinary measures of 8-OHdG reflect, the repair of ROS-induced DNA damage, and the DNA damage associated with SNPs i5378 and i27289 may not be detected in urine but could be detected in tissues (e.g., pancreatic β-cells).
An alternate hypothesis is that each SNP alters PPARGC1A gene or protein activity in a manner that affects only a subset of the multiple processes this protein regulates, namely, oxidative phosphorylation, cellular energy metabolism, and the ROS defense system. Given this notion, the consequences of a SNP are observed only for certain functions of PPARGC1A and not for others. This assumes that there are function-specific domains to the PPARGC1A gene and that certain SNPs that alter transcription factor binding sites (affecting gene expression), exon-intron splicing (alternative mRNA splicing), or protein function reside in such domains. Thus, variants i5378 and i27289, which are associated with glucose homeostasis and increased likelihood of type 2 diabetes, would do so through different processes that are independent of DNA damage.
Subjects with type 2 diabetes have increased CVD risk (43,44), but our understanding of the underlying mechanism is incomplete. In this report, we observed that carriers of the minor alleles of T612M and 3U4898, which are in strong linkage disequilibrium, tend to have lower levels of both DNA damage and CRP (P = 0.012 and 0.175, respectively; data not shown). These carriers also had lower prevalence of CVD, Conversely, subjects carrying the haplotype (A-G-G-G) representing the major alleles of T612M and 3U4898 showed significantly higher prevalence of CVD. This observation suggests that type 2 diabetes may contribute to CVD through the process of DNA damage (see Fig. 3). Hyperglycemia can cause DNA damage because of overproduction of superoxide by the mitochondrial electron transport chain (40, 41). The imbalanced superoxide can also activate intracellular production of AGE precursors (41), leading to inflammation arid increased plasma CRP. In addition, DNA damage may lead to injury in the endothelium and induce inflammation and, subsequently, the development of atherosclerosis (45). Monocytes from subjects with diabetes have elevated oxidative stress, inflammation response (46), and binding to endothelium compared with cells from individuals without diabetes (47,48). Furthermore, human atherosclerotic plaques showed high levels of DNA damage (49). In this study, among the subjects not using diabetes medication, both carriers and noncarriers of the minor alleles of T612M and 3U4898 have a normal range of glucose and A1C levels. However, among Type 2 diabetic patients using diabetes medication, the carriers have significantly lower glucose and A1C levels than the noncarriers (Supplemental Tables 1 and 2). This observation suggests that the carriers of the minor alleles of T612M ami 3U4898 have better control of glucose concentrations when in a hyperglycemic state, with concomitant reduction in DNA damage, leading to less inflammation (lower CRP) and thus lower prevalence of CVD. Exercise can increase expression of PPARGC1A in skeletal muscle of subjects with type 2 diabetes (14,50). We found that physical activity correlated with lower DNA damage. Although the current study is limited in size and has only self-reported CVD, the pattern of results suggests that increasing expression of PPARGC1A by exercise may be a strategy to reduce the risk of CVD in individuals with type 2 diabetes.
Acknowledgments
This study has received the National Institutes of Health (NIH), National Institute on Aging Grant. 5P01-AG-023394-02, NIH/National Heart, Lung, and Blood Institute Grant HL54776, and U.S. Department of Agriculture Research Service Contracts 53-K06-5-10 and 58-1950-9-001.
We thank three anonymous reviewers for corrections and suggestions to improve the manuscript.
- 8-OHdG
8-hydroxydeoxyguanosine
- 8-OHG
8-hydroxyguanosine
- AGE
advanced glycation end product
- CRP
C-reactive protein
- CVD
cardiovascular disease
- GPX1
glutathione peroxidase 1
- HNF4A
hepatocyte nuclear factor 4α
- mtDNA
mitochondrial DNA
- NIH
National Institutes of Health
- PPARGC1A
peroxisome proliferator-activated receptor-γ coactivator-1 α
- ROS
reactive oxygen species
- SNP
single nucleotide polymorphism
- SOD2
superoxide dismutase 2
Footnotes
Additional information for this article can be found in an online appendix at http://dx.doi.org/10.2337/db07-1238.
Published ahead of print at http://diabetes.diabetesjournals.org on 30 January 2008. DOI:10.2337/db07-1238
References
- 1.Zimniei P. Globalization, coca-colonization and the chronic disease epidemic: can the Doomsday scenario be averted? J Interm Med. 2000;247:301–310. doi: 10.1046/j.1365-2796.2000.00625.x. [DOI] [PubMed] [Google Scholar]
- 2.Dardona P, Thusu K, Cook S, Snyder B, Makowski J, Armstrong D, Nicotera T. Oxidative damage to DNA in diabetes mellitus. Lancet. 1996;347:444–445. doi: 10.1016/s0140-6736(96)90013-6. [DOI] [PubMed] [Google Scholar]
- 3.Shigenaga MK, Gimeno CJ, Ames BN. Urinary 8-hydroxy-2′-deoxyguanosine as a biological marker of in vivo oxidative DNA damage. Proc Natl Acad USA. 1989;86:9697–9701. doi: 10.1073/pnas.86.24.9697. [DOI] [PMC free article] [PubMed] [Google Scholar]
- 4.Lowell BB, Shulman GI. Mitochondrial dysfunction and type 2 diabetes. Science. 2005;307:384–387. doi: 10.1126/science.1104343. [DOI] [PubMed] [Google Scholar]
- 5.Lenaz G, Bovina C, D’ Aurelioin M, Fato R, Formiggini G, Genova ML, Giuliano G, Merlo Pich M, Paolucci U, Parenti Castelli G, Ventura B. Role of mitochondria in oxidative stress aging. Ann N Y Acad Sci. 2002;959:199–213. doi: 10.1111/j.1749-6632.2002.tb02094.x. [DOI] [PubMed] [Google Scholar]
- 6.Miwa S, Brand MD. Mitochondrial matrix reactive oxygen species production is very sensitive to mild uncoupling. Biochem Soc Trans. 2003;31:1300–1301. doi: 10.1042/bst0311300. [DOI] [PubMed] [Google Scholar]
- 7.Takatori A, Ishii Y, Itagaki SI, Kyuwa S, Yoshikawa Y. Amelioration of the β-cell dysfunction in diabetic APA hamsters by antioxidants and AGE inhibitor treatment. Diabete Metab Res Rev. 2004;20:211–218. doi: 10.1002/dmrr.428. [DOI] [PubMed] [Google Scholar]
- 8.Lin J, Handschin C, Spiegelman BM. Metabolic control through the PGC-1 family of transcription coactivators. Cell Metad. 2005;1:361–370. doi: 10.1016/j.cmet.2005.05.004. [DOI] [PubMed] [Google Scholar]
- 9.Handschin C, Spiegelman BM. Peroxisome-proliferator-activated receptor coactivator 1 coactivators, energy homeostasis, and metabolism. Endocr Rev. 2006;27:728–735. doi: 10.1210/er.2006-0037. [DOI] [PubMed] [Google Scholar]
- 10.Finck BN, Kelly DP. PGC-1 coactivators: inducible regulators of energy metabolism in health and disease. J Clin Invest. 2006;116:615–622. doi: 10.1172/JCI27794. [DOI] [PMC free article] [PubMed] [Google Scholar]
- 11.Puigserver P, Wu Z, Park CW, Graves R, Wright M, Spiegelman BM. A cold-inducible coactivator of nuclear receptors linked to adaptive thermogenesis. Cell. 1998;92:829–839. doi: 10.1016/s0092-8674(00)81410-5. [DOI] [PubMed] [Google Scholar]
- 12.Wu Z, Puigserver P, Andersson U, Zhang C, Adelmant G, Mootha V, Troy A, Cinti S, Lowell B, Scarpulla RC, Spiegelman BM. Mechanisms controlling mitochondrial biogenesis and respiration through the thermogenic coactivator PGC-1. Cell. 1999;98:115–124. doi: 10.1016/S0092-8674(00)80611-X. [DOI] [PubMed] [Google Scholar]
- 13.St-Pierre J, Lin J, Krauss S, Tarr PT, Yang R, Newgard CB, Spiegelman BM. Bioenergetie analysis of peroxisome proliferators activated receptor gamma coactivators 1alpha and 1beta (PGC-1alpha and PGC-1beta) in muscle cells. J Biol Chem. 2003;278:26597–26603. doi: 10.1074/jbc.M301850200. [DOI] [PubMed] [Google Scholar]
- 14.Pilegaard H, Saltin B, Neufer PD. Exercise induces transient transcriptional activation of the PGC-1alpha gene in human skeletal muscle. J Physiol. 2003;546:851–858. doi: 10.1113/jphysiol.2002.034850. [DOI] [PMC free article] [PubMed] [Google Scholar]
- 15.Norrbom J, Sundberg CJ, Ameln H, Kraus WE, Jansson E, Gustafsson T. PGC-1α mRNA expression is influenced by metabolic perturbation in exercising human skeletal muscle. J Appl Physiol. 2004;96:189–194. doi: 10.1152/japplphysiol.00765.2003. [DOI] [PubMed] [Google Scholar]
- 16.St-Pierre J, Drori S, Uldry M, Silvaggi JM, Rhee J, Jager S, Handschin C, Zheng K, Lin J, Yang W, Simon DK, Bachoo R, Spiegelman BM. Suppression of reactive oxygen species and neurodegeneration by the PGC-1 transcriptional coactivators. Cell. 2006;127:397–408. doi: 10.1016/j.cell.2006.09.024. [DOI] [PubMed] [Google Scholar]
- 17.Mootha VK, Lindgren CM, Eriksson KF, Subramanian A, Sihag S, Lehar J, Puigserver P, Carlsson E, Ridderstrale M, Laurila E, Houstis N, Daly MJ, Patterson N, Mesirov JP, Golub TR, Tamayo P, Spiegelman B, Lander ES, Hirschhorn JN, Altshuler D, Groop LC. PGC-1alpha-responsive genes involved in oxidative phosphorylation are coordinately downregulated in human diabetes. Nat Genet. 2003;34:267–273. doi: 10.1038/ng1180. [DOI] [PubMed] [Google Scholar]
- 18.Franks PW, Loos RJ. PGC-1alpha gene and physical activity in type 2 diabetes mellitus. Exerc Sport Sci Rev. 2006;34:171–175. doi: 10.1249/01.jes.0000240021.92254.23. [DOI] [PubMed] [Google Scholar]
- 19.Ling C, Poulsen P, Carlsson E, Ridderstråie M, Almgren P, Wojtaszewski J, Beck-Nielsen H, Groop L, Vaag A. Multiple environmental and genetic factors influence skeletal muscle PGC-1α and PGC-1β gene expression in twins. J Clin Invest. 2004;114:518–1526. doi: 10.1172/JCI21889. [DOI] [PMC free article] [PubMed] [Google Scholar]
- 20.Ek J, Andersen G, Urhammer SA, Gæde PH, Drivsholm T, Borch-Johnsen K, Hansen T, Pedersen O. Mutation analysis of peroxisome proliferators activated receptor-α coactivator-1 (PGC-1) and relationships of identified amino acid polymorphisms to type II diabetes mellitus. Diabetologia. 2001;44:2220–2226. doi: 10.1007/s001250100032. [DOI] [PubMed] [Google Scholar]
- 21.Hara KK, Tobe K, Okada T, Kadowaki H, Akanuma Y, Ito C, Kimura S, Kadowaki T. A genetic variation in the PGC-1 gene could confer insulin resistance and susceptibilily to type II diabetes. Diabetologia. 2002;45:740–743. doi: 10.1007/s00125-002-0803-z. [DOI] [PubMed] [Google Scholar]
- 22.Barroso I, Luan J, Middelberg RP, Harding AH, Franks PW, Jakes RW, Clayton D, Schafer AJ, O’Rahilly S, Wareham NJ. Candidate gene association study in type 2 diabetes indicates a role for genes involved in beta-cell function as well as insulin action. PLoS Biol. 2003;1:41–55. doi: 10.1371/journal.pbio.0000020. [DOI] [PMC free article] [PubMed] [Google Scholar]
- 23.Oberkofler H, Linnemayr V, Weitgasser R, Klein K, Xie M, Iglseder B, Krempler F, Paulweber B, Patsch W. Complex haplotypes of the PGC-1α gene are associated with carbohydrate metabolism and type 2 diabetes. Diabetes. 2004;53:1385–1393. doi: 10.2337/diabetes.53.5.1385. [DOI] [PubMed] [Google Scholar]
- 24.Barroso I, Luan J, Sandhu MS, Franks PW, Crowley V, Schafer AJ, O’Rahilly S, Wareham NJ. Meta-analysis of the Gly482Ser variant in PPARGC1A in type 2 diabetes and related phenotypes. Diabetologia. 2006;49:501–505. doi: 10.1007/s00125-005-0130-2. [DOI] [PubMed] [Google Scholar]
- 25.Kunej T, Globo M, Petrovi NIK, Dov P, Peterlin B, Petrovi D. A Gly482Ser polymorphism of the peroxisome proliferator-activated receptor-γ coactivator-1 (PGC-1) gene is associated with type 2 diabetes in Caucasians. Folia Biologica (Praha) 2004;50:157–158. [PubMed] [Google Scholar]
- 26.Choi YS, Hong JW, Lim S, Ko KS, Pak YK. Impaired coactivator activity of the Gly482 variant of peroxisome proliferator-activated receptor coactivator-1a (PGC-1a) on mitochondrial transcription factor A (Tfam) promoter. Biochem Biophys Res Commun. 2006;344:708–712. doi: 10.1016/j.bbrc.2006.03.193. [DOI] [PubMed] [Google Scholar]
- 27.Andrulionyte L, Peltola P, Chiasson JL, Laakso M for the STOP-NIDDM Study Group. Single nucleotide polymorphisms of PPARD in combination with the Gly482Ser substitution of PGC-1A and the Pro12A1a substitution of PPARG2 predict the conversion from impaired glucose tolerance to type 2 diabetes the STQP-NIDDM Trial. Diabetes. 2006;55:2148–2152. doi: 10.2337/db05-1629. [DOI] [PubMed] [Google Scholar]
- 28.Tucker KL. Stress and nutrition in relation to excess development of chronic disease in Puerto Rican adults living in the Northeastern USA. J Med invest. 2005;52(Suppl):252–258. doi: 10.2152/jmi.52.252. [DOI] [PubMed] [Google Scholar]
- 29.Ho GYF, Qian H, Kim MY, Melnik TA, Tucker KL, Jimenez Velazquez IZ, Kaplan RC, Lee-Rey ET, Stein DT, Rivera W, Rohan TE. Health disparities between island and mainland Puerto Ricans. Pan Am J Public Health. 2006;19:331–339. doi: 10.1590/s1020-49892006000500006. [DOI] [PubMed] [Google Scholar]
- 30.American Diabetes Association. Standards of medical care in diabetes 2007. Diabetes Care. 2007;30(Suppl I):S4–S41. doi: 10.2337/dc07-S004. [DOI] [PubMed] [Google Scholar]
- 31.Lee IM, Paffenbarger RS., Jr Physical activity ajid stroke incidence: the Harvard Alumni Health Study. Stroke. 1998;29:2049–2054. doi: 10.1161/01.str.29.10.2049. [DOI] [PubMed] [Google Scholar]
- 32.de Bakker PI, Yelensky R, Pe’er I, Gabriel SB, Daly MJ, Altshuler D. Efficiency and power in genetic association studies. Nat Genet. 2005;37:1217–1223. doi: 10.1038/ng1669. [DOI] [PubMed] [Google Scholar]
- 33.Matys V, Fricke E, Geffers R, Goessling E, Haubrock M, Hehl R, Hornischer K, Karas D, Kel AE, Kel-Margonlis OV, Kloos DU, Land S, Lewicki-Potapov B, Michael H, Muench R, Reuter I, Rotert S, Saxel H, Scheer M, Thiele S, Wingender E. TRANSFAC: transcriptional regulation, from patterns to profiles. Nucleic Acid Res. 2003;31:374–378. doi: 10.1093/nar/gkg108. [DOI] [PMC free article] [PubMed] [Google Scholar]
- 34.Livak KJ. Allelic discrimination using fluorogenic probes and the 5′ nuclease assay. Genet Anal. 1999;14:143–149. doi: 10.1016/s1050-3862(98)00019-9. [DOI] [PubMed] [Google Scholar]
- 35.Box GEP, Cox DR. An analysis of transformations. J R Stat Soc Series B. 1964;26:211–252. [Google Scholar]
- 36.Excoffier L, Slatkin M. Maximum-likelihood estimation of molecular haplotype frequencies in a diploid population. Mol Biol Evol. 1995;12:921–927. doi: 10.1093/oxfordjournals.molbev.a040269. [DOI] [PubMed] [Google Scholar]
- 37.HelixTree Manual, Version 5.3.0, released 5 April 2007, Available from http://www.goldenhelix.com/.
- 38.Falush D, Stephens M, Pritchard JK. Inference of population structure using multilocus genotype data: linked loci and correlated allele frequencies. Genetics. 2003;164:1567–1587. doi: 10.1093/genetics/164.4.1567. [DOI] [PMC free article] [PubMed] [Google Scholar]
- 39.Yu Z, Schaid DJ. Sequential haplotype scan methods for association analysis. Genet Epidemiol. 2007;31:553–564. doi: 10.1002/gepi.20228. [DOI] [PubMed] [Google Scholar]
- 40.Korshunov SS, Skulachev VP, Starkov AA. High protonic potential actuates a mechanism of production of reactive oxygen species in mitochondria. FEBS Lett. 1997;416:15–18. doi: 10.1016/s0014-5793(97)01159-9. [DOI] [PubMed] [Google Scholar]
- 41.Brownlee M. The pathobiology of diabetic complications: a unifying mechanism. Diabetes. 2005;54:1615–1625. doi: 10.2337/diabetes.54.6.1615. [DOI] [PubMed] [Google Scholar]
- 42.Park KS, Kim JH, Kim MS, Kim JM, Kim SK, Choi JY, Chung MH, Han B, Kim SY, Lee HK. Effects of insulin and antioxidant on plasma 8-hydroxyguanine and tissue 8-hydroxydeoxyguanosine in streptozotocin-induced diabetic rats. Diabetes. 2001;50:2837–2841. doi: 10.2337/diabetes.50.12.2837. [DOI] [PubMed] [Google Scholar]
- 43.Pyorala K, Laakso M, Uusitupa M. Diabetes and atherosclerosis: an epidemiologic view. Diabetes. 1987;3:463–524. doi: 10.1002/dmr.5610030206. [DOI] [PubMed] [Google Scholar]
- 44.Bierman EL. Atherogenesis in diabetes. Arterioscler Thromb. 1992;12:647–656. doi: 10.1161/01.atv.12.6.647. [DOI] [PubMed] [Google Scholar]
- 45.Andreassi MG, Botto N. DNA damage as a new emerging risk factor in atherosclerosis. Trends Cardiovasc: Med. 2003;13:270–275. doi: 10.1016/s1050-1738(03)00109-9. [DOI] [PubMed] [Google Scholar]
- 46.Devaraj S, Jialal I. Low-density lipoprotein postsecretory modification, monocyte function, and circulating adhesion molecules in type 2 diabetic patients with and without macrovascular complications-the effect of a-tocopherol supplementation. Circulation. 2000;102:191–196. doi: 10.1161/01.cir.102.2.191. [DOI] [PubMed] [Google Scholar]
- 47.Kim JA, Berliner JA, Natarajan RD, Nadler JL. Evidence that glucose increases monocyte binding to human aortic endothelial cells. Diabetes. 1994;43:1103–1107. doi: 10.2337/diab.43.9.1103. [DOI] [PubMed] [Google Scholar]
- 48.Hoogerbrugge N, Verkerk A, Jacobs ML, Postema PT, Jongkind JF. Hypertriglyceridemia enhances monocyte binding to endothelial cells in NIDDM. Diabetes Care. 1997;3:1122–1124. doi: 10.2337/diacare.19.10.1122. [DOI] [PubMed] [Google Scholar]
- 49.Martinet W, Knaapen MW, De Meyer GR, Herman AG, Kockx MM. Elevated levels of oxidative DNA damage and DNA repair enzymes in human atherosclerotic plaques. Circulation. 2002;106:927–932. doi: 10.1161/01.cir.0000026393.47805.21. [DOI] [PubMed] [Google Scholar]
- 50.Sriwijitkamol A, Coletta DK, Wajcberg E, Balbontin GB, Reyna SM, Barrientes J, Eagan PA, Jenkinson CP, Cersosimo E, DeFronzo RA, Sakamoto K, Musi N. Effect of acute exercise on AMPK signaling in skeletal muscle of subjects with type 2 diabetes: a time-course and dose-response study. Diabetes. 2007;56:836–848. doi: 10.2337/db06-1119. [DOI] [PMC free article] [PubMed] [Google Scholar]