Abstract
The transport of propidium iodide into electropermeabilized Chinese hamster ovary cells was monitored with a photomultiplier tube during and after the electric pulse. The influence of pulse amplitude and duration on the transport kinetics was investigated with time resolutions from 200 ns to 4 ms in intervals from 400 μs to 8 s. The transport became detectable as early as 60 μs after the start of the pulse, continued for tens of seconds after the pulse, and was faster and larger for higher pulse amplitudes and/or longer pulse durations. With fixed pulse parameters, transport into confluent monolayers of cells was slower than transport into suspended cells. Different time courses of fluorescence increase were observed during and at various times after the pulse, reflecting different transport mechanisms and ongoing membrane resealing. The data were compared to theoretical predictions of the Nernst-Planck equation. After a delay of 60 μs, the time course of fluorescence during the pulse was approximately linear, supporting a mainly electrophoretic solution of the Nernst-Planck equation. The time course after the pulse agreed with diffusional solution of the Nernst-Planck equation if the membrane resealing was assumed to consist of three distinct components, with time constants in the range of tens of microseconds, hundreds of microseconds, and tens of seconds, respectively.
INTRODUCTION
Membrane-impermeable ions and molecules can be successfully introduced to the cytoplasm by exposing the cells to short and intense electric pulses. The pulses create structural changes in proteolipid bilayers of cell membranes, which leads to a transient increase in membrane permeability, a phenomenon termed “electroporation” or “electropermeabilization” (1–5). Although the exact mechanisms of electropermeabilization at the molecular level are still not fully understood (6), the method is today successfully used in different applications, such as the introduction of molecules into cells (5,7–11), transdermal drug delivery (12–14), fusion of cells (15,16), electroinsertion of proteins into membranes (17,18), sterilization (19,20), and tissue ablation (21,22). The main clinical success of electropermeabilization was achieved in the treatment of cutaneous and subcutaneous tumors, where chemotherapeutic drugs are delivered to tumor cells in combination with electric pulses (electrochemotherapy) (23–27), and another application, a nonviral delivery of nucleic acids to cells (gene electrotransfection) is also gaining increasing interest (28–30).
Although structural changes in the membrane have never been directly visualized under the microscope, other techniques have been used to observe electropermeabilization. These include measurements of conductivity of cell suspensions and cell pellets, electrooptical relaxation experiments on lipid vesicles, charge pulse studies on lipid bilayers, measurements of membrane voltage on cells with potentiometric fluorescence dyes, and monitoring the influx or efflux of molecules, fluorescence dyes, radioactive-labeled molecules, or intracellular constituents (31–53). Although these studies showed that structural changes in the membrane and the related increased permeabilization became detectable after application of a sufficiently strong electric field, they also demonstrated that the occurrence of these changes does not coincide with the detection of the transmembrane transport of molecules; i.e., conductivity measurements, electrooptical observations, charge pulse studies, and membrane voltage measurements showed that an increase of the conductivity of a cell suspension, reorientation of lipid molecule headgroups, and a decrease in the membrane voltage, respectively, occurred within a few microseconds after the start of the electric pulse. Since ions are charge carriers in solutions, the detected increase in conductivity of cell suspensions is due to the transport of single-atom ions across the cell membrane (e.g., Na+, Cl−, K+) or the electrical transport. On the other hand, the transport of molecules, or the molecular transport, which was monitored as the influx or efflux of different molecules, was detected milliseconds after the pulse exposure (43,45,47,50,51,54,55).
Many authors suggest that different mechanisms govern the transport during and after the pulse. Although during the pulse the transport is driven mainly by electrophoresis and partly by diffusion, the transport after the pulse is predominantly diffusive (46,56). The transport of single-atom ions and molecules continues for seconds or even minutes after electropermeabilization, until the cell membrane completely recovers (reseals) or until the equilibrium in concentration of ions and molecules is obtained. In contrast, membrane conductivity, which is elevated during the pulse, returns to close to the initial value much faster, milliseconds after the exposure (31,34,36,40).
In a typical electropermeabilization experiment, the electric pulse lasts from 100 μs to 10 ms, so it appears, roughly speaking, that the electrical transport into cells starts during the pulse, and the molecular transport predominantly after the pulse. To a certain extent, these differences can be attributed to the size and charge of molecules, which hinders the permeation of molecules through an electropermeabilized cell membrane. But most likely, the molecular transport also started during the pulse exposure but could not be detected due to limited sensitivity and low time resolution of imaging cameras. To verify if the molecular transport occurs during a typical electropermeabilization pulse, we used a sensitive imaging system composed of a sensitive photomultiplier tube (PM tube) and fast electronics. A modified setup, which allowed continuous monitoring of the signal (a feature not accessible to imaging cameras) was used to determine the onset of the transport and to investigate the influence of pulse parameters on the kinetics of molecular transport. The transport was investigated during and at different time intervals after the pulse, which allowed the comparison of the transport in the presence and absence of the imposed electric field. A theoretical explanation for the measured transport, based on the Nernst-Planck equation, is presented. The experiments were performed on single spherical cells, cells in suspension, and confluent cell monolayers.
MATERIALS AND METHODS
Cells
The experiments were performed on Chinese hamster ovary cells (CHO, WTT clone), which were grown in suspension in culture medium (CM1MEM 40-01, Eurobio, Les Ulis, France) with added fetal calf serum (8%, Boehringer, Mannheim, Germany), antibiotics (penicillin 100 units/ml, streptomycin 100 μg/ml), and L-glutamine (1.16 mg/ml, Sigma-Aldrich, Steinheim, Germany).
Cells were kept in suspension by gentle, continuous agitation (100 rpm) in spinner flasks at 37°C, 5% CO2. The experiments were performed on single spherical cells, suspended cells, and confluent cell monolayers. Single cells were in dilute suspension (∼104 cells/ml) and were given time to settle to the bottom of a LabTek II chamber (Nunc, Roskilde, Denmark). The light was then focused on a single cell, and the fluorescence from this cell was collected. In the case of suspended cells, the concentration of cells was increased to ∼105 cells/ml so that cells, when they settled down, covered almost the whole bottom of the chamber, and the fluorescence from the whole field of view was collected. To obtain confluent cell monolayers, cells from the spinner were plated in LabTek II chambers (105 cells/ml) 1 day before the experiments.
A small, drug-sized membrane-impermeable fluorescent dye propidium iodide (PI, molecular weight = 668, Sigma, Saint Louis, MO) was added to cells before experiments in final concentration of 100 μM unless stated otherwise. Its fluorescence emission strongly increases when the dye is bound to proteins and nucleic acids (50,51,57). All the exposure durations used in this study were too short for significant bleaching or quenching of the dye fluorescence or for its saturation of the DNA binding sites (in fact, during our data acquisition most of the fluorescence was localized to the cytosol (51,57)).
Exposure of cells to electric pulses
A single rectangular electric pulse of various amplitudes (350, 500, 650, 800 V) and/or durations (0.1, 0.5, 1, 3 ms) was generated with a CNRS electropulsator (Jouan, St. Herblain, France). The pulse was delivered to two parallel wire electrodes (diameter 0.5 mm, length 10 mm) with a 5 mm interelectrode distance. The electric field distribution was homogeneous in the middle of the chamber with a value approximately equal to the voltage/distance ratio, i.e., 700, 1000, 1300, and 1600 V/cm. Each measurement was repeated three times (each time with a new cell sample and a new pulse exposure) for each parameter set.
Imaging system for monitoring the kinetics of transport
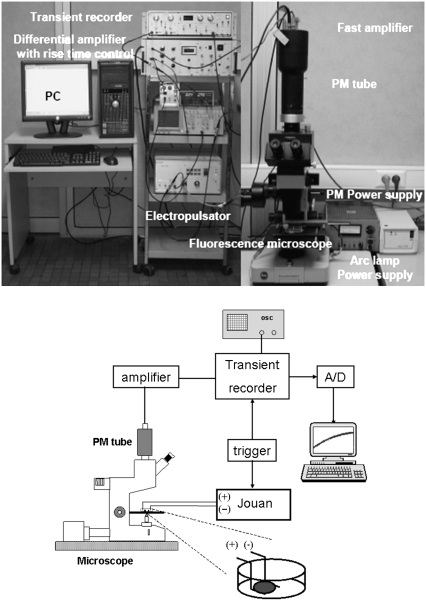
The transport of PI into cells was monitored by observing the changes in fluorescence of PI, which occurred when PI entered electropermeabilized cells. The fluorescence was detected with a sensitive PM tube (EMI 9558, EMI Electronics, London, UK), which was mounted on a fluorescence microscope (Leitz Fluovert, Wetzlar, Germany) (Fig. 1). Cells were observed under a 63×, 1.4 NA oil immersion objective (Leitz, Wetzlar, Germany) after passing the light from a Mercury arc lamp (Osram, Munich, Germany) through the filter cube (excitation: 530 nm < λ < 560 nm; emission >580 nm, Leitz N2). The fluorescence from the cell(s) was monitored simultaneously with the start of the pulse. The fluorescence signal entering the PM tube was transformed to a voltage signal, amplified, and filtered with a custom-made differential amplifier. The prepulse background signal was subtracted, and the differential signal was stored in a transient recorder (DL 922, Datalab, Harborough, UK). The acquisition of the transient recorder was synchronized with the start of the electric pulse. The signal from the recorder was subsequently digitized with a 12 bit analog-to-digital converter (Pico, St. Neots, UK) and processed on a PC using the Pico software.
FIGURE 1.
Schematic of the imaging system.
The imaging system allowed continuous monitoring of the fluorescence changes occurring during and after electric pulse delivery with high sensitivity and high speed by integrating the whole signal from the cell(s). Changes in fluorescence, which reflected the transport of PI into cells, were acquired in intervals of 400 μs, 2000 μs, 80 ms, and 8 s, with time resolutions of 200 ns, 1 μs, 40 μs, and 4 ms, respectively. These acquisition intervals were chosen to determine the onset of molecular transport (400 μs) to compare the transport during and after the pulse (2000 μs) and to monitor the kinetics of the transport after electropermeabilization (80 ms and 8 s).
Noise and response time of the measuring system
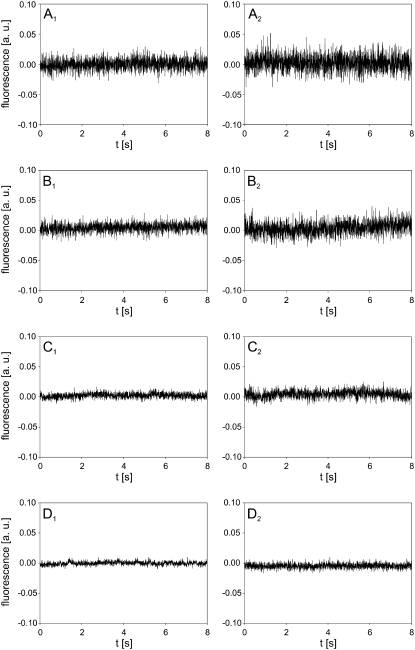
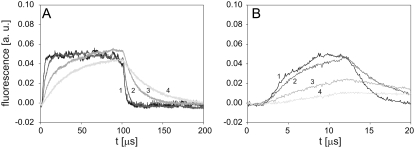
Before the experiments, the measuring system was analyzed in terms of noise and response time. The noise, resulting from the light source, cells, electronics, and surroundings could be filtered by decreasing the bandwidth of the amplifier in four discrete steps from 117 kHz to 3.5 kHz, as shown in Fig. 2. The left column of Fig. 2 shows the noise from the pure solution of PI, whereas the right column of Fig. 2 shows the noise from a suspension of cells with PI. Decreasing the bandwidth also resulted in a decrease of the response time of the system (Fig. 3), which was determined by using a green light-emitting diode (LED) as a pulsed light source. The LED was set on the microscope stage and was driven by a function generator. The rise time of the LED signal was <1 ms. By selecting bandwidths of 39 kHz (for 400 and 2000 μs acquisition intervals) and 7.7 kHz (for 80 ms and 8 s acquisition intervals), a compromise between the acceptable level of noise and a sufficiently fast response was achieved. Figs. 2 and 3 also show that the signal during the 8 s acquisition is stable and that a delay of the electronics on a step change of the signal is ∼2 μs (Fig. 3 B).
FIGURE 2.
Noise analysis. (Left column) Noise in solution of 100 μM PI. (Right column) Noise in suspension of cells and 100 μM PI. The measurements were performed at (A) 117 kHz, (B) 39 kHz, (C) 7.7 kHz, and (D) 3.5 kHz bandwidth of the amplifier. The background fluorescence of the solution was subtracted by the differential acquisition of the signal.
FIGURE 3.
Time response of the imaging system on a step change of the light from a green LED. Durations of the LED signal were set to (A) 100 μs, and (B) 10 μs. Bandwidths of the amplifier: (1) 117 kHz, (2) 39 kHz, (3) 7.7 kHz, and (4) 3.5 kHz.
Data processing and analysis
The solutions of the Nernst-Planck equation (Eq. 1) for the time course of intracellular concentration of PI were fitted to the experimental data. In the cases where the solution was an elementary function (Eqs. 4 and 7), this function was fitted to the experimental data in SigmaPlot 8.0 (Systat Software, San Jose, CA). In the cases where such solution was not attainable, the Nernst-Planck equation was solved numerically and the solution fitted to experimental data in Mathematica 5.1 (Wolfram Research, Champaign, IL).
RESULTS
Single cells
Role of the pulse amplitude
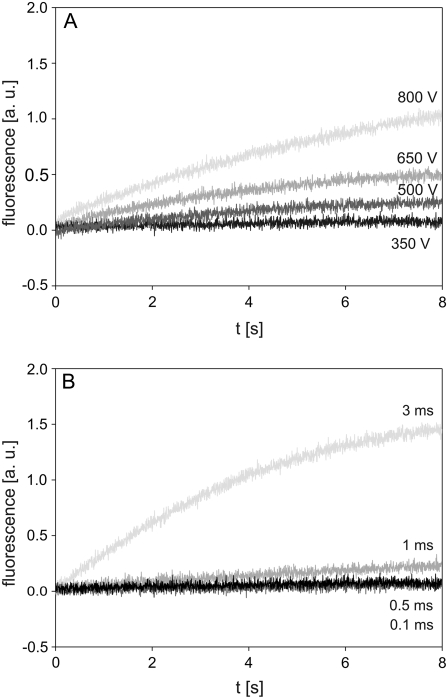
Cells were exposed to a 1 ms pulse with amplitudes of 350, 500, 650, and 800 V, corresponding to 700, 1000, 1300, and 1600 V/cm, respectively, and changes in fluorescence were monitored on a single cell during an 8 s interval. A slow increase in fluorescence, reflecting the transport of PI into the cell, was detected after application of a pulse with an amplitude of 500 V (Fig. 4 A). Higher pulse amplitudes (650 V and 800 V) resulted in correspondingly higher fluorescence, whereas the change in fluorescence induced by a 350 V pulse was barely detectable.
FIGURE 4.
Time course of fluorescence measured from a single cell. (A) The influence of pulse amplitude, and (B) pulse duration on the time course of fluorescence measured from a single cell. CHO cells in dilute suspension containing 100 μM of PI were exposed either to a single rectangular 1 ms pulse with an amplitude of 350, 500, 650, and 800 V or a single rectangular 500 V pulse with a duration of 0.1, 0.5, 1, and 3 ms. The excitation light was focused on a single cell, and fluorescence from this cell was detected with a PM tube. The background fluorescence was subtracted by the differential acquisition of the signal. Each curve shows a single measurement, as there were no large differences between the three repetitions.
Role of the pulse duration
Cells were exposed to a 500 V pulse with durations of 0.1, 0.5, 1, and 3 ms. The 0.1 ms and 0.5 ms pulses did not cause a considerable change in fluorescence during the investigated acquisition interval (Fig. 4 B), whereas a slight increase in fluorescence was observed for a 1 ms pulse. In contrast, a 3 ms pulse provoked a sharp increase in fluorescence in the first few seconds, whereas the subsequent increase was more moderate. At the end of the acquisition interval the fluorescence of a 3 ms pulse was several times higher than the fluorescence associated to the 1 ms pulse (Fig. 4 B), implying that the transport of PI was also several times higher.
Cells in suspension
Experiments similar to those on single cells were also performed on a large sample of suspended cells. Because the fluorescence signal was now accumulated from many cells, a better signal/noise ratio was obtained, which allowed us to monitor the changes in fluorescence on shorter time intervals (2 ms and 80 ms) and, therefore, to compare the transport during and after the pulse.
Role of the pulse amplitude
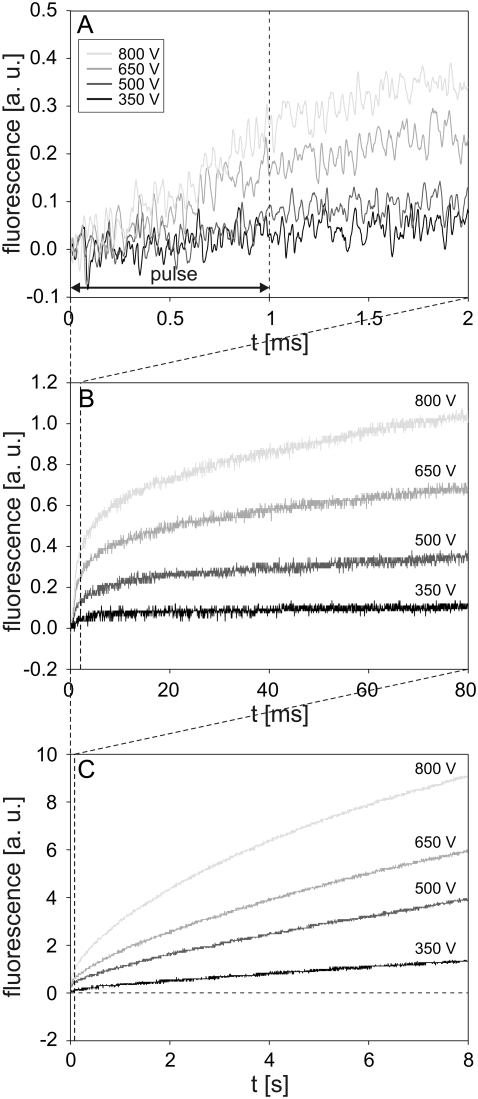
Cells were exposed to the pulses with the same parameter values (duration 1 ms; amplitudes 350, 500, 650, and 800 V) as in the experiments with single cells. The increase in fluorescence was detected at 200–500 μs after the start of the pulse, depending on the pulse amplitude (Fig. 5 A). The fluorescence increased almost linearly during the pulse, whereas after the pulse, the rate of the increase gradually decreased with time. During the total 8 s observation period, the fluorescence did not reach saturation (Fig. 5, B and C). Progressively higher pulse amplitudes resulted in higher fluorescence at the end of the acquisition interval, with the highest fluorescence observed for the 800 V pulse. The uptake of PI during the 1 ms pulse was negligible compared to the inflow of PI occurring after the pulse (cf. Fig. 5, A and C).
FIGURE 5.
Influence of pulse amplitude on the time course of fluorescence during and after electropermeabilization. The changes in fluorescence were monitored on a (A) 2 ms, (B) 80 ms, and (C) 8 s acquisition interval. CHO cells in suspension containing 100 μM of PI were exposed to a single rectangular 1 ms pulse with amplitudes of 350, 500, 650, and 800 V. The dashed line in A denotes the end of the pulse, and the horizontal dashed line in C is the baseline. Results shown on different acquisition intervals were obtained from different experiments. The background fluorescence was subtracted by the differential acquisition of the signal. Note different scale on the y axes.
Role of the pulse duration
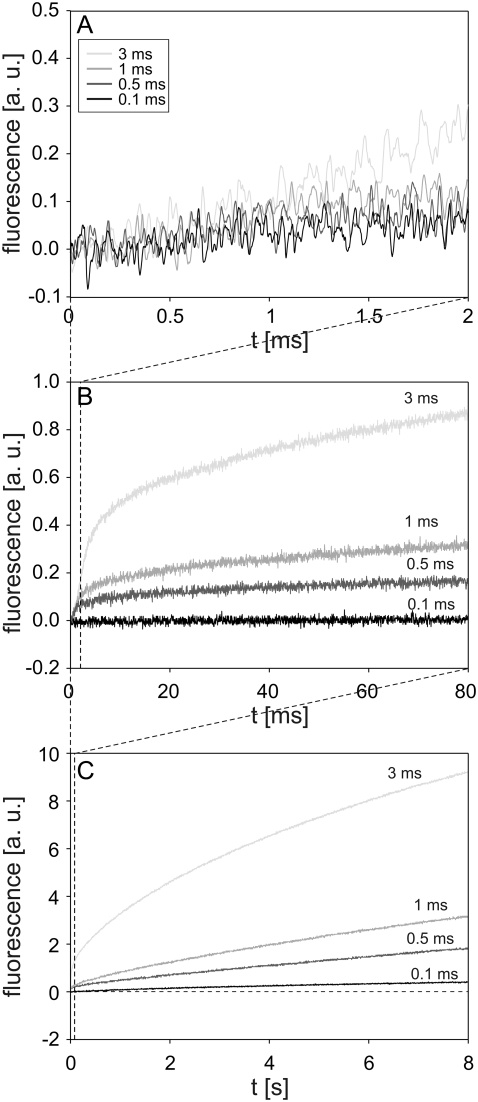
Cells were exposed to the pulses with the same parameter values (amplitude 500 V; durations 0.1, 0.5, 1, and 3 ms) as in the experiments with single cells. Again, after a short delay of a few hundred microseconds, the fluorescence started to increase. A different rate of fluorescence increase during and immediately after the pulse was observed for a 0.5 ms and 1 ms pulse (Fig. 6 A). A 0.1 ms pulse caused no noticeable change in fluorescence on a 2 ms acquisition interval, whereas on the same interval, the first 2 ms of a 3 ms pulse induced a steady increase in fluorescence (Fig. 6 A). The fluorescence caused by 0.5 ms, 1 ms, and 3 ms pulses continued to increase after the pulse but at a more moderate rate (Fig. 6, B and C). On the 8 s acquisition interval, the transport of PI also became noticeable for a 0.1 ms pulse, whereas pulses with longer durations caused higher fluorescence. The most pronounced increase was observed for a 3 ms pulse. The fluorescence intensity detected 8 s after the pulse was fairly linearly related to the pulse duration (at a given field strength) (Fig. 6 C).
FIGURE 6.
Influence of pulse duration on the time course of fluorescence during and after electropermeabilization. The changes in fluorescence were monitored on a (A) 2 ms, (B) 80 ms, and (C) 8 s acquisition interval. CHO cells in suspension containing 100 μM of PI were exposed to a single rectangular 500 V pulse with durations of 0.1, 0.5, 1, and 3 ms. Results in different acquisition intervals were obtained from different experiments. The dashed line in C is the baseline. The background fluorescence was subtracted by the differential acquisition of the signal. Note different scale on y axes.
The fluorescence measured on single cells and the fluorescence from cells in suspension increased in a similar manner with time after the pulse (cf. Figs. 4 A and 5 C, and Figs. 4 B and 6 C). However, the fluorescence from suspended cells was considerably higher and could be detected much sooner due to a better signal/noise ratio.
In a separate experiment, we also measured the transport of Ca2+ ions into cells by using a fluorescent calcium indicator Fluo3. Although the fluorescence signal was less pronounced, a similar time course of fluorescence increase was observed within the first second after the pulse, whereas longer measurements were impossible due to substantial photobleaching of Fluo3 (data not shown).
The onset of molecular transport
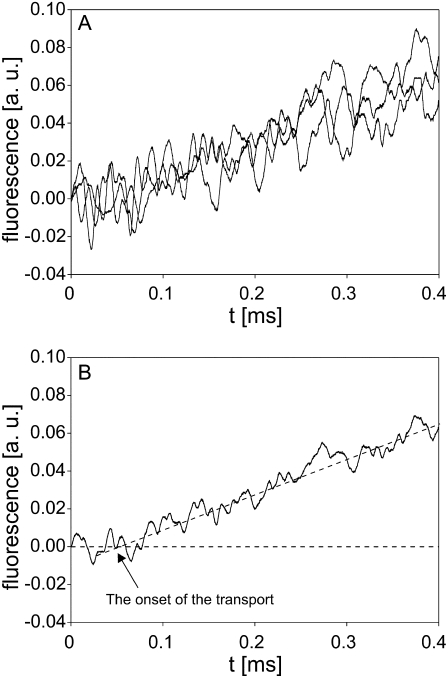
According to the results presented in Figs. 5 A and 6 A, the increase in fluorescence and therefore the transport of PI into cells became detectable not at the pulse onset but sometime between 200 and 500 μs after the start of the pulse, depending on its amplitude and duration. In additional experiments, we focused on determining the onset of molecular transport. Since the detection of the transport depends mostly on the sensitivity of the imaging system, we activated all dynodes in the PM tube, monitored the response on a 400 μs time interval, and increased the dye concentration from 100 μM to 1 mM. Using these settings, the onset of transport was monitored after applying a 1 ms, 800 V pulse to the cell suspension. The results are presented in Fig. 7, A and B, and show that the transport of PI into cells, reflected as an increase in fluorescence, could be detected only ∼60 μs after the start of the pulse. As mentioned in Materials and Methods, the inaccuracy in the synchronization of the pulse onset and start of the data acquisition never exceeded 2 μs.
FIGURE 7.
Onset of the transport of PI. (A) The time course of fluorescence increase obtained from three independent experiments. (B) Average of the three signals in A. CHO cells in suspension containing 1 mM PI were exposed to a single rectangular 1 ms, 800 V pulse. PM tube was set to the highest sensitivity, where all dynodes were activated. The background fluorescence was subtracted by the differential acquisition of the signal.
Confluent monolayers of cells
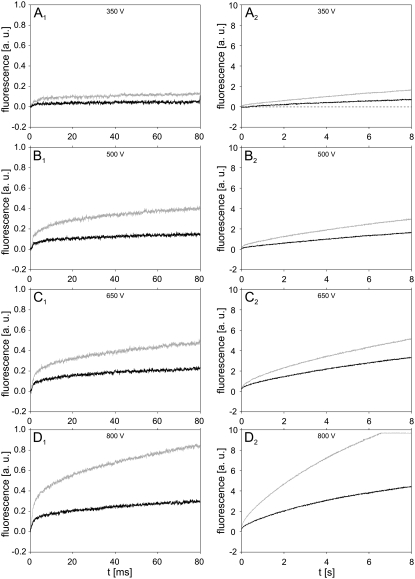
In the last part of the study, the transport of PI into cells grown as confluent monolayers was monitored. Only the influence of pulse amplitudes was investigated here, and the fluorescence was acquired on 80 ms and 8 s time intervals. Black curves in Fig. 8 show the time courses of fluorescence after electropermeabilization with a single 1 ms pulse with amplitudes ranging from 350 to 800 V. For a comparison, the fluorescence from suspended cells obtained with the same pulse parameters is shown on the same figure with gray curves. Qualitatively, the same time course of fluorescence was observed in both suspended and cells in monolayers. However, at a given pulse amplitude, the fluorescence from monolayers was considerably lower than the fluorescence from suspended cells, indicating that less PI was transported into cells in monolayers, at least in the investigated time interval.
FIGURE 8.
Time course of fluorescence for confluent monolayers of cells and suspended cells. Signals were measured on confluent monolayers of cells (black curves) and suspended cells (gray curves) in 80 ms (left column) and 8 s (right column) time intervals. Cells were electropermeabilized with a single 1 ms pulse with amplitudes (A) 350 V, (B) 500 V, (C) 650 V, and (D) 800 V. The gray curve in figure D2 was cut off because of the saturation of the amplifier. Results shown on different acquisition intervals were obtained from different experiments. The background fluorescence was subtracted by the differential acquisition of the signal.
DISCUSSION
In this work, the fast and slow kinetics of the transport of fluorescent molecule PI into electropermeabilized cells was investigated. The aim of the study was to evaluate when the transport of drug-sized molecules becomes detectable and to determine the influence of pulse parameters on the transport during and after the pulse. PI was selected as a probe for the transport as it is known to have a strong quantum yield increase when bound to nucleic acids and has a fast binding rate. Using a sensitive PM tube connected to a fast differential amplifier, we were able to monitor the transport on time intervals from 400 μs to 8 s with sampling time resolutions from 200 ns to 4 ms, respectively. With a PM tube, the spatial resolution was not accessible, and the transport was monitored indirectly by measuring the changes of the fluorescence emanating from the dye inside the cells.
Detection of molecular transport
The transport of PI into a single cell was detected when a pulse with a sufficiently high amplitude or duration was delivered. A technical limit was present when working on single cells; i.e., the weak changes in fluorescence occurring on the subsecond timescale could not be discerned from the noise. Higher sensitivity was achieved with cells in suspension, since the fluorescence signal in this case was the total contribution of many cells. The measurements performed on cells in suspension showed that the transport of PI into permeabilized cells became detectable only between 60 μs and 500 μs after the start of the pulse, depending on the pulse parameters and experimental settings (see Figs. 5 A, 6 A, and 7). This is up to 1000 times faster than what is observable with conventional imaging cameras due to their limited sensitivity and relatively low temporal resolution and more than 60 times faster than previous measurements with a specially modified imaging system (50,51). With a setup similar to ours, Prausnitz and co-workers detected the efflux of calcein from electropermeabilized erythrocyte ghost membranes within 1 ms after the start of the pulse, with a time resolution of 200 μs (49). They focused more on the comparison of the transport during and after the pulse, whereas we provide new (to our knowledge) information on the onset of molecular transport and on the influence of pulse parameters on the transport. Additionally, we compared the measured transport of PI with theoretical predictions of the Nernst-Planck equation during and after the pulse (see the next section).
The detection of transport between 60 μs and 500 μs after the start of the pulse shows that for typical electropermeabilization pulses with durations ranging from 100 μs to 10 ms, transport of small molecules, such as PI, starts during the pulse. For significantly shorter pulses, such a conclusion cannot be made based on our results. Similarly, theoretical studies on lipid assemblies predicting that transport starts within the first microseconds of the electropermeabilizing pulse could not be supported by our experimental observations on mammalian cells.
Theoretical explanation of the measured transport
Different mechanisms govern the transport of molecules into the cell in the presence and absence of electric pulse, which can also be seen from the measured time course of fluorescence. The transport of PI molecules is characterized quantitatively by the Nernst-Planck equation:
 |
(1) |
where c(t) is the molar concentration of PI passing through the surface SP(t) of permeable structural defects, V is the volume of the cell, z the electric charge of PI, E the electric field acting on molecules, F the Faraday constant, R the gas constant, T the absolute temperature, and D the diffusion constant as defined by the Einstein-Smoluchowski relation D = μp kBT, with μp the mobility of the PI molecules and kB the Boltzman constant. In this work, we take V = 9 × 10⁻¹⁶ m3 (corresponding to a spherical cell with a radius of 6 μm), and furthermore assume D = 10−10 m2/s (equal to the value determined for the SERVA blue dye (58) with a molecular weight similar to that of PI). The first term on the right-hand side of Eq. 1 describes the transport due to electric field (electrophoretic transport), and the second term describes the transport due to diffusion (diffusive transport).
In our study, we investigated the time course of the intracellular concentration of PI, cint(t), which was approximately proportional to the fluorescence measured in our experiments. In the following paragraphs, we will explain the observed time courses of fluorescence, from the theoretical estimates of the time courses of cint(t), obtained by solving Eq. 1. In solving this equation, the following simplifications were employed:
As the total volume of cells in our study was considerably smaller than the volume of the extracellular solution, the extracellular concentration of PI can be treated as a constant, cext.
The first term on the right-hand side of Eq. 1 describes the PI molecules brought into electrophoretic motion in the extracellular solution, and therefore in this term we can assume c(t) = cext.
The term
 in Eq. 1 represents the concentration gradient across the cell membrane, which can be approximated as (cint(t) − cext)/h, where h is membrane thickness. Thus, Eq. 1 can be rewritten as
 |
(2) |
We now treat the transport during and after the pulse separately.
The transport of PI during the pulse
Since diffusion is a slow process compared to pulse durations used for electropermeabilization (45,49), its contribution to the total transport during the pulse can be assumed to be small. In a first approximation, the diffusional transport can therefore be neglected, leaving only the electrophoretic term of Eq. 2. As electropermeabilization occurs within less than a microsecond after the start of the pulse (40,59), we can assume that during (most of) the pulse, SP(t) is nearly constant and SP(t) = SP. The transport during the pulse can therefore be approximated as
 |
(3) |
The solution of this equation is
 |
(4) |
Our measurements (Figs. 5 A and 6 A) show that the fluorescence increase during the pulse is approximately linear, as predicted by Eq. 4, with the exception of the first 60–500 μs, during which the transport is not detectable. This may be attributed partly to the noise being comparable to the signal in the first few hundred microseconds of the acquisition at low pulse amplitudes. However, the measurements performed at the highest sensitivity of the PM tube show that the delay between the pulse onset and the start of the fluorescence increase is indeed present, even at the highest amplitude used in our study (see Fig. 7 B). This probably reflects the lag between the rapid increase of electric conductivity of the membrane (detectable as transmembrane current, i.e., transport of ions) and the formation of pathways adequate for the transport of molecules.
Equation 3 was derived under the assumption of SP being nearly constant during the pulse, which is questionable, as it is known that at the same pulse amplitude, longer pulse durations typically lead to a more intense membrane permeabilization. Therefore, it would probably be more realistic to assume that SP(t) consists of a rapid onset (occurrence of permeabilization, within microseconds) followed by a much slower increase during the rest of the pulse. However, the reasonable agreement of the data in Figs. 5 and 7 with a linear slope during the pulse suggests that with our experimental conditions and pulse parameters, the assumption SP(t) = SP is acceptable.
The transport of PI after the pulse
When the pulse ends, the electrophoretic component of the transport ceases, and the transport is mostly diffusional. This transition is reflected in the change of the rate of fluorescence increase, which becomes slower immediately after the pulse (Figs. 5 A and 6 A) and then gradually decreases with time (Figs. 5, B and C, and 6, B and C), in agreement with the results obtained earlier by fast video imaging with a lower time resolution (51). For diffusional transport, Eq. 2 then becomes
 |
(5) |
Before solving this equation, we need to consider that the density of permeable structural defects decreases with time after the pulse in a process termed “cell membrane resealing”. In several studies, investigators have shown that resealing proceeds in several phases (stages). Usually, a fast resealing phase (microsecond timescale) is followed by one or more slower phases (1,40,58,60,61). To account for resealing, the general function SP(t) in Eq. 5 had to be replaced with a function mimicking such a behavior. In a first approximation, the resealing was described as an exponential decrease of SP with time after the end of the pulse:
 |
(6) |
The solution of Eq. 5 for this case yields
 |
(7) |
where the constants A, B, and C are given by
 |
(7a) |
 |
(7b) |
 |
(7c) |
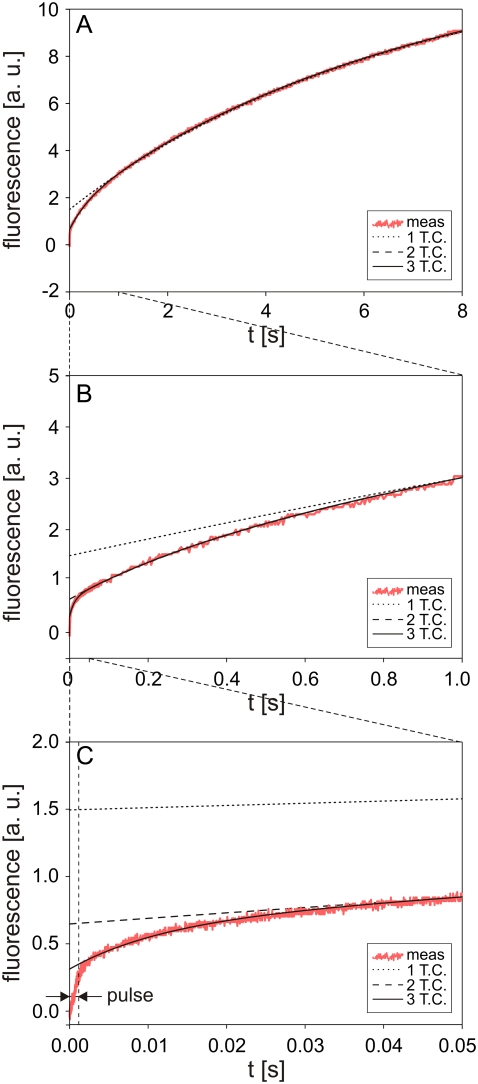
respectively, and cint 0 = cint(0) is the initial intracellular concentration of the dye. Equation 7 was then fitted to the measured postpulse time course of fluorescence for a 1 ms, 800 V pulse (Fig. 9, dotted curve). The fitted curve yielded a τ1 of ∼14 s and agreed very well with experimental data for t > 1 s but deviated significantly for shorter times. These results suggest that within the first second, SP(t) behaves in a more complex manner than predicted by Eq. 6. To account for this, we included an additional exponential term,
 |
(8) |
FIGURE 9.
Theoretically calculated solution of Eq. 5 for different functions SP(t).
An analytical solution of Eq. 5, however, is not attainable for this case, so the solution was obtained numerically and again fitted to the experimental data (Fig. 9, dashed curve). Very good agreement was obtained for t > 50 ms, but deviations for shorter times were still significant (see Fig. 9 C). A time constant τ2 for this case was 380 ms. We therefore added a third exponential term,
 |
(9) |
For this form of SP(t), the fitted solution agreed well with the experimental data for all t > 2 ms (Fig. 9, solid curve) and the calculated τ3 was 12 ms.
These observations can be explained as follows. For very short times, all components of SP(t) as given by Eq. 9 play a role. For t ≫ τ3, the third term, SP3 exp(−t/τ3), becomes negligible and for t ≫ τ2 the second term, SP2 exp(−t/τ2), also becomes insignificant. This also explains why cint0 in Eq. 7 is larger than zero, as this term (cint0) contains the transport contributed by SP2 exp(−t/τ2) + SP3 exp(−t/τ3) but does not account for SP1 exp(−t/τ1).
Equation 9 can also be used to estimate the fraction of permeable structural defects in the membrane,
 |
(10) |
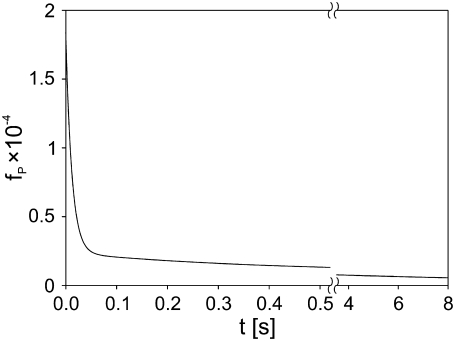
where SC is the total surface of the membrane (determined by the cell size). For a fixed pulse amplitude and duration, the values of SP1, SP2, SP3, τ1, τ2, and τ3 are constants that can be obtained by fitting Eq. 9 to experimental data, as shown in Fig. 9 for the case of a single 1 ms, 800 V pulse. In Fig. 10, we show the postpulse course of fP(t) due to such a pulse, with fP decreasing from 1.6 × 10⁻⁴ at t = 2 ms to 5.5 × 10⁻⁶ at t = 8 s and with the time course reflecting the three time constants. Previous studies reported a single time constant in the range of our τ1 (46,58), which is attributable to their lack of sufficient time resolution. Our calculated values of fP agree with the range between 10−3 and 10−5 as reported by other authors for comparable pulse parameters (36,40,58,59).
FIGURE 10.
Time course of the fraction of permeable structural defects fP(t) in the membrane after electropermeabilization. Cells were exposed to a 1 ms, 800 V pulse, and fP was calculated from fP(t) = SP(t)/SC, where SP(t) = SP1 exp(−t/τ1) + SP2 exp(−t/τ2) + SP3 exp(−t/τ3) and SC is the total surface of the cell membrane. The parameters SP1, SP2, SP3, τ1, τ2, τ3 were obtained from fitting Eq. 5 to the experimental data shown in Fig. 9: SP1 = 4.5 × 10⁻¹⁵ m2, SP2 = 6.3 × 10⁻¹⁵ m2, SP3 = 7.2 × 10⁻¹⁴ m2, τ1 = 14 s, τ2 = 380 ms, τ3 = 12 ms.
The effect of pulse amplitude and pulse duration on the transport
The kinetics of transport of PI into cells during and after the pulse was strongly affected by the pulse amplitude and duration (Figs. 5 and 6). The influence of pulse amplitude on the transport can be explained by the relation between the extent of permeabilized surface of the cell SPS and electric field E (46,62,63):
 |
(11) |
where EC is the critical amplitude of external electric field for electropermeabilization. The surface of permeable structural defects SP is the part of SPS where the transport occurs. Supracritical pulse amplitudes increase the SPS and therefore the SP, which results in increased transport. The data in Figs. 4 A and 5 C agree with the previously reported linear relation between the fluorescence intensity and the reciprocal of the electric field (46).
The influence of pulse duration on the kinetics of transport can be explained with the increase in SP with time during the pulse (see the section “The transport of PI during the pulse”) and the stabilization of permeable structural defects after the pulse. As Fig. 6 C shows, at a given field strength the fluorescence detected 8 s after the pulse increases with the pulse duration in a fairly linear manner, as reported by Rols and Teissié (8). This can be explained with the stabilization of permeable structural defects, resulting in larger transport (8).
Transport to cells in monolayers
In the last part of the study, the molecular transport into confluent cell monolayers and cell suspensions was compared. At the same pulse parameters, transport into cells in monolayers was considerably lower than transport into cells in suspension. This is in agreement with our previous numerical and experimental studies on dense cell suspensions where we demonstrated that increasing the density of suspension considerably reduced the uptake of molecules into cells, partly because of lower transmembrane voltage and partly because of cell-to-cell contacts (63–66). Similar observations were also reported on multicellular spheroids (67). In addition, with cells growing in monolayers the transport is limited only to the part of the membrane that is not in contact with the dish.
CONCLUSION
We showed that the transport of small molecules may start during the application of an electropermeabilizing pulse after a significant lag and continues long after the end of the pulse. The structural alterations supporting the transport are triggered on a nanosecond timescale if high voltage pulses are applied (68–74), but the transport is present only later. Pulse parameters, such as amplitude and duration, considerably affect the transport of molecules into electropermeabilized cells during and after the pulse. The fastest transport may be observed during the pulse, when molecules are mainly driven into the cell by electrophoresis, whereas after the pulse, the transport continues by means of diffusion. Due to relatively slow cell membrane resealing, which according to our analysis consists of at least three distinct components, the majority of the transport occurs after the pulse. The results of this study were obtained with PI but are also applicable to other molecules of similar size and charge.
Acknowledgments
This work was supported by the Slovenian-French scientific cooperation (PICS program BIFR/05-PICS-001) and the region Midi Pyrénées and through various grants of the Slovenian Research Agency. G.P. was a recipient of a fellowship from the French government, and he also thanks Dr. M. Golzio, Dr. M. P. Rols, Dr. C. Favard, and Dr. M. Pavlin for their valuable discussions during the experiments, and Ms. C. Millot for her help with cell cultures.
Editor: Peter Tieleman.
References
- 1.Kinosita, K., and T. Y. Tsong. 1977. Voltage-induced pore formation and hemolysis of human erythrocytes. Biochim. Biophys. Acta. 471:227–242. [DOI] [PubMed] [Google Scholar]
- 2.Tsong, T. Y. 1991. Electroporation of cell membranes. Biophys. J. 60:297–306. [DOI] [PMC free article] [PubMed] [Google Scholar]
- 3.Barnett, A., and J. C. Weaver. 1991. Electroporation: a unified, quantitative theory of reversible electrical breakdown and rupture. Bioelectroch. Bioener. 25:163–182. [Google Scholar]
- 4.Teissié, J., N. Eynard, B. Gabriel, and M. P. Rols. 1999. Electropermeabilization of cell membranes. Adv. Drug Deliver. Rev. 35:3–19. [DOI] [PubMed] [Google Scholar]
- 5.Neumann, E., S. Kakorin, and K. Toensing. 1999. Fundamentals of electroporative delivery of drugs and genes. Bioelectroch. Bioener. 48:3–16. [DOI] [PubMed] [Google Scholar]
- 6.Teissié, J., M. Golzio, and M. P. Rols. 2005. Mechanisms of cell membrane electropermeabilization: a minireview of our present (lack of?) knowledge. Biochim. Biophys. Acta. 1724:270–280. [DOI] [PubMed] [Google Scholar]
- 7.Neumann, E., M. S. Ridder, Y. Wang, and P. H. Hofschneider. 1982. Gene transfer into mouse lyoma cells by electroporation in high electric fields. EMBO J. 1:841–845. [DOI] [PMC free article] [PubMed] [Google Scholar]
- 8.Rols, M. P., and J. Teissié. 1998. Electropermeabilization of mammalian cells to macromolecules: control by pulse duration. Biophys. J. 75:1415–1423. [DOI] [PMC free article] [PubMed] [Google Scholar]
- 9.Canatella, P. J., J. F. Karr, J. A. Petros, and M. R. Prausnitz. 2001. Quantitative study of electroporation-mediated molecular uptake and cell viability. Biophys. J. 80:755–764. [DOI] [PMC free article] [PubMed] [Google Scholar]
- 10.Maček-Lebar, A., and D. Miklavčič. 2001. Cell electropermeabilization to small molecules in vitro: control by pulse parameters. Radiology and Oncology. 35:193–202. [Google Scholar]
- 11.Gehl, J. 2003. Electroporation: theory and methods, perspectives for drug delivery, gene therapy and research. Acta Physiol. Scand. 177:437–447. [DOI] [PubMed] [Google Scholar]
- 12.Prausnitz, M. R. 1996. The effects of electric current applied to skin: a review for transdermal drug delivery. Adv. Drug Deliv. Rev. 18:395–425. [Google Scholar]
- 13.Denet, A. R., R. Vanbever, and V. Preat. 2004. Skin electroporation for transdermal and topical delivery. Adv. Drug. Deliv. Rev. 56:659–674. [DOI] [PubMed] [Google Scholar]
- 14.Pavšelj, N., and V. Preat. 2005. DNA electrotransfer into the skin using a combination of one high- and one low-voltage pulse. J. Control. Release. 106:407–415. [DOI] [PubMed] [Google Scholar]
- 15.Zimmerman, U. 1982. Electric field-mediated fusion and related electrical phenomena. Biochim. Biophys. Acta. 694:227–277. [DOI] [PubMed] [Google Scholar]
- 16.Ogura, A., J. Matsuda, and R. Yanagimachi. 1994. Birth of normal young after electrofusion of mouse oocytes with round spermatids. Proc. Natl. Acad. Sci. USA. 91:7460–7462. [DOI] [PMC free article] [PubMed] [Google Scholar]
- 17.Elouagari, K., J. Teissié, and H. Benoist. 1995. Glycophorin A protects K562 cells from natural-killer-cell attack—role of oligosaccharides. J. Biol. Chem. 270:26970–26975. [DOI] [PubMed] [Google Scholar]
- 18.Teissié, J. 1998. Transfer of foreign receptors to living cell surfaces: the bioelectrochemical approach. Bioelectroch. Bioener. 46:115–120. [Google Scholar]
- 19.Rowan, N. J., S. J. MacGregor, J. G. Anderson, R. A. Fouracre, and O. Farish. 2000. Pulsed electric field inactivation of diarrhoeagenic Bacillus cereus through irreversible electroporation. Lett. Appl. Microbiol. 31:110–114. [DOI] [PubMed] [Google Scholar]
- 20.Teissié, J., N. Eynard, M. C. Vernhes, A. Benichou, V. Ganeva, B. Galutzov, and P. A. Cabanes. 2002. Recent biotechnological developments of electropulsation. A prospective review. Bioelectrochemistry. 55:107–112. [DOI] [PubMed] [Google Scholar]
- 21.Davalos, R. V., L. M. Mir, and B. Rubinski. 2005. Tissue ablation with irreversible electroporation. Ann. Biomed. Eng. 33:223–231. [DOI] [PubMed] [Google Scholar]
- 22.Lavee, J., G. Onik, P. Mikus, and B. Rubinski. 2007. A novel nonthermal energy source for surgical epicardial atrial ablation: irreversible electroporation. Heart Surg. Forum. 10:92–101. [DOI] [PubMed] [Google Scholar]
- 23.Mir, L. M., L. F. Glass, G. Serša, J. Teissié, C. Domenge, D. Miklavčič, M. J. Jaroszeski, S. Orlowski, D. S. Reintgen, Z. Rudolf, M. Belehradek, R. Gilbert, M. P. Rols, J. Belehradek, J. M. Bachaud, R. DeConti, B. Štabuc, M. Čemažar, P. Coninx, and R. Heller. 1998. Effective treatment of cutaneous and subcutaneous malignant tumours by electrochemotherapy. Br. J. Cancer. 77:2336–2342. [DOI] [PMC free article] [PubMed] [Google Scholar]
- 24.Mir, L. M., and S. Orlowski. 1999. Mechanisms of electrochemotherapy. Adv. Drug Deliv. Rev. 35:107–118. [DOI] [PubMed] [Google Scholar]
- 25.Heller, R., R. Gilbert, and M. J. Jaroszeski. 1999. Clinical applications of electrochemotherapy. Adv. Drug Deliv. Rev. 35:119–129. [DOI] [PubMed] [Google Scholar]
- 26.Marty, M., G. Serša, J. R. Garbay, J. Gehl, C. G. Collins, M. Snoj, V. Billard, P. F. Geertsen, J. O. Larkin, D. Miklavčič, I. Pavlović, S. M. Paulin-Košir, M. Čemažar, N. Morsli, Z. Rudolf, C. Robert, G. C. O'Sullivan, and L. M. Mir. 2006. Electrochemotherapy—an easy, highly effective and safe treatment of cutaneous and subcutaneous metastases: results of ESOPE (European Standard Operating Procedures of Electrochemotherapy) study. Eur. J. Cancer Suppl. 4:3–13. [Google Scholar]
- 27.Serša, G., D. Miklavčič, M. Čemažar, Z. Rudolf, G. Pucihar, and M. Snoj. 2008. Electrochemotherapy in treatment of tumours. Eur. J. Surg. Oncol. 34:232–240. [DOI] [PubMed] [Google Scholar]
- 28.Jaroszeski, M. J., R. Gilbert, C. Nicolau, and R. Heller. 1999. In vivo gene delivery by electroporation. Adv. Drug Deliv. Rev. 35:131–137. [DOI] [PubMed] [Google Scholar]
- 29.Šatkauskas, S., M. F. Bureau, M. Puc, A. Mahfoudi, D. Scherman, D. Miklavčič, and L. M. Mir. 2002. Mechanisms of in vivo DNA electrotransfer: respective contributions of cell electropermeabilization and DNA electrophoresis. Mol. Ther. 5:133–140. [DOI] [PubMed] [Google Scholar]
- 30.Golzio, M., L. Mazzolini, A. Ledoux, A. Paganin, M. Izard, L. Hellaudais, A. Bieth, M. J. Pillaire, C. Cazaux, J. S. Hoffmann, B. Couderc, and J. Teissié. 2007. In vivo gene silencing in solid tumors by targeted electrically mediated siRNA delivery. Gene Ther. 14:752–759. [DOI] [PubMed] [Google Scholar]
- 31.Kinosita, K., and T. Y. Tsong. 1979. Voltage-induced conductance in human erythrocyte membranes. Biochim. Biophys. Acta. 554:479–497. [DOI] [PubMed] [Google Scholar]
- 32.Abidor, I. G., L. H. Li, and S. W. Hui. 1994. Studies of cell pellets 2. Osmotic properties, electroporation, and related phenomena—membrane interactions. Biophys. J. 67:427–435. [DOI] [PMC free article] [PubMed] [Google Scholar]
- 33.Kakorin, S., and E. Neumann. 2002. Ionic conductivity of electroporated lipid bilayer membranes. Bioelectrochemistry. 56:163–166. [DOI] [PubMed] [Google Scholar]
- 34.Schmeer, M., T. Seipp, U. Pliquett, S. Kakorin, and E. Neumann. 2004. Mechanism for the conductivity changes caused by membrane electroporation of CHO cell-pellets. Phys. Chem. Chem. Phys. 6:5564–5574. [Google Scholar]
- 35.Pavlin, M., M. Kandušer, M. Reberšek, G. Pucihar, F. X. Hart, R. Magjarević, and D. Miklavčič. 2005. Effect of cell electroporation on the conductivity of a cell suspension. Biophys. J. 88:4378–4390. [DOI] [PMC free article] [PubMed] [Google Scholar]
- 36.Pavlin, M., V. Leben, and D. Miklavčič. 2007. Electroporation in dense cell suspension—theoretical and experimental analysis of ion diffusion and cell permeabilization. Biochim. Biophys. Acta. 1770:12–23. [DOI] [PubMed] [Google Scholar]
- 37.Kakorin, S., S. P. Stoylov, and E. Neumann. 1996. Electro-optics of membrane electroporation in diphenylhexatriene-doped lipid bilayer vesicles. Biophys. Chem. 58:109–116. [DOI] [PubMed] [Google Scholar]
- 38.Griese, T., S. Kakorin, and E. Neumann. 2002. Conductometric and electrooptic relaxation spectrometry of lipid vesicle electroporation at high fields. Phys. Chem. Chem. Phys. 4:1217–1227. [Google Scholar]
- 39.Benz, R., F. Beckers, and U. Zimmermann. 1979. Reversible electrical breakdown of lipid bilayer membranes—charge-pulse relaxation study. J. Membr. Biol. 48:181–204. [DOI] [PubMed] [Google Scholar]
- 40.Hibino, M., H. Itoh, and K. Kinosita. 1993. Time courses of cell electroporation as revealed by submicrosecond imaging of transmembrane potential. Biophys. J. 64:789–800. [DOI] [PMC free article] [PubMed] [Google Scholar]
- 41.Riemann, F., U. Zimmermann, and G. Pilwat. 1975. Release and uptake of hemoglobin and ions in red blood-cells induced by dielectric-breakdown. Biochim. Biophys. Acta. 394:449–462. [DOI] [PubMed] [Google Scholar]
- 42.Kinosita, K., and T. Y. Tsong. 1977. Formation and resealing of pores of controlled sizes in human erythrocyte-membrane. Nature. 268:438–441. [DOI] [PubMed] [Google Scholar]
- 43.Mehrle, W., U. Zimmermann, and R. Hampp. 1985. Evidence for asymmetrical uptake of fluorescent dyes through electro-permeabilized membranes of Avena mesophyll protoplasts. FEBS Lett. 185:89–94. [Google Scholar]
- 44.Mir, L. M., H. Banoun, and C. Paoletti. 1988. Introduction of definite amounts of nonpermeant molecules into living cells after electropermeabilization—direct access to the cytosol. Exp. Cell Res. 175:15–25. [DOI] [PubMed] [Google Scholar]
- 45.Dimitrov, D. S., and A. E. Sowers. 1990. Membrane electroporation—fast molecular-exchange by electroosmosis. Biochim. Biophys. Acta. 1022:381–392. [DOI] [PubMed] [Google Scholar]
- 46.Rols, M. P., and J. Teissié. 1990. Electropermeabilization of mammalian cells: quantitative analysis of the phenomenon. Biophys. J. 58:1089–1098. [DOI] [PMC free article] [PubMed] [Google Scholar]
- 47.Tekle, E., R. D. Astumian, and P. B. Chock. 1994. Selective and asymmetric molecular-transport across electroporated cell-membranes. Proc. Natl. Acad. Sci. USA. 91:11512–11516. [DOI] [PMC free article] [PubMed] [Google Scholar]
- 48.Prausnitz, M. R., C. D. Milano, J. A. Gimm, R. Langer, and J. C. Weaver. 1994. Quantitative study of molecular-transport due to electroporation—uptake of bovine serum-albumin by erythrocyte-ghosts. Biophys. J. 66:1522–1530. [DOI] [PMC free article] [PubMed] [Google Scholar]
- 49.Prausnitz, M. R., J. D. Corbett, J. A. Gimm, D. E. Golan, R. Langer, and J. C. Weaver. 1995. Millisecond measurement of transport during and after an electroporation pulse. Biophys. J. 68:1864–1870. [DOI] [PMC free article] [PubMed] [Google Scholar]
- 50.Gabriel, B., and J. Teissié. 1997. Direct observation in the millisecond time range of fluorescent molecule asymmetrical interaction with the electropermeabilized cell membrane. Biophys. J. 73:2630–2637. [DOI] [PMC free article] [PubMed] [Google Scholar]
- 51.Gabriel, B., and J. Teissié. 1999. Time courses of mammalian cell electropermeabilization observed by millisecond imaging of membrane property changes during the pulse. Biophys. J. 76:2158–2165. [DOI] [PMC free article] [PubMed] [Google Scholar]
- 52.Kotnik, T., G. Pucihar, M. Reberšek, D. Miklavčič, and L. M. Mir. 2003. Role of pulse shape in cell membrane electropermeabilization. Biochim. Biophys. Acta. 1614:193–200. [DOI] [PubMed] [Google Scholar]
- 53.Serpersu, E. H., K. Kinosita, and T. Y. Tsong. 1985. Reversible and irreversible modification of erythrocyte-membrane permeability by electric-field. Biochim. Biophys. Acta. 812:779–785. [DOI] [PubMed] [Google Scholar]
- 54.Tekle, E., R. D. Astumian, and P. B. Chock. 1990. Electropermeabilization of cell-membranes—effect of the resting membrane-potential. Biochem. Biophys. Res. Commun. 172:282–287. [DOI] [PubMed] [Google Scholar]
- 55.Teruel, M. N., and T. Meyer. 1997. Electroporation-induced formation of individual calcium entry sites in the cell body and processes of adherent cells. Biophys. J. 73:1785–1796. [DOI] [PMC free article] [PubMed] [Google Scholar]
- 56.Puc, M., T. Kotnik, L. M. Mir, and D. Miklavčič. 2003. Quantitative model of small molecules uptake after in vitro cell electropermeabilization. Bioelectrochemistry. 60:1–10. [DOI] [PubMed] [Google Scholar]
- 57.Sixou, S., and J. Teissié. 1993. Exogenous uptake and release of molecules by electroloaded cells—a digitized videomicroscopy study. Bioelectroch. Bioener. 31:237–257. [Google Scholar]
- 58.Neumann, E., K. Toensing, S. Kakorin, P. Budde, and J. Frey. 1998. Mechanism of electroporative dye uptake by mouse B cells. Biophys. J. 74:98–108. [DOI] [PMC free article] [PubMed] [Google Scholar]
- 59.Hibino, M., M. Shigemori, H. Itoh, K. Nagayama, and K. Kinosita. 1991. Membrane conductance of an electroporated cell analyzed by submicrosecond imaging of transmembrane potential. Biophys. J. 59:209–220. [DOI] [PMC free article] [PubMed] [Google Scholar]
- 60.Glaser, R. W., S. L. Leikin, L. V. Chernomordik, V. F. Pastushenko, and A. I. Sokirko. 1988. Reversible electrical breakdown of lipid bilayers—formation and evolution of pores. Biochim. Biophys. Acta. 940:275–287. [DOI] [PubMed] [Google Scholar]
- 61.Rols, M. P., F. Dahhou, K. P. Mishra, and J. Teissié. 1990. Control of electric-field induced cell-membrane permeabilization by membrane order. Biochemistry. 29:2960–2966. [DOI] [PubMed] [Google Scholar]
- 62.Schwister, K., and B. Deuticke. 1985. Formation and properties of aqueous leaks induced in human-erythrocytes by electrical breakdown. Biochim. Biophys. Acta. 816:332–348. [DOI] [PubMed] [Google Scholar]
- 63.Pucihar, G., T. Kotnik, J. Teissié, and D. Miklavčič. 2007. Electropermeabilization of dense cell suspensions. Eur. Biophys. J. 36:173–185. [DOI] [PubMed] [Google Scholar]
- 64.Susil, R., D. Šemrov, and D. Miklavčič. 1998. Electric field induced transmembrane potential depends on cell density and organization. Electro. Magnetobiol. 17:391–399. [Google Scholar]
- 65.Pavlin, M., N. Pavšelj, and D. Miklavčič. 2002. Dependence of induced transmembrane potential on cell density, arrangement, and cell position inside a cell system. IEEE Trans. Biomed. Eng. 49:605–612. [DOI] [PubMed] [Google Scholar]
- 66.Pucihar, G., T. Kotnik, B. Valič, and D. Miklavčič. 2006. Numerical determination of transmembrane voltage induced on irregularly shaped cells. Ann. Biomed. Eng. 34:642–652. [DOI] [PubMed] [Google Scholar]
- 67.Canatella, P. J., M. M. Black, D. M. Bonnichsen, C. McKenna, and M. R. Prausnitz. 2004. Tissue electroporation: quantification and analysis of heterogeneous transport in multicellular environments. Biophys. J. 86:3260–3268. [DOI] [PMC free article] [PubMed] [Google Scholar]
- 68.Pakhomov, A. G., J. F. Kolb, J. A. White, R. P. Joshi, S. Xiao, and K. H. Schoenbach. 2007. Long-lasting plasma membrane permeabilization in mammalian cells by nanosecond pulsed electric field (nsPEF). Bioelectromagnetics. 28:655–663. [DOI] [PubMed] [Google Scholar]
- 69.Pakhomov, A. G., R. Shevin, J. A. White, J. F. Kolb, O. N. Pakhomova, R. P. Joshi, and K. H. Schoenbach. 2007. Membrane permeabilization and cell damage by ultrashort electric field shocks. Arch. Biochem. Biophys. 465:109–118. [DOI] [PubMed] [Google Scholar]
- 70.Tekle, E., H. Oubrahim, S. M. Dzekunov, J. F. Kolb, K. H. Schoenbach, and P. B. Chock. 2005. Selective field effects on intracellular vacuoles and vesicle membranes with nanosecond electric pulses. Biophys. J. 89:274–284. [DOI] [PMC free article] [PubMed] [Google Scholar]
- 71.Vernier, P. T., Y. Sun, L. Marcu, S. Salemi, C. M. Craft, and M. A. Gundersen. 2003. Calcium bursts induced by nanosecond electric pulses. Biochem. Biophys. Res. Commun. 310:286–295. [DOI] [PubMed] [Google Scholar]
- 72.Vernier, P. T., Y. Sun, and M. A. Gundersen. 2006. Nanoelectropulse-driven membrane perturbation and small molecule permeabilization. BMC Cell Biol. 7:37. [DOI] [PMC free article] [PubMed] [Google Scholar]
- 73.Tieleman, D. P. 2004. The molecular basis of electroporation. BMC Biochem. 5:10. [DOI] [PMC free article] [PubMed] [Google Scholar]
-
74.Kotnik, T., and D. Miklav
 2006. Theoretical evaluation of voltage inducement on internal membranes of biological cells exposed to electric fields. Biophys. J. 90:480–491. [DOI] [PMC free article] [PubMed] [Google Scholar]


