

Abstract
The purpose of this study is to determine the diagnostic accuracy of MRI-based high-dimensional pattern classification in differentiating between patients with Alzheimer’s Disease (AD), Frontotemporal Dementia (FTD), and healthy controls, on an individual patient basis. MRI scans of 37 patients with AD and 37 age-matched cognitively normal elderly individuals, as well as 12 patients with FTD and 12 age-matched cognitively normal elderly individuals, were analyzed using voxel-based analysis and high-dimensional pattern classification. Diagnostic sensitivity and specificity of spatial patterns of regional brain atrophy found to be characteristic of AD and FTD were determined via cross-validation and via split-sample methods. Complex spatial patterns of relatively reduced brain volumes were identified, including temporal, orbitofrontal, parietal and cingulate regions, which were predominantly characteristic of either AD or FTD. These patterns provided 100% diagnostic accuracy, when used to separate AD or FTD from healthy controls. The ability to correctly distinguish AD from FTD averaged 84.3%. All estimates of diagnostic accuracy were determined via cross-validation. In conclusion, AD- and FTD-specific patterns of brain atrophy can be detected with high accuracy using high-dimensional pattern classification of MRI scans obtained in a typical clinical setting.
Keywords: Frontotemporal dementia (29), Alzheimer’s Disease (26), Volumetric MRI (130)
Introduction
The increasing prevalence of dementia associated with the steady increase in life expectancy has sparked the interest in developing sensitive and specific imaging methods for detecting Alzheimer’s disease (AD) pathology and reliably distinguishing it from other age related neurodegenerative dementias. Structural MRI has the potential to both aid diagnosis and provide objective surrogate markers of effects of pharmacological interventions designed to slow or halt the neurodegenerative process. Advanced image analysis methodologies have also been described in the literature, aiming to quantify structural characteristics of healthy individuals and patients with AD or FTD (Thompson, Mega et al. 2001; Resnick, Pham et al. 2003; Fox and Schott 2004; Grossman, McMillan et al. 2004; Chang, Lomen-Hoerth et al. 2005; Likeman, Anderson et al. 2005; Short, Broderick et al. 2005; Barnes, Whitwell et al. 2006).
The accurate distinction between AD and FTD is especially challenging since there is considerable overlap in both the clinical symptoms and the cognitive domains impaired (Hodges, Davies et al. 2004). FDG PET provides information on regional metabolic impairment (Foster, Heidebrink et al. 2007) that is helpful but often the pattern or the degree of impairment is not definitive enough to permit a confident clinical diagnosis, especially with respect to differentiating AD from the frontal dementias. Moreover, it would be beneficial to derive diagnostic tools based on MRI, instead of FDG-PET. In general, only 75 to 85% of patients who fulfill neuropathological criteria for one of the frontotemporal neurodegenerative dementing illnesses will have had a diagnosis of FTD prior to death (Knopman, Boeve et al. 2005; Forman, Farmer et al. 2006) The proportion of patients with a clinical diagnosis of FTD whose diagnosis is confirmed at autopsy may be even lower (Varma, Adams et al. 2002).
The majority of morphometric MRI studies in dementia have focused on patients with AD and have relied on measurement of specific brain region volumes (Chetelat 2003; Nestor, Scheltens et al. 2004; Csernansky, Wang et al. 2005), especially the hippocampus and the entorhinal cortex, as these regions are affected during the earliest symptomatic stage of AD (Braak, Braak et al. 1998). Voxel-based morphometry has also been used to evaluate voxel-by-voxel brain changes in healthy aging (Resnick, Pham et al. 2003), AD (Ashburner, Csernansky et al. 2003), and FTD (Rosen, Gorno-Tempini et al. 2002; Grossman, McMillan et al. 2004; Whitewell, Josephs et al. 2005). These studies have confirmed patterns of atrophy that predominantly involve medial temporal lobe structures in subjects with mild cognitive impairment and patients with AD, and frontal and temporal regions in patients with FTD or AD, albeit the fronto-temporal atrophy in AD is part of a more widespread pattern of atrophy. They have reinforced the value of MRI as a potential surrogate marker of disease when examining overall differences between groups with and without pathology. However, the diagnostic value of voxel-by-voxel evaluation of image data is limited, since the sensitivity and specificity is inadequate for prediction of the status of an individual subject. Some studies have used conventional multi-variate data reduction and classification methods on PET-FDG imaging data of FTD patients with very promising results (Higdon, Foster et al. 2004). However differential diagnosis between FTD and AD based on structural, rather than functional, scans is a greater challenge. The development of sophisticated high-dimensional image analysis and classification methods in the field of computational neuroanatomy during the past decade can potentially help overcome this challenge (Golland 2002; Lao, Shen et al. 2004; Csernansky, Wang et al. 2005; Davatzikos, Ruparel et al. 2005; Davatzikos, Fan et al. 2006, epub; Fan, Batmanghelich et al. 2008; Lerch, Pruessner et al. 2008; Vemuri, Gunter et al. 2008).
To explore the advantage of this strategy, we conducted a cross-sectional study to determine if high-dimensional image analysis and pattern classification methods could be used to correctly identify individual patients with AD and FTD with high enough sensitivity and specificity to be clinically useful.
Methods
Subjects
MRI scans were obtained from 37 patients with probable AD and 12 patients with a diagnosis of FTD based on standardized clinical criteria (McKhann, Drachman et al. 1984; McKhann, Albert et al. 2001). Patients received a standard evaluation in the Penn Memory Center as part of their enrollment in the University of Pennsylvania Alzheimer’s Center clinical cohort. Each subject’s diagnosis was established after presentation and review at a consensus conference. The 12 patients in the FTD group included 8 whose prominent symptoms at onset were in the area of behavior and executive function impairment, 3 who presented with language impairments (two with primary progressive aphasia and one with a semantic dementia). One patient had a clinical diagnosis of cortico-basilar subtype of FTD (a tauopathy). These numbers are much too small to justify any attempts to correlate the subclasses with the regional atrophy patterns, therefore all FTD patients were grouped together for the purposes of our analysis. All participants provided Institutional Review Board (IRB) approved informed consent.
At the time of imaging the average age of the AD patients was 76.1 and their mean duration of symptoms was 4 years. Their average Mini-Mental State score was 21.5. The average age of the FTD patients was 67.0 and their mean duration of symptoms was 4.2 years. Their average Mini-Mental State score was 20.9. Demographic and clinical information is presented in table 1. Because the FTD patients were younger than AD patients, age- and sex-matched cognitively normal (CN) individuals were, separately selected for the AD and FTD groups. All CN subjects were participants in the Baltimore Longitudinal Study of Aging neuroimaging substudy (Resnick, Goldszal et al. 2000). They were free of central nervous system disorders, severe cardiovascular disease, and metastatic cancer (Resnick, Pham et al. 2003). For the purposes of investigating potential age effects in the group comparisons between AD and FTD, we also formed a subgroup including the 12 younger AD patients whose age range was matched to the FTD patients (average age 69.3).
Table 1.
AD, FTD, and CN demographics and clinical characteristics
| AD (37) | CN for AD(37) | FTD (12) | CN for FTD(12) | |
|---|---|---|---|---|
| Female | 62% | 62% | 50% | 50% |
| White | 78% | 95% | 90% | 100% |
| Age (SD) | 76.1 (7.6) | 76.0 (7.9) | 67 (7.2) | 67.6 (7.2) |
| Education (yrs) | 12 | 16 | 13 | 17 |
| Age at symptom onset (SD)1 | 72.3 (8.1) | N/A | 63.4 (7..5) | N/A |
| Duration (yrs) symptoms prior to MRI (SD) | 4.0 (2.7) | N/A | 4.2 (2.8) | N/A |
| MMS2 (SD) | 21.5 (4.3) | 28.9 (1.1) | 20.9 (8.0) | 29.2 (7.2) |
Standard deviation
Mini-Mental State
MR Imaging and Image Analysis protocol
MR scanning was performed in the out-patient clinical radiology facilities of the Hospital of the University of Pennsylvania and the Johns Hopkins University Hospital on 1.5 Tesla Siemens and GE scanners using 3D gradient echo and 3D SPGR, respectively, T1-weighted sequences that provided adequate discrimination between gray matter (GM), white matter (WM), and cerebrospinal fluid (CSF) for computer-based tissue segmentation. Voxel dimensions were 0.9 × 0.9 × 1.5 mm.
Images were processes according to image analysis methods that have been previously described (Goldszal, Davatzikos et al. 1998; Davatzikos, Genc et al. 2001; Resnick, Davatzikos et al. 2001). Briefly, images were first pre-processed to segment the cerebral hemispheres into GM and WM (Goldszal, Davatzikos et al. 1998). To compare structural patterns across individuals, each segmented image was spatially transformed into a common coordinate system, often called stereotactic space, and the spatial distribution of GM and WM was quantified by the RAVENS maps, whose value at a given brain location measures the amount of GM and WM in the vicinity of that spatial location. Relatively reduced RAVENS value in a brain region reflects relative brain atrophy in that region, and vice-versa. Therefore, RAVENS maps offer a way to perform regional volumetrics on an unbiased, voxel-by-voxel basis, and without the need to make a priori selections of regions of interest (ROI) that may not optimally capture the spatial distribution of brain atrophy.
Feature selection
In preparation for classification described in the following section, a number of features were selected from different brain regions. These features were derived by performing region-by-region principal component analysis at two different scales; the large-scale PCA examined a neighborhood of size 12mm × 12mm × 12mm around each voxel, and the localized scale considered a neighborhood 6mm × 6mm × 6mm around each voxel. 3 GM principal components from the larger scale and 1 from the localized scale were maintained as features representing the neighborhood around a voxel; similarly for WM, thereby leading to 8 features per brain region. Only voxels displaying the largest effect sizes between RAVENS maps of two groups being separated contributed to this feature extraction process; this is equivalent to selecting locally maximal values of the t-statistic, since the latter is a scaled version of the effect size, as we had equal sample sizes in any two groups under comparison. In order to avoid selecting nearby voxels, which would lead to redundant features that are likely to reduce classification performance, once a region around a voxel was selected to contribute PCA features to the classifier, it was completely removed from subsequent analysis. Therefore, a number of brain regions distributed throughout the brain ended up contributing features that were used by the classifier to understand spatial patterns of brain atrophy. A total of 200 features from 25 brain regions were used to represent the pattern of GM and WM distribution throughout the brain.
Pattern analysis and classification
Patterns of the spatial distribution of GM and WM volumes were then examined via a pattern classification technique akin to the one in (Fan, Shen et al. 2005), and patterns specific to AD and FTD determined. The features obtained from the RAVENS maps, as described in the previous section, were used to build a high-dimensional nonlinear classifier for each dementia type (AD and FTD) using nonlinear support vector machines (SVM), which produced an abnormality score: positive values indicating a structural pattern resembling disease, whereas negative values indicate brain structure associated with unimpaired individuals. Leave-one-out cross-validation was used to test the predictive power of this analysis and construct Receiver Operating Characteristic (ROC) curves that summarize the diagnostic value. In the leave-one-out cross-validation analysis, the scan of one pair of age-matched participants was put aside, and the classifier was constructed from the scans of all other individuals. This classifier was then applied to the scans of the left-out pair of individuals, thereby providing a score that was then validated against the clinical diagnosis. This procedure was repeated for all individuals. A key difference of the classifier used herein from the one used in (Fan, Shen et al. 2007) is that in our current study, the SVM kernel size was automatically estimated separately for each individual to be the kernel that yielded the maximum classifier response, i.e. the maximum absolute value of the decision function. Intuitively, this allows the classifier to find the parameter range for which it “best recognizes” the spatial pattern of atrophy presented to it.
In addition, the ability of the classifier to correctly distinguish AD and control MRIs was evaluated by performing a series of ten (10) random splits of the entire set of images from these two groups. In each of the ten repetitions, the classifier was constructed from the first (training) subgroup, and then tested on the second (testing) subgroup. A third classifier was constructed, to separate AD from FTD. Leave-one-out cross-validation was also used for this classifier. Split-sample analysis was not possible as the sample size was not sufficient. However, for the experiments involving AD vs. FTD classification, the leave-one-out procedure was repeated 10 times, each time randomly selecting 12 of the 37 AD patients to be compared against the 12 FTD images.
Results
Spatial pattern of AD- and FTD-specific abnormalities
Fig. 1 shows representative cross-sections of the effect size maps measured for the subtractions CN minus FTD, CN-AD. Fig, 2 shows the difference FTD-AD for all patients (left two columns) and the age-matched FTD and AD patients (right two columns). In general, AD patients displayed the greatest degree of atrophy, relative to their CNs, especially in temporal, frontal (particularly orbitofrontal), and parietal cortical regions, as well as in the cingulate and the insular cortex. FTD patients showed a somewhat similar pattern of atrophy, albeit of slightly smaller magnitude, relative to their own CNs. Atrophy in the FTD patients was relatively more pronounced in the frontal and temporal regions, whereas AD patients displayed relatively more diffuse atrophy throughout the brain, including the parietal cortex. Direct statistical comparison between FTD and AD patients showed that orbitofrontal, temporal, and parietal regions had relatively larger volumes in FTD patients. Areas overlapping the thalamus and the caudate are not considered in our discussion, since tissue segmentation in those regions is not reliable, using T1-weighted images. When restricted to the younger AD patient subgroup that was age-matched to the FTD patients, direct comparison between FTD and AD showed a very similar pattern of regional volumetric differences, albeit of lower magnitude. The only brain regions in which AD patients had larger GM volumes were in white matter areas of the template, where most spatially normalized images have no grey matter; these regions were ignored, since they are artifacts of residual inter-individual variations after spatial normalization.
Fig. 1.
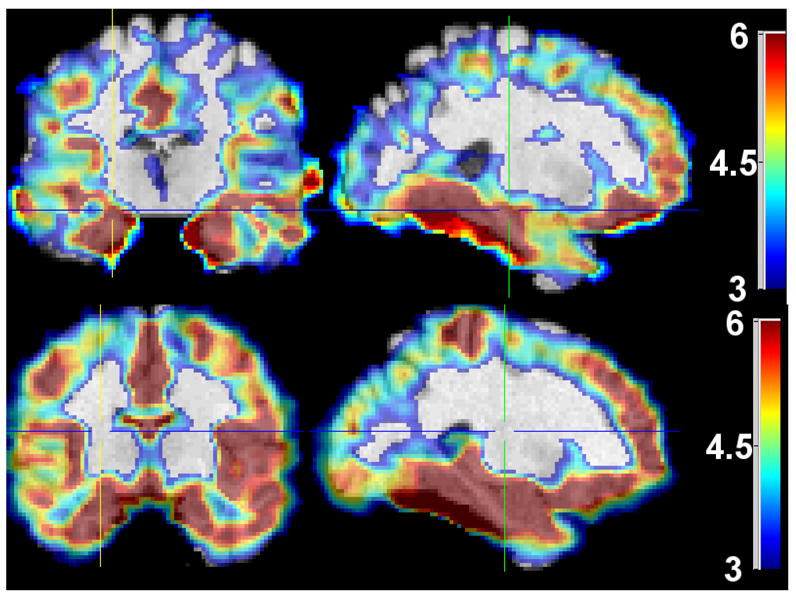
Representative cross-sections of effect sizes calculated for CN minus FTD (top), CN minus AD (bottom). No negative effect sizes were measured for either of the 3 comparisons. Effect sizes above 6 were all mapped to the same color (dark red), and effect sizes less than 3 are not shown. Images are in Radiology convention.
Fig. 2.
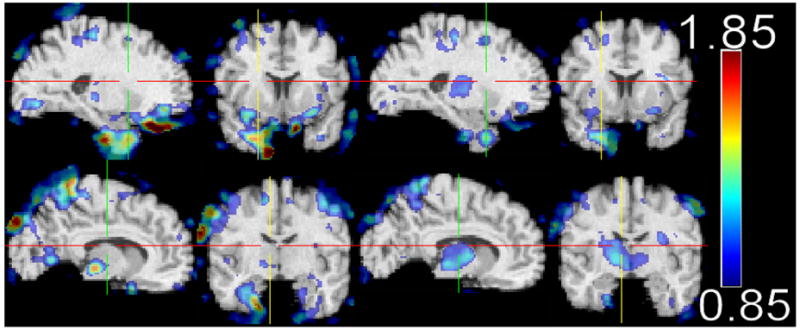
Effect sizes of the difference FTD-AD GM RAVENS maps. The two rows show two different sections through the brain highlighting fronto-temporal (top) and parietal (bottom) regions of reduced volumes. The two left columns are from all AD patients, whereas the right two columns are from relatively younger AD patients that were age-matched to the FTD patients. Images are in Radiology convention.
Since literature reports on asymmetry in FTD are somewhat contradictory with respect to right-left asymmetries, we investigated whether asymmetries can be seen in the spatial distribution of GM and WM in FTD. Fig. 3 shows the GM and WM effect size maps of CN minus FTD. The WM effect size maps (Fig. 3, top) indicated a small asymmetry in the frontal lobe, with the right hemisphere having greater WM atrophy than the left hemisphere. The opposite asymmetry was found in the temporal lobe, where greater GM atrophy was observed in the left hemisphere (Fig. 3, bottom). The black arrows in Fig. 3 roughly point to the regions of these asymmetries.
Fig. 3.
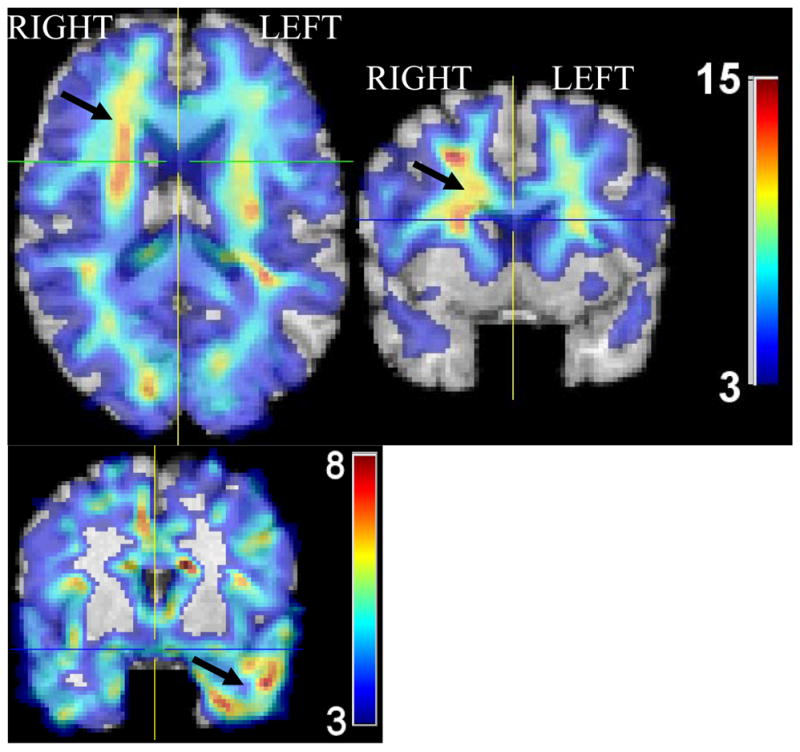
Representative cross-sections of effect size maps showing regional volume differences between CN and FTD patients in regions displaying some inter-hemispheric asymmetry (arrows). Top: white matter. Bottom: gray matter. Some degree of left>right atrophy in the temporal lobe, and right>left atrophy in some frontal lobe areas is evident, albeit it is relatively small. Images in Radiology convention.
Diagnostic Accuracy
Diagnostic accuracy was determined using cross-validation and split sample experiments, as described in the Methods. ROCs were generated by varying the threshold of abnormality score needed to assign a new scan to the control vs. patient category, or to AD vs. FTD. Since the diagnostic accuracies of the classifiers comparing the AD patients with their CNs, and the FTD patients with their own CNs was 100% (sensitivity and specificity equal to 100%), the respective ROCs were step-like (ideal) and had area under the curve equal to 1 (step-function ROCs are not shown). The 10 split sample experiments to classify AD vs. CN yielded an average accuracy of 99.7% (1 misclassified scan in all 10 repetitions).
The differentiation between AD and FTD was much more challenging, as one would expect, in part because of certain commonalities between the underlying patterns of atrophy, and in part because of the limited sample size of the FTD patients. The mean accuracy of the 10 leave-one-out repetitions and their standard deviation was 84.3±4.6%. In order to create a single ROC curve from these 10 repetitions, we averaged the sensitivity and specificity of all 10 trials for each level of the threshold of the abnormality score produced by the classifier. (Varying this threshold allows one to move along the ROC, by changing sensitivity and specificity.) The resultant ROC is shown in Fig. 4. Since there is no healthy control group in this experiment, we adopted the convention that sensitivity reflects the percent of FTD patients that were correctly classified as FTD against a background group of AD, and specificity reflects the percent of AD patients correctly classified as AD. Since the number of misclassified scans was small, we didn’t draw any more specific conclusions as to which patients tended to get misclassified; a larger sample is probably necessary to perform a more systematic analysis of the false classifications.
Fig. 4.
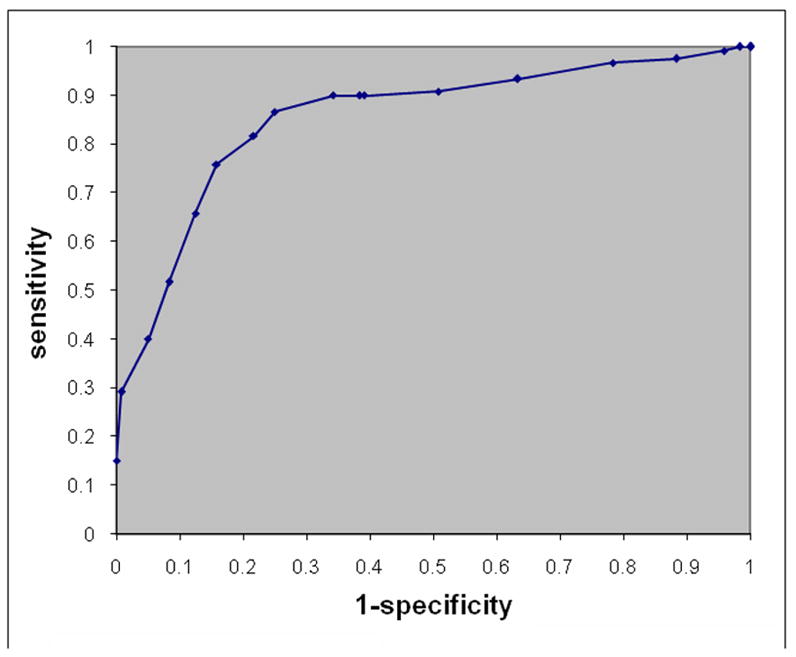
ROC curve showing the sensitivity and specificity in differentiating between FTD and AD. Sensitivity here reflects the percent of FTDs that were correctly classified as FTD against a background group of AD, and specificity reflects the percent of AD participants correctly classified as AD. The ROC curve was obtained by varying the classification threshold applied to the SVM decision function.
In order to better understand the structural differences between FTD and AD, we placed 3 local ROIs (boxes of size 12mm × 12mm × 12mm) on the three clusters that seemed to provide most of the discriminating power: right entorhinal cortex, left and right orbitofrontal cortex. By summing the values of the tissue density maps in those ROIs, we obtained an estimate of their volumes. Fig. 5 shows different scatter plots of these local volumetric measurements.
Fig 5.

Scatter-plots of volumes obtained from local clusters placed on regions of highest effect size between FTD and AD, identified via voxel-based analysis of the tissue density maps of GM: left and right orbitofrontal cortex, and right entorhinal cortex (ERC).
Region of Interest (ROI) and voxel-based analysis
We compared the discrimination power of our pattern analysis approach with relatively more conventional ways of obtaining MRI-based diagnosis, i.e. by measuring the volumes of various ROIs. Brain and ventricles were obtained form the automated segmentation of the MRI into GM, WM and CSF; a ventricular mask is drawn according to standard procedures in our lab to discriminate segmented sulcal CSF from ventricular CSF. Hippocampal volume was determined via previously published and validated atlas warping (Shen and Davatzikos 2002). Fig. 6 shows a representative scatter plot of volumetric measurements from the hippocampus and the total brain volume, which are commonly used in the neuroimaging of AD literature. Although significant group differences exist between AD patients and their controls, individual patient diagnosis is difficult based on such ROI measurements. To further test individual classification accuracy, we used hippocampal, ventricular, and total brain volumes in a multivariate Fisher’s discriminant analysis, using leave-one-out cross-validation and obtained the following classification rates: 82.4% for AD vs. their controls, 75% for FTD vs. their controls, and 70.9% for FTD vs. AD.
Fig. 6.

Scatterplot of the hippocampal volume against the total brain volume (without the cerebellum and brain stem), for FTD, AD, and their respective cognitively normal controls. These measures are commonly used in AD. Although group differences between both demented groups and their controls are measured, especially for the AD group, individual classification in insufficient using these measures, due to the overlap of the scattergrams.
Discussion
Although several studies have established group differences, to our knowledge, the current study is the first to demonstrate that the spatial pattern of MRI-derived brain atrophy in AD and FTD can be used to achieve 100% diagnostic accuracy against healthy controls, on an individual patient basis. Our study adds to recent evidence that high-dimensional multi-variate discriminants can achieve better diagnostic accuracy than conventional measurements. In particular, a recent study using cortical thickness (Lerch, Pruessner et al. 2008) showed very promising results in terms of differentiating AD from normal controls using cortical thickness. (It is not possible to directly compare our findings with the findings in (Lerch, Pruessner et al. 2008), because (Lerch, Pruessner et al. 2008) reported a large number of possible discriminants, each including different brain regions, and therefore was not fully cross-validated with respect to the regions selected in the multi-variate analysis, whereas our approach selected the optimal brain regions in a fully automated and cross-validated framework.) Two other recent studies using regional volumetric measurements and high-dimensional pattern classification on larger samples also showed good separation between AD and normal controls (94% in (Davatzikos, Fan et al. 2006, epub) and 86% in (Vemuri, Gunter et al. 2008)), and an earlier study performed by our group showed separation around 90% between individuals with mild cognitive impairment and normal controls (Davatzikos, Fan et al. 2006, epub).
Although there was a clear separation between demented groups and their controls, as the 100% classification accuracy indicates, this doesn’t imply that an individual admitted in the clinic for examination can be diagnosed with 100% accuracy. This is because we investigated two-group classification problems, i.e. we know that we can distinguish the MRI of a demented individual from a cognitively normal control, however more studies are necessary to construct classifiers that achieve high diagnostic accuracy in a multi-class classification setting as would be required for differential diagnosis among dementia subtypes.
The spatial patterns of distribution of brain tissue that allowed us to accurately detect demented individuals with structural phenotypes specific to AD and FTD involved several structures that are known to be implicated in the two types of dementia examined herein, and included many areas of the temporal and frontal lobes, as well as the parietal lobes and medial structures. The spatial patterns of atrophy found in our study are in agreement with measurements that have been made using histopathology (Braak, Braak et al. 1998), albeit they indicate that our patients had relatively widespread atrophy, likely reflecting a relatively advanced stage of disease. The patterns of atrophy determined via our regional volumetric analysis are only partially in agreement with recent findings in (Du, Schuff et al. 2007) who used cortical thickness as a biomarker. The differences might be methodological, since we didn’t measure cortical thickness in the current study. However the spatial patterns of atrophy in (Du, Schuff et al. 2007) indicate relative sparing of orbitofrontal and much of the temporal cortex, compared to parietal or even occipital cortex, which is very puzzling and might reflect interesting characteristics of cortical thickness, as opposed to cortical volumetrics.
Although several studies examining cross-sectional and longitudinal effects in volumes of brain regions have shown significant group differences between AD or FTD and their respective healthy controls (DeLeon, George et al. 1991; Cuenod, Denys et al. 1993; Golomb, deLeon et al. 1993; Killiany, Moss et al. 1993; Lehericy, Baulac et al. 1994; Laakso, Soininen et al. 1995; Frisoni, Beltramello et al. 1996; Convit, De Leon et al. 1997; deToledo-Morrell, Sullivan et al. 1997; Jack, Petersen et al. 1997; Krasuski, Alexander et al. 1998; Bobinski, de Leon et al. 1999; Jack, Petersen et al. 1999; Killiany, Gomez-Isla et al. 2000; Laakso, Hallikainen et al. 2000; Xu, Jack et al. 2000; De Santi, de Leon et al. 2001; Dickerson, Goncharova et al. 2001; Du, Schuff et al. 2001; Rosen, Prull et al. 2003; Stoub, Bulgakova et al. 2005), the ability to detect structural patterns that enable accurate prediction for specific individuals is ultimately what determines the clinical value of MRI and measurements obtained from it. Our results further confirmed that evaluation of an extensive and optimally determined set of brain regions, which collectively form a spatial pattern of brain atrophy, is necessary and sufficient to obtain high diagnostic accuracy. Measurements restricted to volumes of the hippocampus, ventricles, and brain volume, commonly used in the neuroimaging of AD literature, provided considerably lower predictive accuracy. Lower accuracy was observed even when these measures were evaluated jointly, due to the high overlap of the volume distributions between patients and controls, especially for the FTD group (Fisher’s discriminant classification results reported in the Results section and Fig. 6).
The diagnostic accuracy in distinguishing AD from FTD was clearly lower than diagnosis of dementia against healthy controls. This was anticipated for several reasons. First, structural differences between CN and demented individuals are much larger than those between the FTD and AD groups. Second, a single MRI structural scan provides relatively limited information regarding the dynamic pattern of brain atrophy in these diseases. Since FTD and AD share common characteristics of structural brain change, their differentiation is a challenging task. Finally, this study examined a relatively limited sample size of FTD patients. Learning subtle and complex spatial patterns of brain atrophy typically requires a much larger sample size. Therefore, we believe that future, more extensive studies on larger patient groups will allow these pattern recognition methods to better differentiate between the two types of dementia. Moreover, adding functional imaging, especially PET-FDG, data to the classifier should be expected to significantly increase diagnostic accuracy, as recent studies have demonstrated that even visual rating of PET-FDG can yield up to 89.6% diagnostic accuracy in FTD (Foster, Heidebrink et al. 2007).
A recent study utilizing similar methods based on support vector machines also obtained good diagnostic accuracy between FTD and AD (Kloppel, Stonnington et al. 2008, epub). The results of the two papers both indicate that very good individual classification can be achieved via high-dimensional pattern classification. The two studies had some differences. The current study reports higher classification rates between demented and normal individuals, compared to the study of (Kloppel, Stonnington et al. 2008, epub). The latter study reported better differentiation between the AD and FTD patients, possibly due to the larger sample size which is known to be important in high-dimensional pattern classification studies. Moreover, the demented populations in (Kloppel, Stonnington et al. 2008, epub) were a mixture of clinically and pathologically-defined AD and FTD, as opposed to the strictly clinical definitions adopted in the current study. However, both papers suggest that advanced analysis of MRI scans using machine learning methods can yield diagnostic tools of high sensitivity and specificity. A notable difference between the two papers is that (Kloppel, Stonnington et al. 2008, epub) found that FTD patients had relatively higher atrophy in most fronto-temporal regions, whereas our results indicate that AD patients were more atrophic everywhere. This suggests that larger studies with more power and perhaps more homogeneous patient groups are necessary to better characterize the spatial patterns of atrophy in these patient populations.
The regions that carried most information for discrimination between FTD and AD were in the orbitofrontal GM, and in the entorhinal cortex. Both of these regions are known to be affected in AD; thus, it is not surprising that FTD patients had relatively larger volumes in those regions. However, only the degree of atrophy in the right entorhinal cortex was important for discrimination between FTD and AD. This is in agreement with the trend for asymmetry observed in Fig. 3. Thus, in an individual patient, the finding of asymmetrical atrophy in this location may prove helpful in distinguishing between these two neuropathological conditions. However, these results should only be considered as trends, since we didn’t apply statistical tests for asymmetry by subtracting left from right on a voxel-by-voxel basis. Such tests are not reliable in voxel-based analysis, because asymmetries of the brain used as template don’t allow us to directly compare voxel coordinates that are symmetric to the midline of the brain; more sophisticated methods are necessary for rigorous quantification of asymmetries on a voxel-by-voxel basis. Moreover, we note that such asymmetric atrophy might, in part, relate to unavoidable biases in patient selection, since FTD patients presenting with left temporal lobe atrophy are potentially more likely to present to the clinic earlier with language problems. Finally, asymmetry results might be affected by the pooling of different FTD subtypes, and therefore should be examined in greater detail in future studies that are better powered.
Although both patient groups were age-matched with their respective control groups, FTD patients were younger than AD patients. Therefore, some of their group differences are explained in part by age. However, examination of an age-matched subgroup of the AD patients revealed similar spatial patterns of regional volumetric differences, albeit of lower magnitude. Therefore, these group differences cannot be explained by age only. Moreover, this age difference parallels the typical clinical situation where the challenge to the clinician is the discrimination of FTD and AD. The main goal of this study is to determine whether a single structural MRI can assist in differentiating between FTD and AD dementias in a typical clinical setting. Since FTD patients present to the clinic at relatively younger ages, this fact must be built into a diagnostic tool, as was done in this study.
A persistent problem in high-dimensional analysis, which is particularly prevalent in pattern classification methods, is the risk for overfitting the data, due to the high-dimensionality of the models. The current study guarded against such over-fitting by applying leave-one-out and many split-sample cross-validation steps. This ensured that the classifier was always tested on new datasets, i.e. datasets not previously used for building the classification model. This suggests that these results are likely to generalize well to new patient populations.
The results of this study, as well as results of related studies (Davatzikos, Fan et al. 2006, epub; Fan, Batmanghelich et al. 2008; Vemuri, Gunter et al. 2008; Kloppel, Stonnington et al. 2008, epub), bolster our confidence that the methodology adopted herein can considerably assist in the diagnosis of and differentiation between dementias.
Acknowledgments
We gratefully acknowledge the staff and participants of the BLSA and the Penn Memory Center. This study was supported in part by NIH funding sources R01-AG14971, P30-AG10124, and N01-AG-3-2124, and by the Intramural Research Program, National Institute on Aging, NIH.
Footnotes
Disclosure: The authors report no conflicts of interest.
Statistical Analysis: Conducted by C. Davatzikos
Publisher's Disclaimer: This is a PDF file of an unedited manuscript that has been accepted for publication. As a service to our customers we are providing this early version of the manuscript. The manuscript will undergo copyediting, typesetting, and review of the resulting proof before it is published in its final citable form. Please note that during the production process errors may be discovered which could affect the content, and all legal disclaimers that apply to the journal pertain.
References
- Ashburner J, Csernansky JG, et al. Computer-assisted imaging to assess brain structure in healthy and diseased brains. The Lancet (Neurology) 2003;2(2):79–88. doi: 10.1016/s1474-4422(03)00304-1. [DOI] [PubMed] [Google Scholar]
- Barnes J, Whitwell JL, et al. Measurements of the Amygdala and Hippocampus in Pathologically Confirmed Alzheimer Disease and Frontotemporal Lobar Degeneration. Archives of Neurology. 2006;63(10):1434–1439. doi: 10.1001/archneur.63.10.1434. [DOI] [PubMed] [Google Scholar]
- Bobinski M, de Leon MJ, et al. MRI of entorhinal cortex in mild Alzheimer’s disease. Lancet. 1999;353(9146):38–40. doi: 10.1016/s0140-6736(05)74869-8. [DOI] [PubMed] [Google Scholar]
- Braak H, Braak E, et al. Evolution of Alzheimer’s disease related cortical lesions. Journal of Neural Transmission Supplementum. 1998;54:97–106. doi: 10.1007/978-3-7091-7508-8_9. [DOI] [PubMed] [Google Scholar]
- Chang JL, Lomen-Hoerth C, et al. A voxel-based morphometry study of patterns of brain atrophy in ALS and ALS/FTLD. Neurology. 2005;65(1):75–80. doi: 10.1212/01.wnl.0000167602.38643.29. [DOI] [PubMed] [Google Scholar]
- Chetelat G. Early diagnosis of Alzheiner’s Disease: contribution of structural neuroimaging. Neuroimage. 2003;18(2):525–541. doi: 10.1016/s1053-8119(02)00026-5. [DOI] [PubMed] [Google Scholar]
- Convit A, De Leon MJ, et al. Specific hippocampal volume reductions in individuals at risk for Alzheimer’s disease. Neurobiology of Aging. 1997;18(2):131–8. doi: 10.1016/s0197-4580(97)00001-8. [DOI] [PubMed] [Google Scholar]
- Csernansky JG, Wang L, et al. Preclinical detection of Alzheimer’s disease: hippocampal shape and volume predict dementia onset in the elderly. Neuroimage. 2005;25(3):783–792. doi: 10.1016/j.neuroimage.2004.12.036. [DOI] [PubMed] [Google Scholar]
- Cuenod CA, Denys A, et al. Amygdala atrophy in Alzheimer’s disease. An in vivo magnetic resonance imaging study. Archives of Neurology. 1993;50(9):941–5. doi: 10.1001/archneur.1993.00540090046009. [DOI] [PubMed] [Google Scholar]
- Davatzikos C, Fan Y, et al. Detection of Prodromal Alzheimer’s Disease via Pattern Classification of MRI. Neurobiology of Aging. 2006 doi: 10.1016/j.neurobiolaging.2006.11.010. epub. [DOI] [PMC free article] [PubMed] [Google Scholar]
- Davatzikos C, Genc A, et al. Voxel-Based Morphometry Using the RAVENS Maps: Methods and Validation Using Simulated Longitudinal Atrophy. NeuroImage. 2001;14(6):1361–1369. doi: 10.1006/nimg.2001.0937. [DOI] [PubMed] [Google Scholar]
- Davatzikos C, Ruparel K, et al. Classifying spatial patterns of brain activity for lie-detection. Neuroimage. 2005;28(3):663–668. doi: 10.1016/j.neuroimage.2005.08.009. [DOI] [PubMed] [Google Scholar]
- De Santi S, de Leon MJ, et al. Hippocampal formation glucose metabolism and volume losses in MCI and AD. Neurobiology of Aging. 2001;22(4):529–39. doi: 10.1016/s0197-4580(01)00230-5. [DOI] [PubMed] [Google Scholar]
- DeLeon MJ, George AE, et al. Frequency of hippocampal formation atrophy in normal aging and Alzheimer’s Disease. Neurobiology of Aging. 1991;18:1–11. doi: 10.1016/s0197-4580(96)00213-8. [DOI] [PubMed] [Google Scholar]
- deToledo-Morrell L, Sullivan MP, et al. Alzheimer’s disease: In vivo detection of differential vulnerability of brain regions. Neurobiology of Aging. 1997;18:463–38. doi: 10.1016/s0197-4580(97)00114-0. [DOI] [PubMed] [Google Scholar]
- Dickerson BC, Goncharova I, et al. MRI-derived entorhinal and hippocampal atrophy in incipient and very mild Alzheimer’s disease. Neurobiology of Aging. 2001;22(5):747–54. doi: 10.1016/s0197-4580(01)00271-8. [DOI] [PubMed] [Google Scholar]
- Du AT, Schuff N, et al. Different regional patterns of cortical thinning in Alzheimer’s disease and frontotemporal dementia. Brain. 2007;130(Pt 4):1159–66. doi: 10.1093/brain/awm016. [DOI] [PMC free article] [PubMed] [Google Scholar]
- Du AT, Schuff N, et al. Magnetic resonance imaging of the entorhinal cortex and hippocampus in mild cognitive impairment and Alzheimer’s disease. Journal of Neurology Neurosurgery and Psychiatry. 2001;71(4):441–447. doi: 10.1136/jnnp.71.4.441. [DOI] [PMC free article] [PubMed] [Google Scholar]
- Fan Y, Batmanghelich N, et al. Spatial patterns of brain atrophy in MCI patients, identified via high-dimensional pattern classification, predict subsequent cognitive decline. Neuroimage. 2008;39(4):1731–1743. doi: 10.1016/j.neuroimage.2007.10.031. [DOI] [PMC free article] [PubMed] [Google Scholar]
- Fan Y, Shen D, et al. Classification of Structural Images via High-Dimensional Image Warping, Robust Feature Extraction, and SVM. MICCAI, Palm Springs, California, USA: Springer Berlin/Heidelberg; 2005. [DOI] [PubMed] [Google Scholar]
- Fan Y, Shen D, et al. COMPARE: Classification Of Morphological Patterns using Adaptive Regional Elements. IEEE Transactions on Medical Imaging. 2007;26(1):93–105. doi: 10.1109/TMI.2006.886812. [DOI] [PubMed] [Google Scholar]
- Forman MS, Farmer J, et al. Frontotemporal dementia: Clinicopathological correlations. Annals of Neurology. 2006;59(6):952–962. doi: 10.1002/ana.20873. [DOI] [PMC free article] [PubMed] [Google Scholar]
- Foster NL, Heidebrink JL, et al. FDG-PET improves accuracy in distinguishing frontotemporal dementia and Alzheimer’s disease. Brain. 2007;130(Pt 10):2616–2635. doi: 10.1093/brain/awm177. [DOI] [PubMed] [Google Scholar]
- Fox N, Schott J. Imaging cerebral atrophy: normal ageing to Alzheimer’s disease. Lancet. 2004;363(9406):392–394. doi: 10.1016/S0140-6736(04)15441-X. [DOI] [PubMed] [Google Scholar]
- Frisoni GB, Beltramello A, et al. Linear measures of atrophy in mild Alzheimer disease. American Journal of Neuroradiology. 1996;17(5):913–23. [PMC free article] [PubMed] [Google Scholar]
- Goldszal AF, Davatzikos C, et al. An image processing protocol for the analysis of MR images from an elderly population. Journal of Computer Assisted Tomography. 1998;22(5):827–837. doi: 10.1097/00004728-199809000-00030. [DOI] [PubMed] [Google Scholar]
- Golland P, Fischl B, Spiridon M, Kanwisher N, Buckner RL, Shenton ME, Kikinis R, Dale A, Grimson WEL. Discriminative Analysis for Image-based Studies. MICCAI, Tokyo, Japan: Springer-Verlag GmbH; 2002. [Google Scholar]
- Golomb J, deLeon MJ, et al. Hippocampal atrophy in normal aging: an association with recent memory impairment. Archives of Neurology. 1993;50(9):967–973. doi: 10.1001/archneur.1993.00540090066012. [DOI] [PubMed] [Google Scholar]
- Grossman M, McMillan C, et al. What’s in a name: voxel-based morphometric analyses of MRI and naming difficulty in Alzheimer’s disease, frontotemporal dementia and corticobasal degeneration. Brain. 2004;127(3):628–649. doi: 10.1093/brain/awh075. [DOI] [PubMed] [Google Scholar]
- Higdon R, Foster NL, et al. A comparison of classification methods for differentiating fronto-temporal dementia from Alzheimer’s disease using FDG-PET imaging. Statistics in Medicine. 2004;23(2):315–326. doi: 10.1002/sim.1719. [DOI] [PubMed] [Google Scholar]
- Hodges JR, Davies RR, et al. Clinicopathological correlates in frontotemporal dementia. Annals of Neurology. 2004;56(3):399–406. doi: 10.1002/ana.20203. [DOI] [PubMed] [Google Scholar]
- Jack CR, Jr, Petersen RC, et al. Medial temporal atrophy on MRI in normal aging and very mild Alzheimer’s disease. Neurology. 1997;49(3):786–94. doi: 10.1212/wnl.49.3.786. [DOI] [PMC free article] [PubMed] [Google Scholar]
- Jack CR, Petersen RC, et al. Prediction of AD with MRI-based hippocampal volume in mild cognitive impairment. Neurology. 1999;52(7):1397–403. doi: 10.1212/wnl.52.7.1397. [DOI] [PMC free article] [PubMed] [Google Scholar]
- Killiany RJ, Gomez-Isla T, et al. Use of Structural Magnetic Resonance Imaging to Predict Who Will Get Alzheimer’s disease. Annals of Neurology. 2000;47(4):430–439. [PubMed] [Google Scholar]
- Killiany RJ, Moss MB, et al. Temporal lobe regions on magnetic resonance imaging identify patients with early Alzheimer’s disease. Archives of Neurology. 1993;50(9):949–54. doi: 10.1001/archneur.1993.00540090052010. [DOI] [PubMed] [Google Scholar]
- Kloppel S, Stonnington CM, et al. Automatic classification of MR scans in Alzheimer’s disease. Brain. 2008 doi: 10.1093/brain/awm319. epub. [DOI] [PMC free article] [PubMed] [Google Scholar]
- Knopman DS, Boeve BF, et al. Antemortem diagnosis of frontotemporal lobar degeneration. Annals of Neurology. 2005;57(4):480–488. doi: 10.1002/ana.20425. [DOI] [PubMed] [Google Scholar]
- Krasuski JS, Alexander GE, et al. Volumes of medial temporal lobe structures in patients with Alzheimer’s disease and mild cognitive impairment (and in healthy controls) Biological Psychiatry. 1998;43(1):60–8. doi: 10.1016/s0006-3223(97)00013-9. [DOI] [PubMed] [Google Scholar]
- Laakso MP, Hallikainen M, et al. Diagnosis of Alzheimer’s disease: MRI of the hippocampus vs delayed recall. Neuropsychologia. 2000;38(5):579–84. doi: 10.1016/s0028-3932(99)00111-6. [DOI] [PubMed] [Google Scholar]
- Laakso MP, Soininen H, et al. Volumes of hippocampus, amygdala and frontal lobes in the MRI-based diagnosis of early Alzheimer’s disease: correlation with memory functions. Journal of neural transmission Parkinson’s disease and dementia section. 1995;9(1):73–86. doi: 10.1007/BF02252964. [DOI] [PubMed] [Google Scholar]
- Lao Z, Shen D, et al. Morphological classification of brains via high-dimensional shape transformations and machine learning methods. Neuroimage. 2004;21(1):46–57. doi: 10.1016/j.neuroimage.2003.09.027. [DOI] [PubMed] [Google Scholar]
- Lehericy S, Baulac M, et al. Amygdalohippocampal MR volume measurements in the early stages of Alzheimer disease. American Journal of Neuroradiology. 1994;15(5):929–37. [PMC free article] [PubMed] [Google Scholar]
- Lerch JP, Pruessner J, et al. Automated cortical thickness measurements from MRI can accurately separate Alzheimer’s patients from normal elderly controls. Neurobiology of Aging. 2008;29(1):23–30. doi: 10.1016/j.neurobiolaging.2006.09.013. [DOI] [PubMed] [Google Scholar]
- Likeman M, V, Anderson M, et al. Visual Assessment of Atrophy on Magnetic Resonance Imaging in the Diagnosis of Pathologically Confirmed Young-Onset Dementias. Archives of Neurology. 2005;62(9):1410–1415. doi: 10.1001/archneur.62.9.1410. [DOI] [PubMed] [Google Scholar]
- McKhann G, Drachman D, et al. Clinical diagnosis of Alzheimer’s disease: Report of the NINCDS-ADRDA Work Group under the auspices of the Department of Health and Human Services Task Force on Alzheimer’s Disease. Neurology. 1984;34(7):939–944. doi: 10.1212/wnl.34.7.939. [DOI] [PubMed] [Google Scholar]
- McKhann GM, Albert MS, et al. Clinical and Pathological Diagnosis of Frontotemporal Dementia: Report of the Work Group on Frontotemporal Dementia and Pick’s Disease. Archives of Neurology. 2001;58(11):1803–1809. doi: 10.1001/archneur.58.11.1803. [DOI] [PubMed] [Google Scholar]
- Nestor PJ, Scheltens P, et al. Advances in the early detection of Alzheimer’s disease. Nature Reviews Neuroscience. 2004;5:S34–S41. doi: 10.1038/nrn1433. [DOI] [PubMed] [Google Scholar]
- Resnick S, Davatzikos C, et al. Longitudinal changes in MRI volumes in older adults. Neurobiology of Aging. 2001;22(2):5. [Google Scholar]
- Resnick SM, Goldszal A, et al. One-year age changes in MRI brain volumes in older adults. Cerebral Cortex. 2000;10(5):464–472. doi: 10.1093/cercor/10.5.464. [DOI] [PubMed] [Google Scholar]
- Resnick SM, Pham DL, et al. Longitudinal Magnetic Resonance Imaging Studies of Older Adults: A Shrinking Brain. The Journal of Neuroscience. 2003;23(8):295–301. doi: 10.1523/JNEUROSCI.23-08-03295.2003. [DOI] [PMC free article] [PubMed] [Google Scholar]
- Rosen AC, Prull MW, et al. Differential associations between entorhinal and hippocampal volumes and memory performance in older adults. Behavioral Neuroscience. 2003;117(6):1150–60. doi: 10.1037/0735-7044.117.6.1150. [DOI] [PubMed] [Google Scholar]
- Rosen HJ, Gorno-Tempini ML, et al. Patterns of brain atrophy in frontotemporal dementia and semantic dementia. Neurology. 2002;58(2):198–208. doi: 10.1212/wnl.58.2.198. [DOI] [PubMed] [Google Scholar]
- Shen D, Davatzikos C. HAMMER: Hierarchical attribute matching mechanism for elastic registration. IEEE Transactions on Medical Imaging. 2002;21(11):1421–1439. doi: 10.1109/TMI.2002.803111. [DOI] [PubMed] [Google Scholar]
- Short RA, Broderick DF, et al. Different Patterns of Magnetic Resonance Imaging Atrophy for Frontotemporal Lobar Degeneration Syndromes. Archives of Neurology. 2005;62(7):1106–1110. doi: 10.1001/archneur.62.7.1106. [DOI] [PubMed] [Google Scholar]
- Stoub TR, Bulgakova M, et al. MRI predictors of risk of incident Alzheimer disease: A longitudinal study. Neurology. 2005;64(9):1520–1524. doi: 10.1212/01.WNL.0000160089.43264.1A. [DOI] [PubMed] [Google Scholar]
- Thompson PM, Mega MS, et al. Cortical Change in Alzheimer’s Disease Detected with a Disease-specific Population-based Brain Atlas. Cerebral Cortex. 2001;11(1):1–16. doi: 10.1093/cercor/11.1.1. [DOI] [PubMed] [Google Scholar]
- Varma AR, Adams W, et al. Diagnostic patterns of regional atrophy on MRI and regional cerebral blood flow change on SPECT in young onset patients with Alzheimer’s disease, frontotemporal dementia and vascular dementia. Acta neurologica scandinavica. 2002;105(4):261–269. doi: 10.1034/j.1600-0404.2002.1o148.x. [DOI] [PubMed] [Google Scholar]
- Vemuri P, Gunter JL, et al. Alzheimer’s disease diagnosis in individual subjects using structural MR images: Validation studies. Neuroimage. 2008;39(3):1186–1197. doi: 10.1016/j.neuroimage.2007.09.073. [DOI] [PMC free article] [PubMed] [Google Scholar]
- Whitewell JL, Josephs KA, et al. Magnetic Resonance Imaging Signatures of Tissue Pathology in Frontotetemporal Dementia. Archives of neurology. 2005;62(9):1402–1408. doi: 10.1001/archneur.62.9.1402. [DOI] [PubMed] [Google Scholar]
- Xu Y, Jack CR, Jr, et al. Usefulness of MRI measures of entorhinal cortex versus hippocampus in AD. Neurology. 2000;54(9):1760–1767. doi: 10.1212/wnl.54.9.1760. [DOI] [PubMed] [Google Scholar]