

Abstract
SJL mice colonized with RcsX lymphoma cells undergo a rapid inflammatory response associated with biological and physiological effects including increased nitric oxide production and mutations in spleen DNA. By two weeks post-colonization, these changes were accompanied by both up- and down-regulation of a number of plasma proteins. In the experiments reported here, plasma from individual SJL mice were analyzed at several time-points over the two-week period in order to determine if there were sets of proteins whose expression varied in concert and thus might serve as early biomarkers for inflammation-related disorders. Samples were collected just prior to injection of the RcsX cells and then after 4, 8, and 12 days. Albumin and immunoglobulins were depleted and the samples were resolved by 1D gel electrophoresis. The gels were cut into 20 slices, and the proteins digested in-gel with trypsin. The digests were treated with iTRAQ reagents and then analyzed by LC/MS/MS. The resulting data were processed with two software packages, i.e., ProQuant and Spectrum Mill, and then subjected to K-means cluster analysis (K=4). The four clusters revealed a set of highly up-regulated proteins, a set of progressively up-regulated proteins, a set with no major changes, and a set that declined. The first cluster included haptoglobin, and serum amyloid A; the second included groups with several functions including protease inhibition, cell motility, and transport. The iTRAQ results for a selection of the up-regulated proteins, including haptoglobin, hemopexin, serum amyloid P component and ceruloplasmin, were confirmed with Western blots. Prominent down-regulated proteins included esterase-1, paraoxonase, and alpha-2-macroglobulin. Approximately 50% of the upregulated proteins are canonical acute phase proteins, while the remainder are regulated by the Nrf2 transcription factor.
Keywords: inflammation, SJL mouse, lymphoma, iTRAQ, tumor progression, biomarker, cluster analysis, acute phase proteins
Introduction
A major aim of proteomics is the detection of candidate biomarkers that can be used for the development of analytical methods for diagnosis and for drug discovery. With a few exceptions 1–3, most investigations have relied on comparisons of normal vs. diseased populations, although knowledge of changes in protein levels during the progression from normal to disease states within an individual might reveal useful subtleties in biomarker behavior. In this context, SJL mice - which were derived from the Swiss–Webster strain 4 - are a good choice as a model for autoimmune diseases since they exhibit multiple immunological disorders, e.g., paraproteinemia 5 and myopathy 6,7. In a previous report, we described a comparative plasma proteome analysis, based on albumin and immunoglobulin depletion, using this mouse model 8. In those studies, we compared the plasma proteome of normal vs different sets of tumor-bearing SJL mice that were at the final stage of tumor development. In the present study, in order to avoid inter-individual variations, and to define changes in the proteome over time, we followed the plasma proteome in individual mice before and during tumor development.
The RCS tumor cells express a unique superantigen (vSAG), encoded by an endogenous MMTV provirus that stimulates Vβ16+ Th cells 9 to secrete a cytokine (γ-interferon) 10, that is required for growth of the lymphoma cells in vivo and in vitro 11,12. Intraperitoneal injection of RcsX cells into naïve SJL mice leads to rapid tumor growth as well as infiltration of host T cells into the lymph nodes, spleen and liver, resulting in morbidity after about 15 days 13. Under pathophysiological conditions, excess nitric oxide (NO) and/or other reactive species generated during chronic inflammation by macrophages induce cellular damage in close proximity to the activated macrophages 14,15 and release cellular proteins into the blood 8. Earlier, plasma proteomic analysis using a 1D-Gel-LC-MS/MS-based approach, revealed that inflammation caused the levels of several serum/plasma proteins, including many acute phase proteins (APPs), to change (up-regulated or downregulated) 8.
In the present work, we used iTRAQ reagents to label and quantitate 1D-gel - separated proteins from plasma samples collected at three different time points after injection of RcsX tumor cells into SJL mice. In our earlier studies we used a 1D-Gel- LC-MS/MS approach, with semi-quantitative data analysis via Spectrum Mill, to compare the plasma proteome of normal vs. RcsX- tumor bearing SJL mice 8. In this work, the objective was to assess potential differences among normal and tumor-related plasma samples collected at different stages in individual mice. After collection of an initial plasma sample, mice were injected intra-peritoneally with RcsX tumor cells and additional plasma samples were collected at days 4, 8 and 12. Following depletion of albumin and immunoglobulins, 8,16 gel lanes were cut into 20 equal pieces, and the proteins in selected slices were digested in-gel and labeled with commercial iTRAQ multiplexing reagents. After pooling labeled peptides from respective gel slices of all the lanes, samples were subjected to LC-MS/MS analysis. In the previous work we demonstrated that the 1D-gel-LC-MS/MS method gives a semi-quantitative comparison of multiple samples and identified several potential candidate biomarkers. Here we demonstrate a more precise detection of proteomic changes in plasma using a quantitative approach. Many of the proteins we quantified are known inflammatory response or acute phase mediators and some are new candidate marker proteins. We also validated some of the candidates using Western blot analysis.
Experimental Methods (shown schematically in Figure 1)
Figure 1.
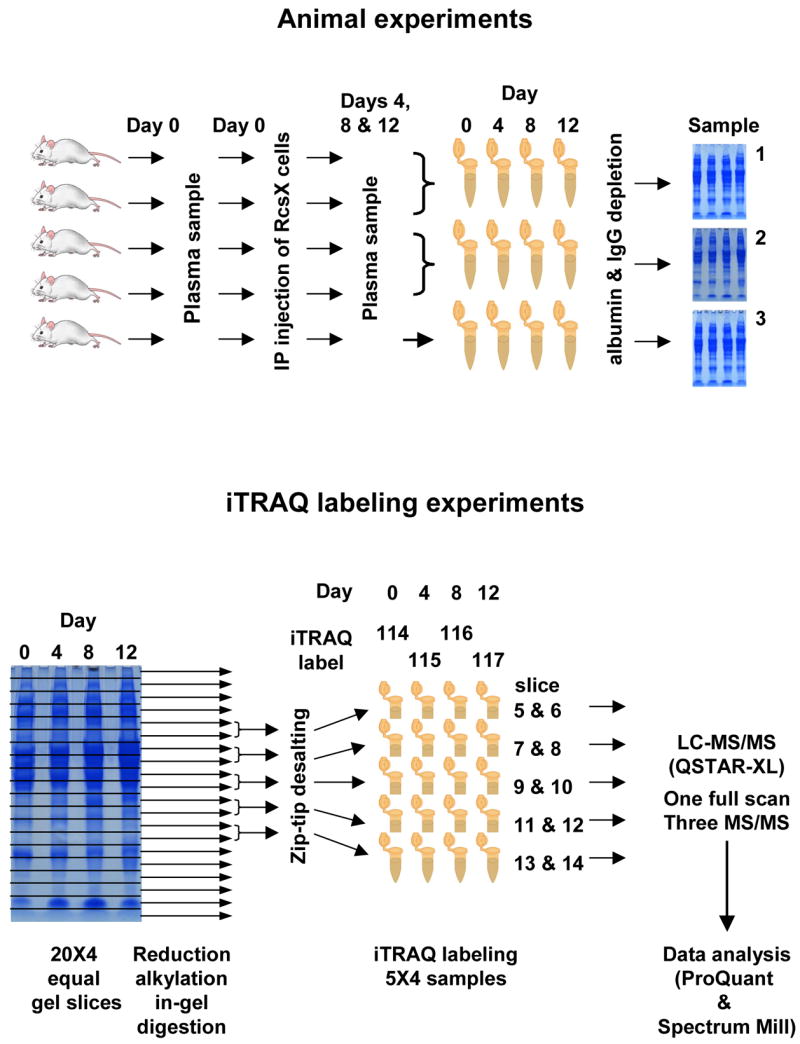
Schematic summary of the experimental design. Animals were injected with RcsX tumor cells on day 0, and plasma sampled on days 0,4, 8, and 12. Samples from mice 1 and 2, and 3 and 4, were combined; these samples and those from mouse 5 were analyzed by 1D gel electrophoresis. The gels were cut into twenty equal slices and slices from the mid range were combined as shown, reduced, alkylated, and digested in-gel. Samples from days 0, 4, 8, and 12 were labeled with iTRAQ reporters 114, 115, 116, and 117, respectively, and analyzed by LC/MS/MS.
Animals and Collection of Samples
Male SJL mice (n = 5), 8 weeks old (The Jackson Laboratory), were fed a low-nitrate control diet (AYN-76A, Bio-Serve, Frenchtown, NJ), then weighed and placed individually in cages. Two days later, blood samples (0 time point) from individual mice were collected via orbital bleeding with glass capillaries. After collecting the initial (control) blood samples, the mice were injected intraperitoneally with 0.2 mL of PBS containing 107 cells of the RcsX line (provided by N. Ponzio, University of New Jersey Medical Center, Newark, NJ), isolated from lymph nodes of mice bearing the actively growing tumor. The animals were maintained under normal feeding conditions. Blood collection was repeated on the 4th and 8th day by orbital bleeding and on the 12th day by cardiac puncture. During all blood-sampling the animals were anaesthetized with isoflurane. Samples were collected in the morning into EDTA-containing tubes and the plasma was stored at − 80 °C for later analysis.
Protein quantitation
Total protein content in the mouse plasma was determined with a commercial bicinchoninic acid (BCA) protein assay kit (Pierce). Duplicate samples of mouse plasma diluted 1000 times were prepared and analyzed in clear 96 well plates (Corning) by reading the absorbance at 562 nm with an automated plate reader (Molecular Devices Corporation).
Albumin and IgG depletion
Albumin and IgGs were depleted as described earlier 8. Briefly, protein A-agarose beads (200 μL) (Santa Cruz Biotechnology) were added to 0.45 μm centrifugal filter units (Millipore), washed twice in PBS and incubated for 2 hours with rabbit polyclonal IgG anti-mouse albumin antibody (100 μL) (Research Diagnostics). After coupling, the immunoaffinity beads were washed several times with PBS. For the removal of both albumin and IgGs in a single column, 0.15 bed volumes of protein G Agarose beads were added to the immunoaffinity resin. Mouse plasma containing 100 μg of protein (pooled from two mice with 50 μg protein from each except one mouse from which 100 μg was analyzed separately) was loaded onto an immunoaffinity spin column in 200 μL of PBS. After 2 hours of incubation at room temperature with constant rotation, the columns were spun down (20 s) and the flow-through was collected. The columns were then washed three times, first with 100 μL of PBS, followed by two washes with 400 μL of PBS, and all washes were combined as the unbound fraction of proteins. Pooled fractions were desalted by using 3,000 Da cut-off microcon centrifugal filter units and then concentrated to dryness in a SpeedVac.
SDS-PAGE and in-gel trypsin digestion
The dried samples were dissolved in 25 μL of sample buffer (2% SDS, 10% glycerol, 62.5 mM Tris-HCl pH 6.8, 5% β-mercaptoethanol, 0.02% bromophenol blue), boiled 5 minutes and separated on 8- 16% acrylamide gradient gels (Life-Gels), with a lane for each time-point. After staining with SimplyBlue SafeStain (Invitrogen), the individual gel lanes were cut into 20 equal slices. Slices five to fourteen were digested in-gel with trypsin in NH4HCO3 buffer, and peptides were extracted as described earlier by Shevchenko, et al., 17, with a few minor modifications 18. Peptides were sequentially extracted in 20 μL 20% formic acid, 100 μL 50 mM NH4HCO3 and 0.1% TFA in H2O:acetonitrile (1:1) by sonication for 5 minutes. Slices 5 and 6, 7 and 8, 9 and 10, 11 and 12 and 13 and 14 were pooled and dried on a SpeedVac. Prior to iTRAQ-labeling, traces of ammonium bicarbonate were removed with C18 ZipTips (Millipore).
iTRAQ labeling
Samples were dissolved in 10 μL triethylammonium bicarbonate (TEAB), and labeled with different isobaric tags (114, 115, 116 and 117 for control, day 4, day 8 and day 12, respectively) according to the manufacturer’s instructions. In this study each vial was used for labeling two sets of plasma samples and in each set there were 4 different time points. The samples were vortexed at room temperature for 1 h and the aligned samples were pooled and evaporated to dryness, then dissolved in 10 μL 0.1% TFA and desalted with C18 ZipTips.
LC/MS/MS analysis
The iTRAQ-labeled peptides were analyzed on a QSTAR XL quadrupole-time of flight mass spectrometer (Applied Biosystems) equipped with a nanospray source (Proxeon Biosystems, Odense, Denmark) using a capillary LC system (Agilent Technologies). Samples were manually injected via a Rheodyne injector (0.5 μL internal loop) connected to a fused-silica capillary column (75 μm i.d. × 360 μm o.d.; 14 cm length, tip 8 μm, New Objective, Worburn, MA) packed in-house with 5 μm, 300 Å pore size, C18 silica-bonded stationary phase (Vydac). The flow rate was ~120 -140 nL/min with a 3-minute linear gradient of 0 to 10% buffer B (acetonitrile with 0.1% acetic acid and 5% methanol), a 87-minute linear gradient to 80% buffer B, a 10-minute linear gradient to 90% buffer B, an isocratic period of 10 minutes and then ramped back to the initial conditions [100% buffer A (water with 0.1% acetic acid)] in the next 90 minutes.
Information-dependent acquisitions (IDA) were performed with a total cycle time of 11 seconds. Each cycle began with a survey scan of 2 sec (m/z 400–1800, 400–900, 850–1350) and the three most abundant ions (with charge states +2, +3, and +4) exceeding 15 counts were selected for MS/MS (3 sec, m/z 100–2000). The data was acquired at low resolution with settings using a 0.1 drop from the unit offset values providing a window of −1/+2 amu from the product ion. Isotopes were excluded as well as former target ions for 60 seconds. Rolling collision energy was used to promote fragmentation by altering the slope and intercept given in the IDA Collision Energy Parameters script. The electrospray voltage was set to around 2.3 kV, the collision gas pressure setting was 6 and the mass tolerance was 50 mmu.
Data analysis
To identify and quantify proteins, data from the iTRAQ-labeled samples were analyzed using ProQuant 1.1 (Applied Biosystems). Within ProQuant a search database was created that allowed identification of N-terminal residues as well as internal lysine and tyrosine residues carrying iTRAQ tags. The search was done against the NCBInr protein database, carbamidomethylation of cysteines were set as a fixed modification, and one missed cleavage was allowed. The search parameters were set with a MS tolerance at 0.15 Da and a MS/MS tolerance at 0.1 Da and only peptides with confidence of 20 or more were included as described previously 19. The data was also analyzed using Spectrum Mill A3.01a data analysis software (Agilent Technologies) in order to compare 3 different data sets and iTRAQ quantitation. Data was normalized to the day 0 time point. K-means cluster analyses were performed on the natural-logged data using the tools in the statistical software SPSS 13.0 (SPSS inc). Cluster numbers between 2 and 9 were evaluated.
Western blot analysis
Plasma samples were separated by 10% SDS-PAGE (Bio-Rad) and then transferred onto PVDF membranes (Bio-Rad) for 2.5 hours at 40V (Bio-Rad). Membranes were blocked with 3% milk solution containing 0.05% Tween 20 in PBS for 3 hours and incubated overnight with primary antibody (1:10000 dilution) at 4 °C. The primary antibodies included rabbit anti-rat haptoglobin (Immunology Consultants Laboratory), sheep anti-mouse serum amyloid component P (SAP) (Alpha Diagnostics International), chicken anti-mouse hemopexin (Immunology Consultants Laboratory), sheep anti-human ceruloplasmin and sheep anti-human C4 (Abcam)). The membranes were incubated with peroxidase-conjugated secondary antibodies at 1:20000 or 1:50000 dilutions after washing in 0.05% Tween 20 in PBS and detected using Supersignal West Femto chemiluminescence reagent (Pierce). The secondary antibodies were HRP conjugated rabbit anti-sheep IgG (Abcam), donkey anti-rabbit (Amersham Biosciences) and goat anti-chicken IgY (Immunology Consultants Laboratory)). Imaging and quantitation were performed either on Bio-Rad Flour-S multi-imager using QuantityOne software or on Kodak Image Staion 1000.
Peptide loss during desalting
One gel slice (from a gel prepared for this experiment containing mouse plasma proteins) was destained, reduced, alkylated, the proteins trypsin digested and finally extracted from the gel matrix according to the procedure described above with one exception, i.e., the peptides were extracted with 100 mM TEAB. The pooled solution was divided into two aliquots (220 μL) and each was evaporated to dryness. One part was dissolved in 10 μL 0.1% TFA, ZipTipped and then evaporated to dryness before iTRAQ labeling. Both aliquots were dissolved in 10 μlLof buffer and then iTRAQ labeled with the 114 or 115 Da reporter for the untreated sample and the 116 or 117 Da reporter for the desalted sample. The samples were mixed and then analyzed by LC/MS/MS. The experiment was repeated three times with different gel slices.
Results and Discussion
In-gel-based iTRAQ
The iTRAQ tags were originally developed for experiments based on liquid chromatography and digestion in solution 20. One of our objectives, therefore, was to determine the effect of a gel-based method on the variability of the iTRAQ ratios. Three different steps in the method, i.e., the ZipTip procedure, the isolation procedure by SDS-PAGE, and the albumin depletion, were evaluated. The loss of peptides during the ZipTip procedure was assessed by analyzing a 1:1 split sample of TEAB-extracted peptides in which one aliquot of the sample was ZipTipped prior to the iTRAQ labeling and the other was not. After labeling, the aliquots were remixed. The iTRAQ ratios were calculated in ProQuant for each identified peptide (normalized to the un-ZipTipped sample). The average iTRAQ ratio and the 95% confidence interval (CI) for identified mouse peptides (i.e., those with scores above the 2.0 cutoff; corresponding to a 99% confidence) of all three samples was 0.85 (95% CI=0.83 to 0.87). The average iTRAQ ratio of sample one was 0.91 (95% CI=0.87 to 0.95; N=98 peptides), sample two was 0.81 (95% CI=0.77 to 0.85; N=146 peptides) and sample three was 0.85 (95% CI=0.82 to 0.88; N=174 peptides). This corresponds to a statistically significant loss of peptides since the confidence interval did not include 1, which would have been the ratio if no loss had been observed. A one-way analysis of variance test of the means of the three replicates showed that the differences of means were statistically significant. The loss of peptides was thus not consistent among samples. However, the differences of means between the samples were fairly small and the narrow confidence limits come from the large data set of peptides included in the experiment.
To evaluate if the alignment of different lanes in a gel affected the quantitation, 4 aliquots of a 10 μL protein mixture containing 200 pmol mouse albumin, 20 pmol transferrin, 100 pmol horse myoglobin, 100 pmol bovine β-casein, 100 pmol horse cytochrome c and bovine histones (all from Sigma) were separated on a 8–16% acrylamide gradient gel. Four slices evenly distributed across the gel lane were cut out from each lane and processed as described earlier. Following extraction, the solutions from each lane were pooled before iTRAQ labeling (lane 2: 114 Da reporter; lane 4: 115 Da reporter; lane 6: 116 Da reporter; lane 8: 117 Da reporter). The iTRAQ labeled samples from all lanes were then pooled, analyzed and the data processed in ProQuant (Table 1). The overall error in this experiment varies between the proteins detected, ranging between 10 and 230%. Variability is introduced due to the error of the ZipTip procedure and also due to not completely aligned proteins. However, in this study we analyzed peptides from pooled slices and then took the average ratio from the combined results of ten gel slices thus compensating for any deviation in alignment. As noted earlier, albumin and IgG antibodies were removed in order to enhance detection of low-abundance proteins 21. To determine if this treatment affected the variability and recovery of the iTRAQ ratios, four aliquots of the previously described protein mixture were used and the gel separation/peptide extraction experiment was repeated with the exceptions that the samples were depleted of albumin before SDS-PAGE isolation and that the bands were cut more or less to fit the staining, rather than by following a template. The results of the two highest scoring proteins, which were the only two proteins identified in both experiments, indicated that the depletion did not add any major errors to the variability of the iTRAQ ratios (Table 2). Thus, it was shown that minor errors were introduced by the ZipTip procedure and also that alignment of proteins in the gel was likely to introduce major errors on the gel slice level but the latter errors do not represent a problem in our study since average iTRAQ ratios based on the results from several gel slices combined were used. However, the variabilities of the method probably make it unsuitable for detecting small changes in up or down regulation. Recently another study was performed using gel-based proteomics and iTRAQ 22. This group analyzed test samples in parallel with ratios 1:1:1:1 and concluded that the observed ratios were close to the expected ones.
Table 1.
To evaluate the variability of iTRAQ ratios induced by using a gel-based procedure, four aliquots of a protein mixture were analyzed in parallel. iTRAQ ratios for proteins from each of the four lanes are tabulated. Protein score >2.0 identified proteins with >99%. (The theoretical ratios between the samples were 1:1:1:1)
| Ratio | ||||||
|---|---|---|---|---|---|---|
| Protein ID | Accession # | # Pept | Score | 115:114 (95% CI) | 116:114 (95% CI) | 117:114 (95% CI) |
| transferrin | gi|31415705 | 37 | 77.2 | 1.2 (1.2; 1.3) | 1.2 (1.2; 1.3) | 1.1 (1.0; 1.1) |
| albumin 1 | gi|33859506 | 32 | 58.4 | 1.5 (1.4; 1.5) | 1.6 (1.5; 1.7) | 1.4 (1.3; 1.5) |
| chain A, Myoglobin | gi|39654267 | 9 | 23.7 | 1.6 (1.4; 1.8 ) | 1.4 (1.1; 1.7) | 0.68 (0.57; 0.81) |
| beta casein-bovine | gi|226030 | 4 | 7.1 | 1.6 (1.2; 2.0) | 1.7 (1.5; 2.0) | 0.85 (0.67; 1.1) |
Table 2.
Analysis of the variability induced by the albumin depletion step by analyzing four aliquots of a protein mixture in parallel starting with depletion of albumin and then SDS-PAGE separation. iTRAQ ratios for proteins in slices cut out from the gel are tabulated. Protein scores >2.0 identified proteins with >99% confidence. (The theoretical ratios between the samples were 1:1:1:1)
| Ratio | ||||||
|---|---|---|---|---|---|---|
| Protein ID | Accession # | # Pept | Score | 115:114 (95% CI) | 116:114 (95% CI) | 117:114 (95% CI) |
| transferrin | gi|31415705 | 34 | 71.6 | 1.1 (1.1; 1.2) | 0.82 (0.76; 0.88) | 0.88 (0.83; 0.93) |
| chain A, Myoglobin | gi|39654267 | 9 | 20.8 | 1.1 (1.0; 1.3) | 0.81 (0.69; 0.94) | 0.92 (0.81; 1.0) |
Comparative Proteomic Analysis of SJL Mouse Plasma Samples Following RcsX-Tumor Cell Injection using iTRAQ
A fundamental problem in biomarker discovery is inter-individual variations in protein expression. Most commonly, proteomics studies have compared samples collected in groups (e.g. control vs. disease) rather than in individuals. Hu, et al., 1 and Nelsestuen, et al., 3 addressed these issues in human cerebrospinal fluid and plasma samples. Qian, et al., quantitatively compared the changes in plasma proteome before and after administering lipopolysaccharide (LPS) in same individual using 16O/18O labeling and the Accurate Mass and Time Tag approach 2,23. In these studies, either the samples were collected only at two time points or samples were processed and analyzed separately. In humans, it is possible to study inter- and intra-individual variations in simple cases, e.g., inflammation induced by LPS, but it is difficult to recruit human volunteers to study complex disorders such as cancer or heart diseases. In the present study, we identified the changes in the plasma proteome of SJL mice before and after intra-peritoneal injection of RcsX lymphoma cells, using iTRAQ labeling on samples collected at four different time points. Blood samples from each mouse were collected before and 4, 8 and 12 days after injection (five mice). A total of 100 μg of plasma proteins were pooled from two separate mouse samples at each time point and all three sample sets were depleted of albumin and immunoglobulins. Depleted samples were separated on 8–16% SDS-PAGE gel and each gel lane was cut into 20 gel slices. Anderson, et al., reported that most of the human plasma proteins fall between 40 and 100 kDa 24. Based on this report and on our earlier experience with the mouse plasma proteome 8, for this study we used ten gel pieces from the center of the gel lane (Figure 1). Most commonly, iTRAQ reagents are used to label large amounts of protein and the reagents were initially developed to label an entire proteome followed by peptide fractionation with strong cation exchange columns before MS analysis. In the present study, however, proteins were pre-fractionated using 1D gels and, in each gel slice, we expected ~2–5 μg of proteins. Due to the cost of iTRAQ reagents and their poor labeling efficiency at low protein concentrations (where more iTRAQ reagent is required), we combined the center ten gel slices two by two into five samples. Since albumin was depleted and is down-regulated during inflammation 25, the amount of protein left in the sample differed between the different days, the data was therefore also analyzed using volume-adjusted ratios. This, however, did not significantly affect the results (data not shown).
The LC/MS/MS data from all sample sets were merged and processed in ProQuant (Applied Biosystems) for protein identification and iTRAQ ratio quantification (Table 3). To verify the ProQuant results, the data were also analyzed using the latest version of Spectrum Mill (Agilent) which can analyze iTRAQ data and which also gives a low false positive rate ( typically <1%) due to a reverse data base search. Using Spectrum Mill, a total of 157 proteins were found of which 98 were detected in least in two data sets (summarized in Figure 2, details in supplementary table 1). The number of proteins identified in the present analysis is smaller than in our earlier study 8, probably due primarily to our choice to analyze only the center-half of the gel (Figure 1), compared to the entire gel in the previous experiments. The use of reverse data-base searching, which lowers the false-positive rate, may have also contributed to this. Fifty-nine proteins were identified only in one set of samples and were therefore we not considered as candidate biomarkers. After removing albumin, immunoglobulins, and keratin from the list, only 68 proteins were found by both Spectrum Mill and ProQuant and also found in at least two sets of samples and identified - with one exception, i.e., serum amyloid A; see below - by at least two peptides in ProQuant (Table 3). Overall, comparable results were obtained with both software packages. Graphical comparisons of the ProQuant an Spectrum Mill analyses are included in the supplementary materials. In general, the iTRAQ results agree with our previous label-free results 8.
Table 3.
Proteins were identified and quantified with ProQuant. 68 proteins that were found to be common in at least two separate sets of samples and identified with >99% confidence (corresponding to a protein score cut off >2.0) were clustered using K-means cluster analysis software. K was set to four and ProQuant ratios are shown with the corresponding 95% CI. The iTRAQ ratios were also determined by Spectrum Mill for comparison. The complete set of results is included in the Supplementary material.
| Protein ID | Database Accession # | Pro Quant Results | Spectrum Mill Results | ||||||||
|---|---|---|---|---|---|---|---|---|---|---|---|
| # pept | Score | day4:day0 (95% CI) | day8:day0 (95% CI) | day12:day0 (95% CI) | # pept | Score | day4: day0 | day8: day0 | day12: day0 | ||
| Cluster 1 Proteins | |||||||||||
| haptoglobin | gi|8850219 | 13 | 20.6 | 6.5 (2.4;18) | 56 (25;127) | 25 (2.3;273) | 16 | 249 | 6.7 | 46 | 36 |
| serum amyloid A | gij200904 | 1 | 22 | 4.7 | 21 | 2.3 | 1 | 15 | 8.5 | 24 | 5.8 |
| Cluster 2 Proteins | |||||||||||
| alpha 1 microglobulin/bikunin | gi|6680684 | 3 | 6.0 | 2.5 (2.0;3.2) | 4.3 (3.0; 6.1) | 5.5 (3.6;8.4) | 3 | 46.8 | 2.3 | 4 | 5.4 |
| coagulation factor XII (Hageman factor) | gi|37046881 | 2 | 3.7 | 2.8 (0;11044) | 5.2 (−) | 3.7 (0;2449642) | 2 | 31.6 | 2.7 | 2.8 | 4.5 |
| gamma-actin | gi|809561 | 7 | 11.6 | 2.1 (1.6;2.8) | 2.8 (2.1;3.8) | 8.8 (7.3;11) | 6 | 86.3 | 2.7 | 4.9 | 12 |
| heat shock protein 1, alpha | gi|6754254 | 2 | 2.9 | 1.6 (0.66;4.0) | 3.7 (2.3;6.1) | 14 (6.5;30) | 3 | 40.2 | 1.6 | 4.8 | 13 |
| hemopexin | gi|23956086 | 25 | 45.9 | 2.7 (2.5;2.9) | 4.0 (3.6;4.4) | 4.8 (4.2;5.4) | 32 | 510 | 3.1 | 5.4 | 7.4 |
| inter alpha-trypsin inhibitor, heavy chain 4 | gi|9055252 | 21 | 39.7 | 2.9 (2.1;4.2) | 5.6 (3.9;8.1) | 4.3 (3.0;6.0) | 28 | 416 | 3 | 6.6 | 4 |
| inter-alpha trypsin inhibitor, heavy chain 3 | gi|6680496 | 10 | 18.1 | 2.7 (2.2;3.3) | 4.7 (3.9;5.6) | 5.9 (4.7;7.4) | 13 | 221 | 3.4 | 5.4 | 6 |
| Ldh1 protein | gi|62740223 | 4 | 5.0 | 4.0 (1.5;10.8) | 7.8 (5.5;11) | 15 (9.6;22) | 7 | 87.2 | 10 | 12 | 24 |
| leucine-rich alpha-2-glycoprotein | gi|16418335 | 3 | 6.0 | 3.1 (2.3;4.3) | 3.7 (2.4;5.6) | 4.1 (2.7;6.3) | 4 | 54.8 | 3.1 | 5.6 | 5.9 |
| proteasome (prosome, macropain) subunit, alpha type 1 | gi|33563282 | 2 | 2.3 | 3.2 (2.0;5.0) | 3.6 (2.0;6.6) | 8.1 (6.3;10) | 2 | 27.8 | 3.5 | 4.6 | 8.1 |
| quiescin Q6 | gi|49904664 | 5 | 8.6 | 1.9 (1.5;2.5) | 2.7 (2.2;3.3) | 3.7 (2.9;4.7) | 5 | 73.5 | 2.3 | 3 | 3.9 |
| serum amyloid P-component (SAP) | gi|297547 | 7 | 10.6 | 4.1 (3.3;5.0) | 8.2 (6.8;10) | 15 (11;20) | 7 | 111 | 5.5 | 12 | 24 |
| serine (or cysteine) proteinase inhibitor, clade A (alpha-1 antiproteinase, antitrypsin), member 10 | gi|31981720 | 5 | 10.0 | 2.2 (1.8;2.6) | 3.8 (2.7;5.1) | 4.8 (3.1;7.2) | 8 | 116 | 2.2 | 4.5 | 6.3 |
| Cluster 3 Proteins | |||||||||||
| alpha-2-HS-glycoprotein/fetuin | gi|7304875 | 7 | 11.5 | 1.4 (1.0;1.8) | 1.2 (0.71;1.9) | 2.1 (1.0;4.0) | 9 | 149 | 1.8 | 2 | 4 |
| angiotensinogen precursor | gi|2842775 | 6 | 6.7 | 1.5 (1.1;2.0) | 0.89 (0.69;1.2) | 2.0 (1.5;2.6) | 4 | 60.1 | 1.4 | 1.4 | 2.3 |
| apolipoprotein H; beta-2-glycoprotein I | gi|2765102 | 4 | 6.2 | 1.9 (1.6;2.3) | 1.3 (0.70;2.3) | 1.6 (1.1;2.4) | 6 | 79.9 | 2.4 | 2.4 | 2.6 |
| carbonic anhydrase 1 | gi|15029975 | 2 | 4.0 | 3.4 (2.5;4.5) | 4.0 (2.9;5.3) | 0.65 (0.28;1.5) | 2 | 34.4 | 4.5 | 5.5 | 1 |
| carbonic anhydrase 2 | gi|33243954 | 8 | 12.7 | 3.2 (2.2;4.8) | 3.6 (2.8;4.6) | 0.85 (0.54;1.3) | 7 | 98.5 | 4.3 | 5 | 1.6 |
| ceruloplasmin | gi|38614350 | 24 | 41.7 | 1.8 (1.7;2.0) | 2.0 (1.8;2.2) | 3.7 (3.4:4.1) | 32 | 500 | 1.9 | 2.5 | 3.7 |
| clusterin/apolipoprotein J; apoJ | gi|49523333 | 10 | 20.3 | 2.1 (1.8;2.5) | 2.0 (1.6;2.6) | 2.0 (1.5;2.8) | 12 | 179 | 2.1 | 3.1 | 3.2 |
| complement component 3 | gi|23956044 | 67 | 120 | 1.6 (1.4;1.8) | 2.3 (2.0;2.6) | 2.7 (2.3;3.1) | 82 | 1207 | 2.3 | 3.2 | 4.1 |
| complement component 4 (within H-2S) | gi|6753226 | 26 | 53.2 | 2.7 (2.4;2.9) | 1.7 (1.4;2.1) | 1.9 (1.5;2.3) | 32 | 456 | 2.9 | 2.3 | 4.3 |
| complement component factor i | gi|6671744 | 5 | 6.0 | 1.7 (1.3;2.2) | 1.2 (0.69;2.2) | 1.6 (0.65;4.0) | 4 | 61.6 | 1.9 | 2.2 | 2.4 |
| epidermal growth factor receptor isoform 1 | gi|46560582 | 6 | 12.0 | 1.3 (1.1;1.6) | 1.5 (1.3;1.6) | 1.2 (0.85;1.6) | 7 | 114 | 1.5 | 1.7 | 1.5 |
| fetub protein | gi|17390796 | 2 | 2.8 | 1.5 (1.2;1.9) | 1.4 (1.3;1.6) | 2.0 (1.2;3.4) | 2 | 30.4 | 2.2 | 2.1 | 2.4 |
| fibrinogen, B beta polypeptide | gi|33859809 | 14 | 25.8 | 1.3 (1.1;1.5) | 2.6 (2.0;3.4) | 1.5 (1.1;1.9) | 17 | 270 | 1.8 | 4.9 | 2.6 |
| fibrinogen, gamma polypeptide | gi|19527078 | 12 | 21.6 | 1.4 (1.2;1.7) | 2.5 (2.0;3.1) | 1.6 (1.2;2.1) | 17 | 262 | 1.8 | 3.9 | 3 |
| hemolytic complement | gi|6754164 | 11 | 13.3 | 1.4 (1.1;1.8) | 2.0 (1.5;2.8) | 1.6 (1.2;2.0) | 12 | 160 | 1.8 | 1.9 | 1.6 |
| histidine-rich glycoprotein Hrg | gi|37548631 | 2 | 4.0 | 1.4 (1.1;1.8) | 1.4 (1.0;1.9) | 1.5 (1.0;2.1) | 4 | 62.5 | 1.7 | 2 | 2.1 |
| histocompatibility 2, complement component | |||||||||||
| factor B | gi|6996919 | 6 | 11.6 | 1.6 (1.3;1.9) | 3.0 (1.8;5.0) | 2.3 (1.5;3.5) | 6 | 96.9 | 2.2 | 5.1 | 5 |
| inter-alpha trypsin inhibitor, heavy chain 2 | gi|6754384 | 4 | 6.4 | 1.7 (1.2;2.5) | 1.1 (0.71;1.7) | 1.5 (0.96;2.4) | 6 | 81.9 | 1.9 | 1.5 | 1.8 |
| kininogen 1 | gi|12963497 | 13 | 21.3 | 1.5 (1.3;1.7) | 2.0 (1.5;2.7) | 2.1 (1.6;2.8) | 17 | 225 | 2 | 3 | 3.4 |
| orosomucoid 1 | gi|15215270 | 6 | 10.5 | 2.3 (1.9;2.8) | 2.3 (1.7;3.2) | 3.2 (2.0;5.1) | 7 | 96.9 | 3.1 | 7.6 | 13 |
| serine (or cysteine) proteinase inhibitor, clade D, member 1 | gi|21961582 | 5 | 9.4 | 1.3 (1.1;1.6) | 1.3 (1.1;1.5) | 1.6 (1.3;1.8) | 6 | 91.7 | 1.5 | 1.6 | 1.8 |
| serine (or cysteine) proteinase inhibitor, clade G, member 1 | gi|6753218 | 10 | 20.5 | 1.6 (1.4;1.9) | 1.7 (1.4;2.0) | 2.5 (2.0;3.2) | 14 | 206 | 2 | 2.4 | 3.6 |
| TAGL-delta | gi|33340158 | 2 | 3.3 | 1.6 (0.86;3.1) | 1.3 (0.55;3.0) | 2.2 (1.4;3.7) | 1 | 13.4 | 1.4 | 0.9 | 1.8 |
| transferrin | gi|20330802 | 39 | 84.1 | 1.4 (1.3;1.4) | 1.5 (1.4;1.7) | 2.4 (2.2;2.7) | 52 | 827 | 1.6 | 2 | 3.7 |
| vitamin D-binding protein | gi|193446 | 10 | 18.5 | 1.9 (1.6;2.2) | 1.2 (1.0;1.4) | 1.4 (1.1;1.7) | 12 | 188 | 2.1 | 1.5 | 1.6 |
| Cluster 4 Proteins | |||||||||||
| adiponectin, C1Q and collagen domain containing | gi|20381159 | 4 | 2.9 | 2.6 (1.4;4.7) | 1.5 (0.83;2.6) | 0.72 (0.29;1.8) | 2 | 33.3 | 2.5 | 1.4 | 0.8 |
| Afm protein | gi|20072386 | 4 | 7.4 | 1.0 (0.75;1.3) | 0.75 (0.49;1.2) | 1.0 (0.65;1.6) | 5 | 75.1 | 1 | 0.8 | 1.1 |
| alpha-2 macroglobulin MUG1 - mouse | gi|109550 | 19 | 29.2 | 0.88 (0.78;1.0) | 0.56 (0.49;0.63) | 0.53 (0.47;0.60) | 23 | 298 | 1.1 | 0.6 | 0.6 |
| apolipoprotein A-I | gi|6753096 | 10 | 23.2 | 1.1 (1.0;1.2) | 1.2 (1.0;1.4) | 0.55 (0.43;0.70) | 21 | 300 | 1.4 | 1.3 | 1 |
| apolipoprotein A-IV | gi|14789706 | 11 | 20.1 | 0.88 (0.73;1.1) | 0.48 (0.33;0.70) | 0.50 (0.29;0.86) | 13 | 188 | 1.2 | 1.6 | 2.6 |
| apolipoprotein D | gi|75677437 | 3 | 4.5 | 4.2 (3.3;5.3) | 1.0 (0.75;1.3) | 0.8 (0.7;0.9) | 3 | 45.8 | 4.4 | 1.5 | 0.9 |
| apolipoprotein E | gi|6753102 | 7 | 9.6 | 1.4 (1.1;1.7) | 0.63 (0.38;1.0) | 1.1 (0.65;1.9) | 6 | 87.4 | 1.5 | 1.2 | 1.7 |
| carboxypeptidase N, polypeptide 1 | gi|15928421 | 3 | 2.5 | 1.5 (1.0;2.3) | 1.0 (0.51;2.0) | 1.1 (0.47;2.6) | 2 | 30.3 | 2.1 | 1.5 | 1.6 |
| carboxypeptidase N, polypeptide 2 homolog | gi|59958377 | 7 | 8.3 | 1.3 (1.2;1.5) | 1.1 (0.90;1.3) | 1.2 (1.0;1.5) | 10 | 134 | 1.4 | 1.3 | 1.4 |
| complement component 8, beta subunit | gi|33563297 | 2 | 4.0 | 1.2 (0.83;1.8) | 1.0 (0.3;4.0) | 0.88 (0.21;3.6) | 1 | 19 | 1 | 1.1 | 1 |
| complement component 9 | gi|15375312 | 4 | 8.0 | 2.0 (1.7;2.4) | 1.3 (1.0;1.5) | 1.0 (0.74;1.2) | 6 | 102 | 2.1 | 1.4 | 1 |
| complement component C1SA | gi|27462724 | 2 | 3.7 | 0.7 (−) | 0.60 (−) | 1.0 (−) | 3 | 47.8 | 2 | 2.6 | 2.8 |
| contraspin | gi|54173 | 16 | 40.0 | 1.2 (1.1;1.3) | 0.79 (0.66;0.94) | 0.72 (0.61;0.86) | 20 | 361 | 1.9 | 1.8 | 1.9 |
| Es1 protein | gi|22135640 | 14 | 29.4 | 0.66 (0.61;0.72) | 0.48 (0.42;0.54) | 0.52 (0.43;0.63) | 19 | 301 | 0.9 | 0.7 | 0.9 |
| fibrinogen, alpha polypeptide | gi|33563252 | 13 | 23.2 | 1.2 (1.0;1.4) | 1.4 (1.2;1.63) | 1.0 (0.88;1.2) | 19 | 261 | 1.6 | 4.1 | 1.9 |
| glycosylphosphatidylinositol specific phospholipase D1 | gi|6680069 | 5 | 5.1 | 1.1 (0.93;1.4) | 0.6 (0.42;0.86) | 1.3 (1.2;1.5) | 3 | 44.9 | 1.1 | 0.6 | 1.2 |
| Gsn protein | gi|38014369 | 8 | 10.1 | 1.6 (1.5;1.8) | 1.1 (1.0;1.4) | 0.99 (0.81;1.2) | 11 | 152 | 1.6 | 1.2 | 1 |
| H-2 class I histocompatibility antigen, Q10 alpha chain precursor | gi|122120 | 10 | 17.8 | 1.4 (1.2;1.6) | 1.0 (0.87;1.2) | 0.65 (0.42;1.0) | 9 | 139 | 1.7 | 1.3 | 1 |
| LIFr protein (leukemia inhibitory factor receptor) | gi|21594125 | 3 | 5.5 | 1.6 (0.75;3.3) | 1.0 (0.25;4.2) | 0.47 (0.09;2.4) | 4 | 50.4 | 2.2 | 1 | 0.5 |
| mannose binding lectin, serum (C) | gi|6754656 | 4 | 6.3 | 1.4 (1.1;1.8) | 0.94 (0.7;1.2) | 0.79 (0.45;1.4) | 5 | 71 | 2 | 1.4 | 1.4 |
| paraoxonase 1 | gi|7242183 | 5 | 7.9 | 1.2 (0.85;1.7) | 0.42 (0.31;0.58) | 0.37 (0.19;0.74) | 5 | 73.6 | 1.4 | 0.7 | 0.9 |
| plasminogen | gi|31982113 | 7 | 7.6 | 1.0 (0.85;1.3) | 1.1 (0.98;1.3) | 1.2 (1.0;1.5) | 11 | 140 | 1.8 | 2 | 1.8 |
| pregnancy zone protein | gi|34785996 | 43 | 90.1 | 1.2 (1.1;1.2) | 1.3 (1.2;1.4) | 0.92 (0.84;1.0) | 55 | 864 | 1.3 | 1.7 | 1.3 |
| serine (or cysteine) proteinase inhibitor, clade A, member 6 | gi|6680856 | 4 | 6.5 | 1.2 (0.88;1.5) | 1.0 (0.78;1.3) | 0.46 (0.32;0.67) | 3 | 45.9 | 1.5 | 1.1 | 0.6 |
| serine (or cysteine) proteinase inhibitor, clade C (antithrombin), member 1 | gi|18252782 | 12 | 23.5 | 1.2 (0.85; 1.6) | 1.0 (1.5;1.8) | 1.2 (0.73;1.9) | 13 | 198 | 1.6 | 2.6 | 3.2 |
| serine (or cysteine) proteinase inhibitor, clade F, member 2 | gi|6679383 | 6 | 9.7 | 1.2 (0.87;1.6) | 1.5 (1.0;2.3) | 1.0 (0.7;1.5) | 6 | 95.3 | 1.4 | 1.9 | 1.6 |
| serpina1c protein | gi|15929675 | 15 | 31.9 | 1.0 (0.80;1.3) | 1.0 (0.81;1.3) | 0.67 (0.43;1.1) | 22 | 375 | 1.7 | 1.6 | 1.5 |
| vitronectin | gi|15215172 | 4 | 4.2 | 1.1 (0.65;1.9) | 1.0 (0.41;2.6) | 0.84 (0.42;1.7) | 4 | 57.6 | 2.1 | 2 | 2 |
| zinc-alpha-2-glycoprotein 1 | gi|29838430 | 6 | 8.6 | 1.3 (1.0;1.6) | 0.59 (0.34;1.0) | 0.83 (0.43;1.6) | 5 | 69.9 | 1.6 | 1.6 | 3.1 |
Figure 2.

A Venn diagram showing the number of proteins identified by Spectrum Mill in individual sets of samples. A total of 157 proteins were identified from the three sets of mouse plasma in which at least a 2-fold difference was observed in the level of 42 proteins in at least one time point as listed in Table 3.
We further validated five selected proteins (complement component 4, ceruloplasmin, hemopexin, haptoglobin, serum amyloid P), for which antibodies are commercially available, by quantitative Western blot analysis (Figure 4). Albumin- and immunoglobulin-depleted plasma samples were separated on SDS-PAGE, then transferred to PVDF membrane and probed with antibodies for the above-mentioned proteins. The resulting data for these proteins show the same general trends as shown by mass spectrometry analysis (Figure 4 B-F, Table 3). Thus, although it is difficult to align the gel-lanes corresponding to the various time-points, and this might result in iTRAQ-based quantitation errors, Western blot results for the five selected proteins suggest that these errors would be insignificant.
Figure 4.

Quantitative immunoblot analysis for five representative proteins identified by iTRAQ analysis: complement component 4 (B), hemopexin (C), ceruloplasmin (D), serum amyloid P (E), and haptoglobin (F) in mouse plasma during tumor growth in SJL mice. Figure 4A: Plasma proteins (5μg) from two sets of SJL mice were collected at 0, 4, 8, and 12 days after RcsX-tumor cell injection, separated by SDSPAGE, then transferred to PVDF membranes and probed with the indicated antibodies. Figure 4B-F: Relative ratios with respect to day 0 for complement component 4 (B), hemopexin (C), ceruloplasmin (D), haptoglobin (E), and serum amyloid P (F) using ProQuant.
Cluster Analysis and Candidate Biomarkers
A major aim was to find proteins in plasma associated with the development and progression of B cell lymphoma, i.e. to find candidate biomarkers for inflammation-related disease. The progression of the tumor was followed by proteomic analysis of blood samples. Plasma contains proteins of many types from a number of sources and with a variety of functions, including those secreted in plasma to act in plasma, immunoglobulins, hormones, cytokines, tissue-leakage products, i.e. intracellular proteins that are released due to cell death or damage, tumor associated proteins, and foreign proteins originating from infectious organisms 21,26.
In order to classify the proteins according to their expression pattern, K-means cluster analysis was performed based on the ProQuant results including proteins identified with at least two peptides and with a protein score >2.0 (giving 99% confidence identifications). Since protein levels from day 4, 8 and 12 were normalized to the day 0 time point, three variables were used in the cluster analysis (iTRAQ ratio day 4:day 0, iTRAQ ratio day 8:day 0 and iTRAQ ratio day 12:day 0). The optimal solution for the K-means cluster analysis was obtained with K set to four, i.e. with four groups, overviewed in Figure 3 and Table 3. Group one clearly contains the highly up-regulated acute-phase protein haptoglobin. Serum amyloid A showed similar behavior and is included in cluster 1. Although this protein was identified with a single peptide (EAFQEFFGR), the peptide is unique to murine serum amyloid A and was characterized by both ProQuant and Spectrum Mill. In addition, the MS/MS spectra contain virtually complete y- and b-ion series, along with a number of additional characteristic fragment ions (see supplementary material). The precision of the iTRAQ quantitation is compromised somewhat due to the low abundance of the m/z 114 reporter ion for day 0, but there is no doubt that the protein is strongly up-regulated (e.g., the m/z 116 reporter ion for day 8 is the base peak in the mass spectrum). The complete set of data relevant to these conclusions is included in the Supporting Material. Group two, in which the levels increased progressively contained proteins with varied functions such as protease inhibitors (inter-alpha trypsin inhibitor, heavy chain 3 & 4), cell motility (gamma-actin), transport (hemopexin) and in the acute phase response (serum amyloid P-component (SAP). Group three contained proteins that were slightly up-regulated at day 4 and remained at the same level through day 12. Finally, group four represented proteins with a slight up-regulation at day 4 and then with a slight down-regulation at day 8 and 12.
Figure 3.
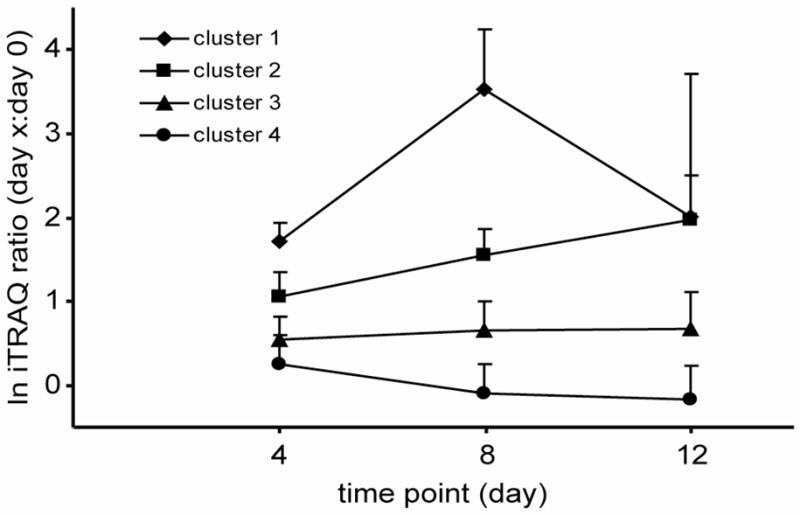
K-means cluster analysis of 72 proteins that were found in two separate sets of samples and identified with both ProQuant and Spectrum Mill. Proteins were clustered using the expression levels at the three time points as variables. K was set to 4. Means of the natural logged ratios for each cluster group and time point are shown with error bars representing the standard deviation.
RcsX lymphoma cells induce an inflammatory response, mainly in the spleen and lymph nodes. The liver plays an important role in the inflammation process, performing, among other functions, detoxification of blood and synthesis of acute phase proteins 27–29. The hepatic acute phase response is mediated by different categories of mediators, including interleukin (IL)-6 type cytokines (IL-6, IL-11, leukemia inhibitor factor (LIF), oncostatin, ciliary neurotrophic factor) and IL-1 type cytokines (IL-1α, IL-1β, TNF-α, TNF-β) 30.The events are mediated through cytokine receptors on the hepatic cells. Different sets of APPs are expressed through the different cytokine types which to some degree are species-dependent 30.
An interesting protein in this respect is the soluble leukemia inhibitor factor receptor (LIFr), also called soluble D-factor 31–33. We found that its level was initially up regulated ~2 fold at day 4 but then began to drop (1 fold at day 8 and 0.5 fold at day 12). In an earlier study 8, we found six LIFr peptides in the plasma of the SJL mouse, as opposed to no detectable peptides at day 14 in the SJL/RcsX mouse. In this study, consistent with that earlier report, we found four peptides (NTEYTLFESISGK, IFLTWR, TEPVALVLLNTMLSGK, ITGLVGPR) from the extra-cellular region of LIFr, indicating that it is a soluble receptor. The peptides were found at all time-points, but declined with time. LIFr is a component of membrane receptor complexes of the multifunctional cytokine, leukemia inhibitory factor (LIF), and belongs to the family of haemopoietic growth factors (e.g. IL-1, IL-6, etc) with functions similar to those of IL-6 31. LIF binds to the LIF receptor and has been shown, in monkeys, to stimulate the production of APPs such as C-reactive protein, α-1-antitrypsin, haptoglobin and ceruloplasmin 34. LIFr is expressed in several cell types including liver cells 34,35, and it plays an important role during inflammation as a pro- and antiinflammatory mediator36. It has been suggested, for example, that in normal mouse serum higher concentrations of sLIFr could inhibit LIF function 37. In the present study, the changes of the receptor with time suggest that free LIF levels initially drop and then increase. This suggests in turn that LIF can act either as a pro-inflammatory or an anti-inflammatory mediator at different stages of RcsX tumor growth in the SJL mouse, although verification of this hypothesis will require additional research.
Haptoglobin and hemopexin are high-affinity hemoglobin- and heme-binding proteins 38. In this study haptoglobin was present in extremely low levels at day 0 and was slightly up-regulated at day 4. At day 8, however, a fifty-fold increase was detected. The low levels of haptoglobin at baseline resulted in wide confidence intervals. Hemopexin, a plasma glycoprotein, is responsible for recycling iron by binding and transporting extracellular heme to the liver for degradation. During various pathological conditions there is an increase in hemolysis, releasing free heme which, in large amounts, can be toxic because it mediates oxidative stress 39. Hemopexin and haptoglobin were also shown by Wait et al. to have a fourfold increase in mice with systemic inflammation due to injections with lipopolysaccharide 40. A similar increase of hemopexin and inter α-trypsin inhibitor heavy chain 4 but also of haptoglobin was detected in plasma from burn injury and infected mice 16. Haptoglobin and SAP were earlier identified as major APPs in studies of inflammation-induced mice 41.
Other upregulated proteins include bikunin (a part of inter-alpha-trypsin inhibitor) 42, serum amyloid P (elastase inhibitor), and serum amyloid A. These, plus haptoglobin, hemopexin, and other protease inhibitors form a classical group known as acute phase proteins (MeSH term in PubMed). The serum amyloids would probably not be good candidate biomarkers. Serum amyloid A varied widely in our studies, and serum amyloid P declines in human liver disease 43,44 in contrast to its increase in our studies in the mouse. Remarkably, a large percentage of the proteins that increased are regulated by the nuclear transcription factor Nrf2 45. The Keap1-Nrf2 pathway is one of the major routes for signaling transcription of detoxification and antioxidant genes, and repression of cholesterol and lipd biosynthesis. The linkage between Nrf2 regulation and acute phase proteins may be significant for discovery of future candidate biomarkers.
Proteins that declined in our study included esterase-1 and apolipoprotein A-IV. The latter protein has antioxidant activity, and inhibits oxidant-induced apoptosis 46, while esterase-1 has activity against a wide range of substrates 47,48. The picture that emerges is complex, but it is clear that protease inhibitors increase and esterases decrease, leading to an overall decrease in hydrolytic activity in the blood.
Concluding remarks
The amine-specific tags enabled quantitative analysis of plasma from the same mouse at the normal stage and then at several time points during lymphoma progression, to provide information concerning the expression profiles for different groups of proteins. Up or down-regulated proteins were discovered that could be evaluated as potential biomarkers for disease involving inflammation. While a single acute phase protein would be unlikely to be a specific biomarker, a set of proteins with a characteristic expression pattern could serve as a much stronger biomarker set since the variance of a given protein within the group would have a smaller impact on the total values. The 1D-gel-LC-MS/MS method that was employed, contributed to errors in the quantitation, however, many proteins were nonetheless detected and a small group of these were characterized with Western blots, which were generally consistent with the mass spectrometric results. Furthermore, the findings of interesting proteins such as the LIFr, and the discovery that a single nuclear transcription factor (Nrf2) is a factor in regulation of plasma proteins provide new leads for future exploration. The panel of proteins chosen to reflect the disease studied here will form a base for method development (i.e., multiple-reactionmonitoring in LC/MS/MS) for analysis of larger set of samples.
Supplementary Material
This material is available free at http://pubs.acs.org. 1. Summary of data analyses by ProQuant and Spectrum Mill. 2. Graphical comparison of results between ProQuant and Spectrum Mill. 3. MS/MS spectrum of the serum amyloid A peptide.
Acknowledgments
This work was supported by NCI (Grant No. P01-CA26731), the MIT Center for Environmental Health Sciences (NIEHS Grant No. P30-ES02109) and the Swedish Council for Working Life and Social Research (Grant No. 2003- 0838). We thank Laura Trudel for providing plasma samples and Karl R. Clauser for helpful discussions on the Spectrum Mill data analyses.
Abbreviations
- APPs
acute phase proteins
- CI
confidence interval
- IL
interleukin
- iTRAQ
isobaric tags for relative and absolute quantitation
- LIF
leukemia inhibitory factor
- LIFr
leukemia inhibitory factor receptor
- MRM
multiple-reaction-monitoring
- PBS
phosphate buffered saline
- SAP
serum amyloid P-component
- TEAB
triethylammonium bicarbonate buffer
References
- 1.Hu Y, Malone JP, Fagan AM, Townsend RR, Holtzman DM. Mol Cell Proteomics. 2005;4:2000–2009. doi: 10.1074/mcp.M500207-MCP200. [DOI] [PubMed] [Google Scholar]
- 2.Qian WJ, Jacobs JM, Camp DG, Monroe ME, Moore RJ, Gritsenko MA, Calvano SE, Lowry SF, Xiao W, Moldawer LL, Davis RW, Tompkins RG, Smith RD. Proteomics. 2005;5:572–584. doi: 10.1002/pmic.200400942. [DOI] [PMC free article] [PubMed] [Google Scholar]
- 3.Nelsestuen GL, Zhang Y, Martinez MB, Key NS, Jilma B, Verneris M, Sinaiko A, Kasthuri RS. Proteomics. 2005;5:4012–4024. doi: 10.1002/pmic.200401234. [DOI] [PubMed] [Google Scholar]
- 4.Murphy ED. Proceedings of American association for cancer research. 1963;4:46. [Google Scholar]
- 5.Tsiagbe VK, Thorbecke GJ. Cell Immunol. 1990;129:494–502. doi: 10.1016/0008-8749(90)90223-e. [DOI] [PubMed] [Google Scholar]
- 6.Weller AH, Magliato SA, Bell KP, Rosenberg NL. Muscle Nerve. 1997;20:72–82. doi: 10.1002/(sici)1097-4598(199701)20:1<72::aid-mus10>3.0.co;2-3. [DOI] [PubMed] [Google Scholar]
- 7.Kostek CA, Dominov JA, Miller JB. Am J Pathol. 2002;160:833–839. doi: 10.1016/S0002-9440(10)64906-1. [DOI] [PMC free article] [PubMed] [Google Scholar]
- 8.Bhat VB, Choi Wishnok JS, Tannenbaum SR. J Proteome Res. 2004;4:1814–1825. doi: 10.1021/pr0501463. [DOI] [PubMed] [Google Scholar]
- 9.Tsiagbe VK, Yoshimoto T, Asakawa J, Cho SY, Meruelo D, Thorbecke GJ. The EMBO Journal. 1993;12:2313–2320. doi: 10.1002/j.1460-2075.1993.tb05885.x. [DOI] [PMC free article] [PubMed] [Google Scholar]
- 10.Ponzio NM, Hayama T, Nagler C, Katz IR, Hoffmann MK, Gilbert K, Vilcek j, Thorbecke GJ. J Natl Cancer Inst. 1984;72:311–320. [PubMed] [Google Scholar]
- 11.Lasky JL, Ponzio NM, Thorbecke GJ. J Immunol. 1988;140:679–687. [PubMed] [Google Scholar]
- 12.Katz IR, Chapman-Alexander J, Jacobson EB, Lerman SP, Thorbeck GJ. Cell immunology. 1981;65:84–92. doi: 10.1016/0008-8749(81)90054-x. [DOI] [PubMed] [Google Scholar]
- 13.Gal A, Tamir S, Tannenbaum SR, Wogan GN. Proc Natl Acad Sci USA. 1996;93:11499–11503. doi: 10.1073/pnas.93.21.11499. [DOI] [PMC free article] [PubMed] [Google Scholar]
- 14.Dedon PC, Tannenbaum SR. Arch Biochem Biophys. 2004;423:12–22. doi: 10.1016/j.abb.2003.12.017. [DOI] [PubMed] [Google Scholar]
- 15.Gal A, Tamir S, Kennedy LJ, Tannenbaum SR, Wogan GN. Cancer Res. 1997;57:1823–1828. [PubMed] [Google Scholar]
- 16.Duan X, Yarmush D, Berthiaume F, Jayaraman A, Yarmush ML. Proteomics. 2005;5:3991–4000. doi: 10.1002/pmic.200401257. [DOI] [PubMed] [Google Scholar]
- 17.Shevchenko A, Wilm M, Vorm O, Mann M. Anal Chem. 1996;68:850–858. doi: 10.1021/ac950914h. [DOI] [PubMed] [Google Scholar]
- 18.Nikov G, Bhat V, Wishnok JS, Tannenbaum SR. Analytical Biochemistry. 2003;320:214–222. doi: 10.1016/s0003-2697(03)00359-2. [DOI] [PubMed] [Google Scholar]
- 19.Unwin RD, Pierce A, Watson RB, Sternberg DW, Whetton AD. Mol Cell Proteomics. 2005;4:924–935. doi: 10.1074/mcp.M400193-MCP200. [DOI] [PubMed] [Google Scholar]
- 20.Ross PL, Huang YN, Marchese JN, Williamson B, Parker K, Hattan S, Khainovski N, Pillai S, Dey S, Daniels S, Purkayastha S, Juhasz P, Martin S, Bartlet-Jones M, He F, Jacobson A, Pappin DJ. Mol Cell Proteomics. 2004;3:1154–1169. doi: 10.1074/mcp.M400129-MCP200. [DOI] [PubMed] [Google Scholar]
- 21.Anderson NL, Anderson NG. Mol Cell Proteomics. 2002;1:845–867. doi: 10.1074/mcp.r200007-mcp200. [DOI] [PubMed] [Google Scholar]
- 22.Sachon E, Mohammed S, Bache N, Jensen ON. Rapid Communications in Mass Spectrometry. 2006;20:1127–1134. doi: 10.1002/rcm.2427. [DOI] [PubMed] [Google Scholar]
- 23.Qian WJ, Monroe ME, Liu T, Jacobs JM, Anderson GA, Shen Y, Moore RJ, Anderson DJ, Zhang R, Calvano SE, Lowry SF, Xiao W, Moldawer LL, Davis RW, Tompkins RG, Camp DG, Smith RD. Mol Cell Proteomics. 2005;4:700–709. doi: 10.1074/mcp.M500045-MCP200. [DOI] [PMC free article] [PubMed] [Google Scholar]
- 24.Anderson NL, Polanski M, Pieper R, Gatlin T, Tirumalai RS, Conrads TP, Veenstra TD, Adkins JN, Pounds JG, Fagan R, Lobley A. Mol Cell Proteomics. 2004;3:311–326. doi: 10.1074/mcp.M300127-MCP200. [DOI] [PubMed] [Google Scholar]
- 25.Ebersole JL, Cappelli D. Periodontol 2000. 2000;23:19–49. doi: 10.1034/j.1600-0757.2000.2230103.x. [DOI] [PubMed] [Google Scholar]
- 26.Qian WJ, Jacobs JM, Liu T, Camp DG, Smith RD. Mol Cell Proteomics. 2006 doi: 10.1074/mcp.M600162-MCP200. [DOI] [PMC free article] [PubMed] [Google Scholar]
- 27.Colten HR. J Appl Physiol. 1992;72:1–7. doi: 10.1152/jappl.1992.72.1.1. [DOI] [PubMed] [Google Scholar]
- 28.Sheth K, Bankey P. Curr Opin Crit Care. 2001;7:99–104. doi: 10.1097/00075198-200104000-00008. [DOI] [PubMed] [Google Scholar]
- 29.Parker GA, Picut CA. Toxicol Pathol. 2005;33:52–62. doi: 10.1080/01926230590522365. [DOI] [PubMed] [Google Scholar]
- 30.Baumann H, Gauldie J. Immunol Today. 1994;15:74–80. doi: 10.1016/0167-5699(94)90137-6. [DOI] [PubMed] [Google Scholar]
- 31.Gearing DP, Thut CJ, VandeBos T, Gimpel SD, Delaney PB, King J, Price V, Cosman D, Beckmann MP. EMBO J. 1991;10:2839–2848. doi: 10.1002/j.1460-2075.1991.tb07833.x. [DOI] [PMC free article] [PubMed] [Google Scholar]
- 32.Tomida M, Yamamoto-Yamaguchi Y, Hozumi M. J Biochem (Tokyo) 1994;115:557–562. doi: 10.1093/oxfordjournals.jbchem.a124375. [DOI] [PubMed] [Google Scholar]
- 33.Tomida M, Yamamoto-Yamaguchi Y, Hozumi M. FEBS Lett. 1993;334:193–197. doi: 10.1016/0014-5793(93)81710-h. [DOI] [PubMed] [Google Scholar]
- 34.Mayer P, Geissler K, Ward M, Metcalf D. Blood. 1993;81:3226–3233. [PubMed] [Google Scholar]
- 35.Hilton DJ, Gough NM. J Cell Biochem. 1991;46:21–26. doi: 10.1002/jcb.240460105. [DOI] [PubMed] [Google Scholar]
- 36.Gadient RA, Patterson PH. Stem Cells. 1999;17:127–137. doi: 10.1002/stem.170127. [DOI] [PubMed] [Google Scholar]
- 37.Layton MJ, Cross BA, Metcalf D, Ward LD, Simpson RJ, Nicola NA. Proc Natl Acad Sci USA. 1992;89:8616–8620. doi: 10.1073/pnas.89.18.8616. [DOI] [PMC free article] [PubMed] [Google Scholar]
- 38.Fagoonee S, Di Cunto F, Vozzi D, Volinia S, Pellegrino M, Gasparini P, Silengo L, Altruda F, Tolosano E. DNA Cell Biol. 2006;25:323–330. doi: 10.1089/dna.2006.25.323. [DOI] [PubMed] [Google Scholar]
- 39.Wagener FA, Volk HD, Willis D, Abraham NG, Soares MP, Adema GJ, Figdor CG. Pharmacol Rev. 2003;55:551–571. doi: 10.1124/pr.55.3.5. [DOI] [PubMed] [Google Scholar]
- 40.Wait R, Chiesa G, Parolini C, Miller I, Begum S, Brambilla D, Galluccio L, Ballerio R, Eberini I, Gianazza E. Proteomics. 2005;5:4245–4253. doi: 10.1002/pmic.200401292. [DOI] [PubMed] [Google Scholar]
- 41.Duan X, Yarmush DM, Berthiaume F, Jayaraman A, Yarmush ML. Electrophoresis. 2004;25:3055–3065. doi: 10.1002/elps.200406039. [DOI] [PubMed] [Google Scholar]
- 42.Zhou L, Salustri A, Kimata K. Glycoconj J. 2003;19:241–247. doi: 10.1023/A:1025331929373. [DOI] [PubMed] [Google Scholar]
- 43.Levo Y, Shalit M, Tur-Kaspa R. Am J Gastroenterol. 1982;77:427–430. [PubMed] [Google Scholar]
- 44.Pepys MB, Dash AC, Markham RE, Thomas HC, Williams BD, Petrie A. Clin Exp Immunol. 1978;32:119–124. [PMC free article] [PubMed] [Google Scholar]
- 45.Kwak MK, Wakabayashi N, Itoh K, Motohashi H, Yamamoto M, Kensler TW. J Biol Chem. 2003;278:8135–8145. doi: 10.1074/jbc.M211898200. [DOI] [PubMed] [Google Scholar]
- 46.Spaulding HL, Saijo F, Turnage RH, Alexander JS, Aw TY, Kalogeris TJ. Am J Physiol Cell Physiol. 2006;290:C95–C103. doi: 10.1152/ajpcell.00388.2005. [DOI] [PubMed] [Google Scholar]
- 47.Kadner SS, Katz J, Levitz M, Finlay TH. J Biol Chem. 1985;260:15604– 15609. [PubMed] [Google Scholar]
- 48.Genetta TL, D’Eustachio P, Kadner SS, Finlay TH. Biochem Biophys Res Commun. 1988;151:1364–1370. doi: 10.1016/s0006-291x(88)80513-8. [DOI] [PubMed] [Google Scholar]
Associated Data
This section collects any data citations, data availability statements, or supplementary materials included in this article.
Supplementary Materials
This material is available free at http://pubs.acs.org. 1. Summary of data analyses by ProQuant and Spectrum Mill. 2. Graphical comparison of results between ProQuant and Spectrum Mill. 3. MS/MS spectrum of the serum amyloid A peptide.