


Abstract
The apoptosis stimulating p53 proteins, ASPP1 and ASPP2, are the first two common activators of the p53 protein family that selectively enable the latter to regulate specific apoptotic target genes, which facilitates yes yet unknown mechanisms for discrimination between cell cycle arrest and apoptosis. To better understand the interplay between ASPP- and p53-family of proteins we investigated the molecular interactions between them using biochemical methods and structure-based homology modelling. The data demonstrate that: (i) the binding of ASPP1 and ASPP2 to p53, p63 and p73 is direct; (ii) the C-termini of ASPP1 and ASPP2 interact with the DNA-binding domains of p53 protein family with dissociation constants, Kd, in the lower micro-molar range; (iii) the stoichiometry of binding is 1:1; (iv) the DNA-binding domains of p53 family members are sufficient for these protein–protein interactions; (v) EMSA titrations revealed that while tri-complex formation between ASPPs, p53 family of proteins and PUMA/Bax is mutually exclusive, ASPP2 (but not ASPP1) formed a complex with PUMA (but not Bax) and displaced p53 and p73. The structure-based homology modelling revealed subtle differences between ASPP2 and ASPP1 and together with the experimental data provide novel mechanistic insights.
INTRODUCTION
The p53 protein is one of the best known tumour suppressor proteins because of the high frequency of its mutations in a wide range of human cancers. The protein exerts its tumour suppressor function either by triggering cell cycle arrest or apoptosis. Precisely, which of the two alternative pathways are needed to enable p53 to block tumour development and how exactly the cells decide which pathway to choose is not well understood. Induction of apoptosis is the most evolutionary conserved function of p53 and key for tumour suppression (1). The p53 protein is known to mediate apoptosis by transactivating many genes in response to DNA damage or cellular stress. However, p53 can also mediate apoptosis by independent pathways (2). Transcriptionally inactive p53 mutants can induce apoptosis in certain tumour cells (3). Although the intrinsic mechanism is unknown, protein–protein interactions between p53 and other cellular proteins may be involved in transcription-independent apoptosis by p53. The discovery of the phylogenetically older tumour suppressor p53 family members, p73 and p63, brought excitement and controversy over whether and how they cooperate with p53 in tumour suppression (4–6). It raised the expectations that a cross talk between these family members might exist to govern the cell cycle arrest and apoptosis in response to stress. Although p73 and p63 are rarely mutated in cancer, studies suggest that p73 and p63 may function independently and/or in concert with p53 to elicit cell death (7–9).
As proteins, the p53 family share remarkable similarity at the structural and functional levels, but also have distinct, non-overlapping functions. Each family member functions as a sequence-specific transcription factor and is induced by different types of stress stimuli including DNA damage. All three proteins are implicated in cell death pathways. The p73 and p63 proteins are more similar to each other than to p53. They share >60% amino acid sequence identity with the p53 DNA-binding domain and can activate the expression of p53-responsive elements (p53RE). However, the proteins have also uniquely specialized functions and are involved in different biological processes, which suggest that they are not redundant (10). Urist and Prives (11) proposed that p73 and p63 might be required for stable association of p53 with subset of its target promoters and hence forming large assembly of transcriptional complexes containing the three proteins. Finally, some promoters might be selectivity regulated by the interaction of p53 with increasing number of proteins that act as transcriptional co-factors by discriminating selectively and stabilizing p53 (12,13). Evidence in support of the latter view came when the so-called apoptosis stimulating p53 proteins (ASPPs) were reported to interact specifically and to enhance the apoptotic function of p53, but not that of the cell cycle arrest (14). The ASPP proteins achieve this by binding specifically to the DNA-binding domain of p53 and activating transcription selectively from p53 responsive pro-apoptotic genes (i.e. Bax, PUMA and PIG3) over growth arrest genes (i.e. p21, mdm2). It was suggested that the ASPP–p53 complex acts at gene promoters, with ASPP's subtly altering the ability of the p53 protein to bind to DNA. Since the DNA-binding domain is the most conserved domain among all p53 family members, it was expected that ASPP1 and ASPP2 could also interact with p73 and p63 to induce apoptosis independently of p53. Using RNA interference to remove endogenous p73 and p63 revealed that the p53-independent apoptotic functions of ASPP1 and ASPP2 were mediated by p73 and p63, making ASPP1 and ASPP2 the first common activators of the p53 family of proteins (15).
The ASPP family of proteins consists of three proteins, ASPP1, ASPP2 and iASPP. Their names are derived from the fact that they are ankyrin repeat, SH3 domain and proline-rich domain containing proteins. In terms of their function they are apoptosis stimulating proteins of p53. ASPP2 was identified originally as 53BP2 (p53-binding protein 2), which is now recognized to be the C-terminal 528 amino acids of ASPP2 (14,16). Due to its inhibitory effect on apoptosis, the third family member was called iASPP. ASPP1 and ASPP2 share about 49% sequence homology with the highest identity observed at the N- and C-terminal ends, but it is not known if they have overlapping or redundant functions. Although the precise molecular mechanism by which ASPPs selectively stimulate DNA-binding remains unclear, both p73 and p63, like the ASPP family of proteins, were reported to be required for p53-independent apoptosis (1,13).
The interaction between the DNA-binding domain of the p53 protein and the ankyrin and SH3 domains of 53BP2 was shown by the 2.2 Å structure between fragments of the proteins (17). The structure revealed that the SH3 domain binds to the L3 loop of p53 and the fourth ankyrin repeat binds to the L2 loop of p53 DNA-binding domain. It is now well established that L2 and L3 of p53 are evolutionary conserved and that many of the p53 cancer-associated mutations are located at these sites. Not surprisingly, the six most frequent p53 mutations in cancer, known as ‘hot spots’, disrupt 53BP2 binding in vitro. Importantly, the 53BP2-binding site overlaps the site of p53 DNA binding (17–19). Recently, the structures of the N-terminal 83 amino acid of ASPP2 as well as the C-terminal fragment of iASPP (a.a. 608–828) were solved (20,21). It was also reported that the ASPP2 proline-rich domain is natively unfolded (22). While the role of the ASPP proteins in cancer remains to be fully elucidated it has been observed that loss of expression of ASPP1 and ASPP2 had been detected in breast cancers (14). Loss of expression of ASPP's is known to partially inhibit the ability of chemotherapeutic drugs to cause apoptosis, apparently by blocking p53's apoptosis-inducing function. A p53-derived apoptotic peptide was shown to derepress p73 to exert tumour regression in vivo regardless of p53 status (4) and a small molecule RETRA has been used to suppress mutant p53-bearing cancer cells via a p73-dependent pathway (6). These studies provide a proof of principle strategy to directly and selectively utilize p73 for therapeutic benefits.
Here, we investigate the structural–molecular mechanism of interaction of the DNA-binding domains of the p53 family of proteins, (p53, p63 and p73) with the C-terminal domains of ASPP1 and ASPP2. We provide direct, quantitative information about the intrinsic nature of these protein–protein interactions using biophysical and biochemical methods. To shed further light on how these proteins might cooperate in apoptosis, we assembled protein–DNA complexes between a select set of apoptotic promoters known to interact with all three members of p53 protein family and titrated them with either ASPP1 or ASPP2. Using EMSA we further examined the possibility of tri-complex formation between p53 (p63, p73), PUMA or Bax and ASPP1 or 2. Our findings confirmed that: (i) C-terminal regions of ASPP1 and ASPP2 directly interact with the DNA-binding domains of p53, p63 and p73 with similar affinity; (ii) the binding of the C-terminal region of ASPP2 (and ASPP1) and PUMA (or BAX) to the DNA-binding domains of p53, p63 and p73 is mutually exclusive; (iii) the C-terminal region of ASPP2 but not that of ASPP1 interacts directly with both p53, p73 or PUMA but not Bax, forming an ASPP2–PUMA complex; (iv) finally, using molecular modelling and structure-based alignment we mapped and compared the residues involved in the protein–protein interactions. The data are discussed in the light of possible use of p73 (and p63) as activators of apoptosis. The implications are that the latter could be exploited in cancer treatment, in cases where tumours are expressing mutant p53, or where p53 is not present.
MATERIALS AND METHODS
Molecular cloning
The corresponding fragments for the C-terminal (four ankyrin repeats and an SH3 domain) constructs of interests containing a.a. 863–1090 and 902–1128, for ASPP1 and ASPP2, respectively were subcloned into a pRSET-derived plasmid containing 6xHis tags at its N-terminal end. The subcloning of the DNA-binding domains of p53 family of proteins, namely, p53 DBD (a.a. 94–312), p63 DBD (a.a. 154–365) and p73 DBD (a.a. 104–333) into a pRSET(A)-derived plasmid was described previously (23,24). The p53, p63 and p73 constructs do not have tags.
Protein expression and protein purification
Cell cultures of Escherichia coli C41 (DE3) were grown in 2×TY medium supplemented with ampicillin at 37°C (200–250 r.p.m.) to an OD600 ∼ 0.6–0.8. The temperature was then reduced to 16–22°C before overnight induction with 0.5 mM IPTG. Cells were harvested by centrifugation at 4°C and then lysed in BugBuster Protein Extraction Reagent supplemented with Benzonase Nuclease (Novagen, Nottingham, UK), with EDTA-free protease inhibitor tablets (Roche, Burgess Hill, UK) and 4 mM DTT. The protein samples were spun down at 13 000 r.p.m. for 20 min at 4°C. The purification of the DNA-binding domains of p53, p63 and p73 were performed as reported previously (23,25,26). For ASPP1 and ASPP2, the soluble fraction was purified using batch purification with Ni-NTA resin (Qiagen, Crawley, UK) (50 mM NaPi, 300 mM NaCl, 20 mM imidazole, 1 mM DTT and 10% glycerol). The supernatant obtained after the BugBuster extraction procedure was poured into a glass beaker with the Ni beads and incubated at 4°C by shaking for 45 min. The suspension was then spun at 4000 r.p.m. for 10 min at 4°C and the supernatant discarded. The beads were washed with 10 column volumes of binding buffer as above and the supernatant discarded. The bound protein was eluted from the beads using five column volumes of elution buffer (5 mM NaPi, 300 mM NaCl, 300 mM imidazole, 1 mM DTT and 10% glycerol) by centrifuging at 4000 r.p.m. for 5 min at 4°C.
Circular dichroism
Proteins were subjected to the circular dichroism (CD) scans at concentrations 0.2 mg/ml in 10 mM NaPi, 100 mM NaCl, 4 mM DTE buffer. Samples were filtered with 0.2 μm filters (Whatman). The CD studies were performed using an Applied Photophysics Chirascan spectropolarimeter. Far-UV spectra were recorded in the region 260–190 nm, respectively using 0.5 mm cell path length, 1 nm bandwidth, 0.5 nm scan speed, 3 s time-per-point. The temperature was controlled using Melcor's thermoelectric temperature controller. Data are represented in ellipticity as a function of the wavelength (nm) and calculated according to Schmid (27).
Isothermal titration calorimetry
The buffers for each protein used were 50 mM NaPi, 200–300 mM NaCl, 1–5 mM DTT and 0–10% glycerol and filtered via a 0.2 μm filter (Whatman). The protein concentrations used for ASPP1:p53 were 11 µM:200 µM, ASPP1:p63 were 4.5:80 μM and ASPP1:p73 were 7:100 μM; ASPP2:p53 were 15:300 µM, ASPP2:p63 were 10:260 μM and ASPP2:p73 were 25:560 μM. All experiments were carried out using the VP-(Isothermal titration calorimetry) ITC Micro-Calorimeter with the following parameters: 20 injections of 15 µl with 240 s spacing, reference power 14 pCal/s, stirring speed 300 and at 10°C. Controls were performed by titrating each protein sample used at a higher concentration in the syringe, into the sample cell filled with buffer alone. Experimental data were fitted assuming a single binding site (Microcal VPITC user guide).
Analytical gel filtration
Analytical gel filtration was performed in 50 mM NaPi, pH 7.2, 200 mM NaCl, 5 mM DTT using a Superdex 200 (10/300) column (GE Healthcare, Little Chalfont, UK). The proteins were injected at a concentration of 40 µM with an injection volume of 100 µl and the milli-absorbance units (mAu) at 280 nm were recorded. Complexes were incubated at 22°C for 25 min.
Electrophoretic mobility shift assays
Electrophoretic mobility shift assays (EMSA) were carried out with all p53 family of proteins and 5′-fluorescein-labelled 30-mer dsDNA promoters of Bax and PUMA using 0.7% agarose gel and TB buffer at a constant current of 60 V at 4°C. The DNA concentrations were kept constant, while the p53, p63 and p73 protein concentrations were increased. The protein concentration at which most (or all) of the DNA was shifted was then selected for the titration with the ASPP proteins. The fluorescein tag enabled sensitive detection under UV light. Protein–DNA complexes were incubated on ice for 20 min. To investigate the possibility of tri-complex formation and or displacement of the DNA from the protein–DNA complexes, the ASPP proteins were then titrated into these complexes and incubated for further 30 min at 4°C before loading onto the gel. In addition, we tested if ASPP1 and ASPP2 would be able to shift the same DNA promoters under the experimental conditions. The oligonucleotides used in the EMSA were annealed by heating at 95°C for 5 min followed by cooling to 4°C overnight. The following sequences were used:
Bax (forward): GGGCTCACAAGTTAGAGACAAGCCTGGGCG
Bax (reverse): CGCCCAGGCTTGTCTCTAACTTGTGAGCCC
PUMA (forward): CGCGCCTGCAAGTCCTGACTTGTCCGCGGC
PUMA (reverse): GCCGCGGACAAGTCAGGACTTGCAGGCGCG
Modelling
The model structures of p63, p73 and ASPP1 were obtained by homology modelling from the crystal structure of p53 in complex with ASPP2 (PDB accession number 1ycs) (17). All the modelled sequences share at least 60% sequence identity with the corresponding template, therefore ensuring reliable homology models (28). Sequence alignments were generated by using the T-coffee method (29). Three-dimensional models were generated using the MODELLER package, which can generate a large number of models and performs an optimization of the generated models with respect to a defined objective function. This software has been used for wide-scale structure modelling of genomes (30). The selected models were chosen on the basis of the objective function's score. To refine the models, energy minimizations were performed with the GROMACS package (31) using the GROMOS96 force field (32). Images were produced with visual molecular dynamics (VMD) 1.8.5 (33). The complexes of the p53 family members and ASPP1 were constructed by analogy to the complex of p53 with ASPP2 in the 1ycs coordinate file. To characterize the interaction surfaces, the program POPScomp was used (34,35) to detect the residues that are buried upon complex formation. POPScomp calculates the solvent accessible surface area (SASA, in Å2) of each residue before and after the formation of the complex. The structural alignment was performed with the program aliss (Jens Kleinjung, personal communication). Electrostatic surfaces were calculated by the use of the program PYMOL (36) with the implemented subroutine surface APBS (37).
RESULTS
Determination of the oligomerization status of the proteins using gel filtration
Prior to investigating the possible direct interaction between the DNA-binding domains of the p53 family of proteins, p53 (a.a. 94–312) DBD, p63 DBD (a.a. 154–365) and p73 DBD (104–333) and the C-termini of ASPP1 (a.a. 863–1091) and ASPP2 (a.a. 902–1128) (containing four ankyrin repeats and an SH3 domain) (Figure 1A and B) we expressed the corresponding fragments of the proteins in E. coli and examined the oligomeric and folding states of the proteins. For these experiments, we used the DNA-binding regions of the p53 family of proteins, which mapped to the well-characterized p53 DNA-binding domain (a.a. 94–312). Gel filtration studies confirmed that all the constructs were monomeric (Figure 2A) with apparent experimental molecular masses being in good agreement with the theoretically calculated values.
Figure 1.

Schematic diagram of the domains of (A) the p53 family of proteins, indicating the TA, transactivation domain; DBD, DNA-binding domain; TET, tetramerization domain and SAM, Sterile Alpha Motif domain. (B) The ASPP family of proteins, indicating the β-Grasp domain; Pro, proline rich domain; Ank, four ankyrin repeat domains and SH3, domain.
Figure 2.
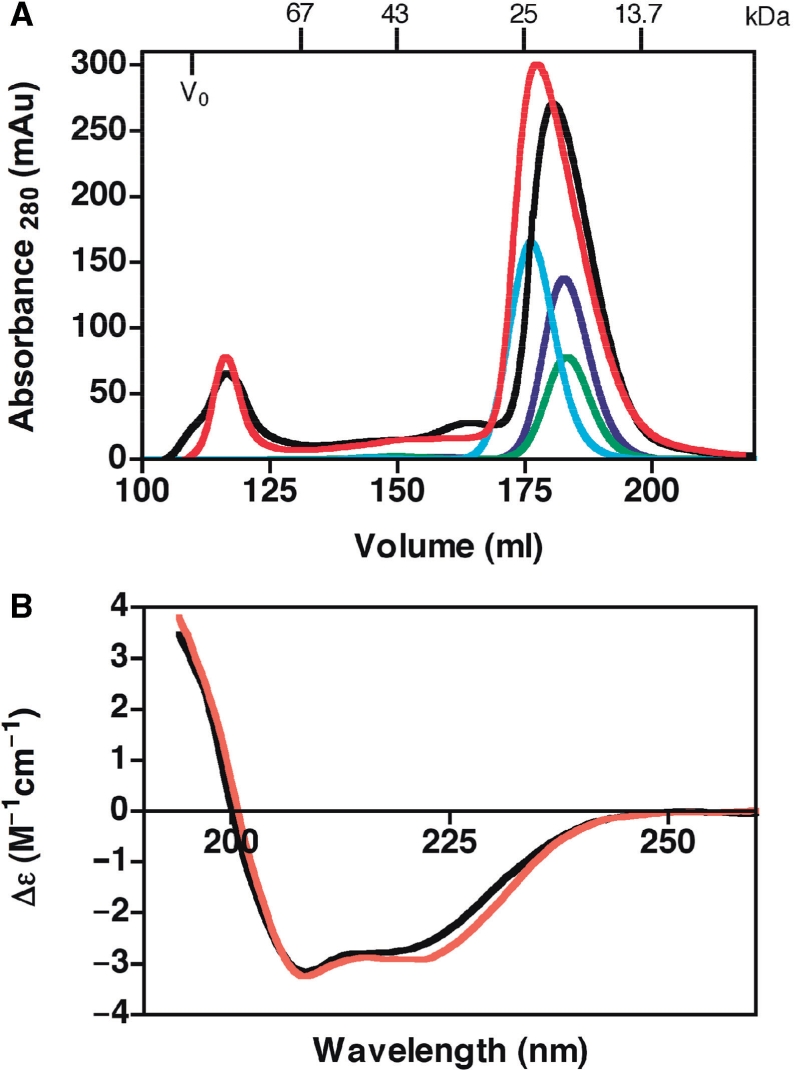
(A) Gel filtration elution profiles of all proteins on Superdex 75 26/60 HP column. The elution profiles for p53 DBD (blue), p63 DBD (green), p73 DBD (cyan), ASPP1 (black) and ASPP2 (red). (B) Far UV CD spectra of ASPP1 and ASPP2. The CD spectra for ASPP1 (black) and ASPP2 (red) were recorded in the region 190–260 nm on a Chirascan spectrometer at 20°C and using a 0.5 mm cell path length.
Far UV CD spectra of ASPP1 and ASPP2 proteins to test if the proteins are folded
Far-UV (190–260 nm) CD spectra of ASPP1 and ASPP2 were recorded to assess the folding state of the proteins (Figure 2B). The spectra were recorded at 20°C. As depicted in Figure 2B, the spectra for both ASPP1 and ASPP2 at 20°C showed overlapping scans with minima at 208 and 222 nm which are characteristic of folded proteins.
Do ASPP1 and ASPP2 bind directly to p53 family of proteins?
Having established that the proteins of interest are monomers in solution and folded at 20°C, we tested if there is direct interaction between the ASPP proteins and the corresponding DNA-binding domains of the p53 family of proteins using ITC and analytical gel filtration. Different ratios were tested to establish the strength of the interactions. The interaction between ASPP2 and p53 DBD was used as a control since it has been reported that the two proteins interact (16,17,19). Our ITC experiments provide for the first time quantitative data and show that both ASPP1 (Figure 3A–C) and ASPP2 (Figure 3D–F) interact directly with all three p53 family of proteins, namely p53, p63 and p73. The Kd values for all the interactions are similar and are in the lower micro-molar range (between 0.5 and 5 μM) (Table 1). These values are in excellent agreement with the recently published Kd value of binding for p53 DBD to 53BP2 (namely ASPP2), with virtually identical constructs (19). ITC provides an accurate determination of the stoichiometry, N, when the concentrations of the interacting components in titration are known. We performed several repeat experiments to try to ensure that the stoichiometry evaluation was correct. In some experiments evidence of aggregation of the complex was noted, however in these experiments the stoichiometry was affected and hence could be ignored (38). Furthermore, the data illustrate that the DNA-binding domains of the p53, p63 and p73 are sufficient for the interaction with the C-terminal domains of ASPP1 and ASPP2, consisting of the four ankyrin repeats and the SH3 domain. A direct interaction between these proteins was also confirmed by analytical size exclusion chromatography. Figure 4A–C shows the relevant chromatograms depicting the interactions between ASPP2 with p53, p63 and p73.
Figure 3.

ITC analysis of the protein–protein binding interactions between the C-terminal region of ASPP1 (A–C) and ASPP2 (D–F) with DNA-binding domains of p53, p63 and p73, respectively.
Table 1.
ITC analysis of the protein–protein interactions between ASPP1 and ASPP2 with the p53 family of proteins
| Protein–protein complex | Ka (M−1) | Kd (µM) | N value | ΔH (kcal mol−1) | TΔS (kcal mol−1) | ΔG (kcal mol−1) |
|---|---|---|---|---|---|---|
| ASPP1 + p53 DBD | 1.9 × 10⁶ | 0.5 | 1.1 | −1.4 | 6.7 | −8.1 |
| ASPP1 + p63 DBD | 1.3 × 10⁶ | 0.8 | 1.0 | −3.7 | 4.3 | −8.0 |
| ASPP1 + p73 DBD | 1.2 × 10⁶ | 0.8 | 1.0 | −5.4 | 2.5 | −7.9 |
| ASPP2 + p53 DBD | 2.0 × 10⁵ | 5.0 | 1.0 | −1.9 | 4.9 | −6.8 |
| ASPP2 + p63 DBD | 4.0 × 10⁵ | 2.5 | 0.9 | −2.0 | 5.3 | −7.3 |
| ASPP2 + p73 DBD | 4.7 × 10⁵ | 2.1 | 0.9 | −0.3 | 7.0 | −7.3 |
Figure 4.
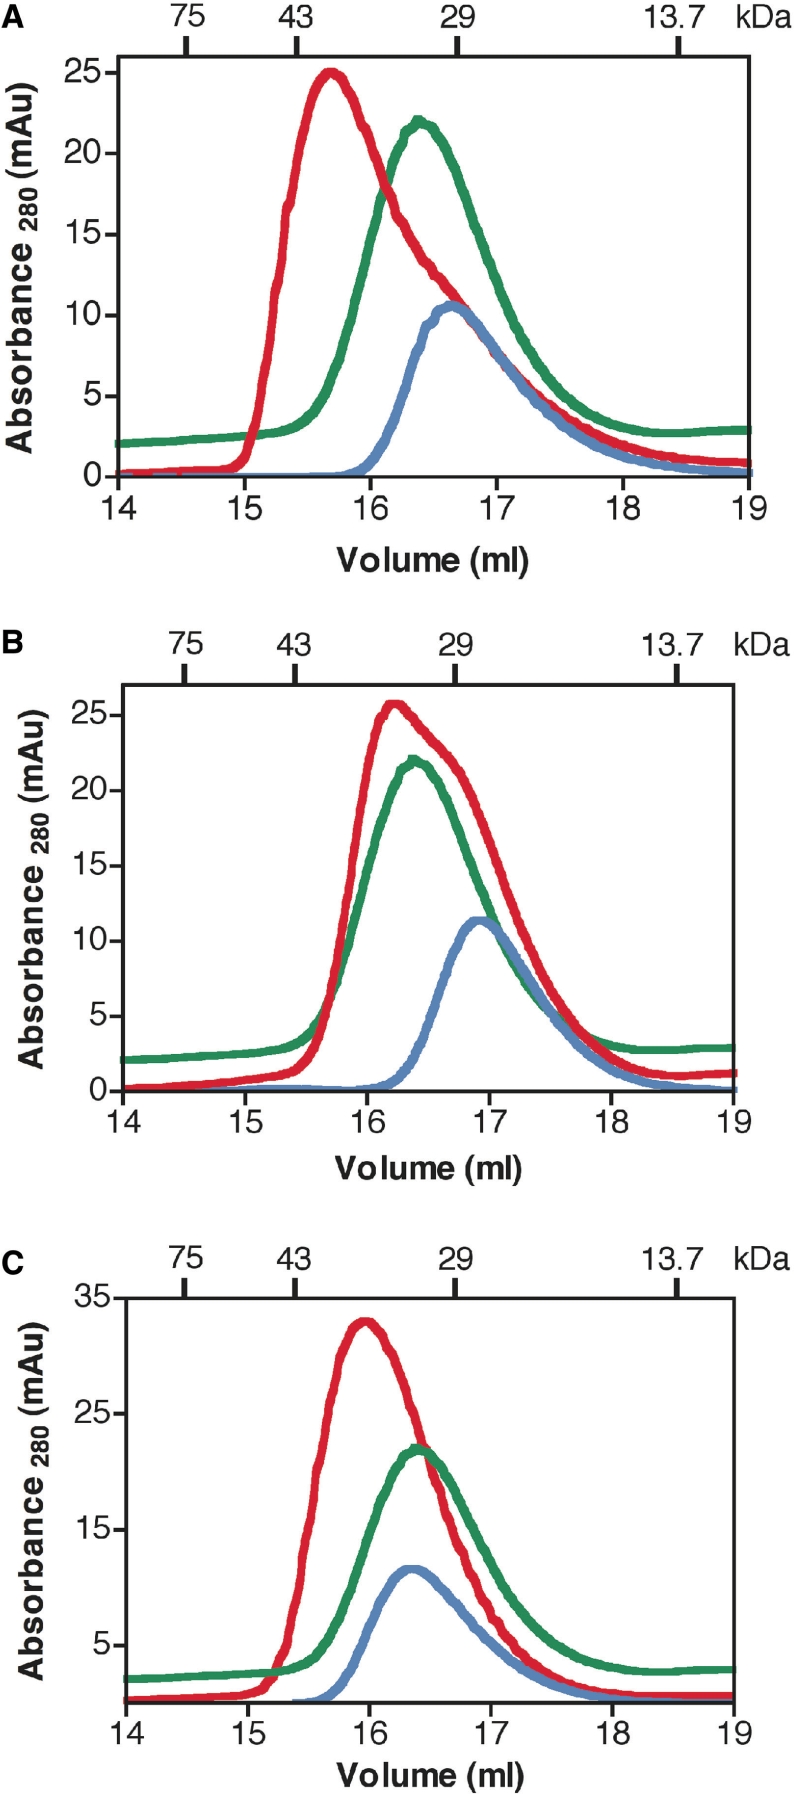
Protein–protein interaction between ASPP2 and p53 (A), p63 (B) and p73 (C) monitored by analytical gel filtration (Superdex 200 10/300). p53, p63 and p73 are shown in blue, ASPP2 in green and the protein–protein complexes (1:1) in red.
How might the ASPP1 and ASPP2 proteins selectively stimulate the apoptotic function of the p53 family of proteins and hence act as common activators?
To gain further understanding of the molecular mechanism of interaction between the ASPP1 and ASPP2 and the p53 family of proteins we tested the following hypothesis: (i) is there a tri-molecular complex formation between ASPP1 and/or ASPP2, the p53 family of proteins and the pro-apoptotic response elements (RE)?; (ii) are ASPP1 and ASPP2 proteins capable of displacing (competing off) p53, p63 and or p73 from the pro-apoptotic RE known to preferentially bind to all three p53 family of proteins?; (iii) are the ASPP1 and ASPP2 proteins common activators of p53, p63 and p73? To investigate the above questions, we carried out EMSA studies with purified recombinant proteins and 30-mer dsDNA promoters of Bax and PUMA as model pro-apoptotic REs known to interact with all three p53 family of proteins (Figures 5 and 6).
Figure 5.

EMSA results after the model protein–DNA complexes were titrated with increasing concentrations of ASPP2, namely, p53–PUMA (A), p63–PUMA (B), p73–PUMA (C), p53–Bax (D), p63–Bax (E) and p73–Bax (F).
Figure 6.

EMSA results after the model protein–DNA complexes were titrated with increasing concentrations of ASPP1, namely, p53–PUMA (A), p63–PUMA (B), p73–PUMA (C), p53–Bax (D), p63–Bax (E) and p73–Bax (F).
The EMSA data show that all p53 family of proteins, namely p53, p63 and p73, can interact with the pro-apoptotic promoters tested forming high molecular mass multimeric protein–DNA complexes (Supplementary Figure 1A–F). However, upon titration of ASPP2 the pro-apoptotic promoters are displaced from the p53–(p63– and p73–) DNA complexes (Figure 5A–F), respectively. Interestingly, under similar experimental conditions, ASPP1 does not seem to displace DNA from the preformed protein–DNA complexes, likely due to the weaker interactions of ASPP1 with the respective p53 protein members (Figure 6A–F and Supplementary Figure 2E and F), respectively. Furthermore, ASPP1 is able to enhance the DNA-binding activity of p53, p63 and p73 on Bax promoter only. Our results demonstrate that the p53, p63 and p73 cannot bind simultaneously to both ligands, namely ASPP1 (ASPP2) and pro-apoptotic promoters. Therefore, the tri-complexes are not formed with the constructs tested. Unexpectedly, we observed that when we titrated high enough concentrations of ASPP2 into the p53–PUMA (or –Bax) complex (Figure 5A, D and Supplementary Figure 2A, D) or p73–PUMA complex (Figure 5C and Supplementary Figure 2C), the ASPP2 protein also formed ASPP2–DNA complexes, which migrate below the p53– or p73–DNA complexes, due to the lower molecular mass. It is known that p53 DBD and p73 DBD form tetrameric protein–DNA complexes (23). However, we did not observe such tendency with ASPP1 (Figure 6B, E) or with ASPP2 and p63 (Figure 5B, E and Supplementary Figure 2B) under the experimental conditions tested. To investigate if the ASPP2 interaction with DNA was specific, we performed a control experiment where instead of PUMA or BAX we used a random DNA of the same length. No binding was observed as shown in the EMSA depicted in the Supplement Figure 2G. Furthermore, upon titrating back p53 or p73, the preformed ASPP2–DNA complex was stripped from the DNA to form the p53– or p73–DNA complexes (Supplementary Figure 2A, C, D).
Modelling the interactions of ASPP1 or ASPP2 and p73 (p63) using structure-based alignment
To map the protein–protein binding surfaces of p73 and p63 with ASPP2, we used the X-ray structure of the p53–53BP2 complex as well as sequence alignment to build the models (17). Based on this structure the corresponding interacting residues in p63 and p73 (Figure 7B and C) were mapped onto the ASPP2 binding surface (Figure 7H) and shown in Table 2. Similarly, we modelled the structure of ASPP1 (Figure 7G) in complex with the p53 family of proteins (Figure 7A–C and Table 2). From the structural alignment of the p53 family members a number of differences can be observed between the interacting residues of p53 and those in p63/p73. The tumour suppressor p53 contains more polar, positively charged residues than p63/p73, namely His 178, Arg 181, Ser 183 and Met 243 in p53, which are Asn 246/196, Leu 249/199, Arg 251/201 and Val 313/263 in p63/p73 (highlighted in Table 2). However, these substitutions are unlikely to affect the protein–protein interactions. The structural alignment of ASPP1 and ASPP2 reveals that Met 1021, Tyr 1023, Met 1026 and Asp 1093 in ASPP2, are Ser 983, Ile 985, Ile 988 and Ser 1055 in ASPP1, respectively, (Table 2). The majority of these substitutions are with amino acids of similar chemical properties so the binding interactions in which they participate remain the same. The analysis of the residues at the interface between the p53-family members and ASPP1/2 (Figure 8) showed that in the complexes with ASPP2 the residue Asp 1093 interacts with the two most frequently mutated p53 residues in cancer, Arg 248 and Arg 273. These are the only two residues that are involved in the interaction of both p53 with ASPP2 and p53 with DNA. The substitution of the negatively charged Asp in ASPP2 with the uncharged Ser 1055 in ASPP1 results therefore in a loss of this functional interaction (Figure 8C). In addition, the distance between the OH-group of the Ser 1055 side-chain and the NH3+ group of the side chains of the two arginines is >4.3 Å.
Figure 7.

Structure-based homology modelling showing protein–protein complexes of p53 (A and D); p63 (B and E) and p73 (C and F) with ASPP1 (G, I, K) and ASPP2 (H, J, L). The models for p63, p73 and ASPP1 were based on the structure 1ycs. The ribbon representation of the proteins (A–C, G, H) have been colour coded as follows: p53 (cyan), p63 (orange), p73 (red), ASPP1 (yellow), ASPP2 (green), zinc atom (purple), DNA-binding site (light purple), hydrophobic residues (white), polar residues (green), negative residues (red) and positive residues (blue). Comparison of the electrostatic potential of the p53, p63, p73 (D–F) and ASPP1 (I and K) and ASPP2 (J and L). The potential ranges from the negative value −6kT (red) to the positive value +6kT (blue). Panels (K) and (L) depict ASPP1 and ASPP2 rotated 180° relative to panels (I) and (J), respectively.
Table 2.
Buried SASA for the protein–protein complexes of ASPP2 and ASPP1 with the p53 family of proteins based on 1ycs [Gorina and Pavletich, (17)]. The most significant differences between ASPP1 and ASPP2 and between the p53 family members are shown in bold
| Residue | p53 DBD |
p63 DBD |
p73 DBD |
|||
|---|---|---|---|---|---|---|
| Residue | ▵SASA | Residue | ▵SASA | Residue | ▵SASA | |
| Å2 | Å2 | Å2 | ||||
| ASPP2 | ||||||
| TYR 1023 | HIS 178 | 121.6 | ASN 246 | 91.0 | ASN 196 | 47.2 |
| SER 1024 | ARG 181 | 62.5 | HIS 247 | 16.0 | LEU 199 | 31.0 |
| MET 1026 | SER 183 | 48.3 | GLU 252 | 33.2 | ARG 201 | 153.7 |
| GLN 1071 | SER 241 | 32.9 | SER 311 | 28.8 | SER 261 | 34.0 |
| ASN 1072 | MET 243 | 101.4 | VAL 313 | 18.0 | VAL 263 | 73.6 |
| GLU 1094 | ASN 247 | 40.2 | ASN 317 | 22.8 | ASN 267 | 43.7 |
| GLU 1096 | ARG 248 | 153.6 | ARG 318 | 164.6 | ARG 268 | 154.4 |
| TRP 1097 | ARG 280 | 29.2 | ARG 350 | 53.7 | ARG 300 | 29.5 |
| ASPP1 | ||||||
| ILE 985 | HIS 178 | 110.6 | ASN 246 | 71.4 | ASN 196 | 49.4 |
| SER 986 | ARG 181 | 58.3 | LEU 249 | 54.2 | LEU 199 | 47.3 |
| ILE 988 | SER 183 | 49.8 | ARG 251 | 63.2 | ARG 201 | 143.2 |
| GLN 1033 | SER 241 | 32.5 | SER 311 | 28.8 | SER 261 | 31.7 |
| ASN 1034 | MET 243 | 102.0 | VAL 313 | 54.5 | VAL 263 | 77.1 |
| GLU 1056 | ASN 247 | 39.6 | ASN 317 | 49.0 | ASN 267 | 41.7 |
| GLU 1058 | ARG 248 | 151.9 | ARG 318 | 147.7 | ARG 268 | 149.5 |
| TRP 1059 | ARG 280 | 29.0 | ARG 350 | 24.5 | ARG 300 | 22.5 |
Figure 8.

Superimposition of the p53–DNA complex (1tsr) onto the p53–ASPP2 protein–protein complex (1ycs). The overlaid structures are shown in (A). Structure (A) rotated at 180° is shown in (B). The colour coding is as follows: p53 DBD (cyan), DNA (pink), ASPP2 (green). (C) Close-up view of the interface of p53 and ASPP2 side-chains (with the model of ASPP1 overlaid) are shown in liquorice representation, Arg 248, Arg 273 and Asp 1093 are coloured according to atoms type; Ser 1055 (in ASPP1) is displayed in orange and hydrogen bonds in black.
With regards to p53 cancer-associated DNA contact mutants, R248Q (W) and R273H, the following observations could be made based on the structure-based homology models. In general, the p53 region of 248 is in close proximity with some bulky residues in ASPP2, creating steric hindrance (i.e. the tryptophan at position 1097 in ASPP2). Specifically, when R248 in p53 is mutated to tryptophan there would be a steric clash with the glutamic acid (a.a.1094) in ASPP2. The arginine substitution to glutamine (Q) in p53 creates a weaker interaction with the aspartic acid (D) at position 1093 in ASPP2. There is a stretch of negative residues (a.a. 1090–1096) EDEDEIE in ASPP2 facing the R248 in p53. Therefore a charged residue such as Arg in position 248 seems to favour the binding with ASPP2. For R273 it has been reported that this amino acid residue is located at the edge of the ASPP2 binding interface (17). The model proposed here (Figure 8C) suggests that the substitution of arginine to histidine at position 273 would disturb the interaction with aspartic acid 1093 in ASPP2 and therefore weaken the binding.
The structure-based sequence alignment between p53, p63 and p73 shows that the Arg 248 and Arg 273 are conserved. Hence, the same conclusions could apply to p63 and p73. The electrostatic surfaces of the p53 family members, namely p53, p63, p73 (Figure 7D–F), respectively, are very similar since they are all mainly positively charged but p63 and p73 show a relatively more positive surface than p53 around the DNA-binding site. This could account for the different selectivity within the p53 family of proteins for p53 RE. The electrostatic p53-binding surfaces for ASPP1 and ASPP2 show an overall negative charge (Figure 7I and J), but a positive charge on the opposite side (Figure 7K and L). It is reasonable to assume that the ASPP–DNA interactions observed in the EMSA occur on the positive interface. The ‘back view’ of ASPP2 appears to have a more positive surface area than ASPP1, which could provide further evidence for our observation that ASPP2 displaces the DNA more readily than ASPP1.
DISCUSSION
To shed further light on how ASPP1 and ASPP2 might stimulate apoptosis we investigated the intrinsic nature of the interactions between the ASPP1 and ASPP2 and the p53 family of proteins, namely p53, p63 and p73, using biochemical and biophysical methods with purified proteins. We have probed the mechanism of these interactions by using Bax and PUMA as model apoptotic promoters. We first show that ASPP1 and ASPP2 directly interact with p53, p63 and p73 and that the DNA-binding domains of the p53 family of proteins are sufficient for the interaction with the ASPPs. Our data based on the equilibrium binding constants obtained by ITC also show that the interaction between the C-terminal domains of ASPP1 and ASPP2 to p53 DBD, p63 DBD and p73 DBD are very similar and are in the lower micro molar range. This is to be expected given the high amino acid identity in the DNA-binding domains between the p53 family members (about 60%) and C-termini of ASPP1 and ASPP2 (80%).
Evidence for possible interaction of ASPP2, which was known as 53BP2, with p53 (but not with mutant p53) was shown first by a yeast two-hybrid system (16). The same report showed that p53 cannot bind simultaneously to the C-terminal fragment of ASPP2 and to a DNA containing the p53 consensus binding sequence. However, no reference was made with respect to ASPP2 or ASPP1 binding to DNA. The interaction between ASPP2 and p53 protein was confirmed when the X-ray structure of the complex between the p53 tumour suppressor DNA binding domain and the ankyrin and SH3 domains of the 53BP2 was solved (17). The structure revealed that the 53BP2-binding interface to p53 protein overlapped with the DNA-binding site. This observation provided the framework for understanding why the most frequently mutated p53 residues in human cancers called ‘hot spots’ failed to bind to ASPP2 as well as to DNA (17). Samuels-Lev et al. (14) identified that 53BP2 was the C-terminal fragment of a much larger protein, which was termed ASPP2, and identified its homologue ASPP1. Furthermore, it was shown that both ASPP1 and ASPP2 can stimulate the apoptotic function not only of p53 but also that of the p53 homologous proteins p63 and p73 (15). However, the molecular mechanism of stimulation of apoptosis by ASPP1 and ASPP2 remains unknown.
To further investigate the mechanism of enhancement of apoptosis by ASPP1 and ASPP2, we carried out in vitro DNA-binding studies using two model apoptotic promoters, Bax and PUMA. Our EMSA results show that all proteins, p53 DBD, p63 DBD and p73 DBD, bind to both Bax and PUMA specifically although with different affinity. Having established the conditions at which most of the DNA was shifted into a complex with the corresponding proteins we then titrated increasing amounts of ASPP1 and or ASPP2 into the pre-formed protein–DNA complexes to test the possibility of tri-complex formation. Our data revealed that by titrating increasing amounts of ASPP2, the apoptotic promoter, Bax, was displaced from the preformed p53–, p63– and p73–DNA complexes. These observations suggest that the binding between ASPP2 and p53 (or p63 or p73) might be stronger than that between p53– (or p63– or p73–) Bax complexes. Indeed, our Kd values for the ASPP2–p53 (or -p63 or -p73) interactions are 0.5–5 µM. The Kd value of p53 with Bax has been reported to be 48 µM (19), which is about 10-fold lower affinity than the protein–protein interactions for ASPP2 and the p53 family of proteins.
Similar observations were reported recently for p53 and 53BP2 with PIG3 and Bax (19). The authors showed that some key p53 mutants such as R273H can bind to 53BP2 with low micro molar range affinity and confirmed that binding between the p53 and 53BP2, and DNA is mutually exclusive since 53BP2 competes off the DNA (pro-apoptotic RE of p53) (19). Robinson et al. (21) reported the Kd's for iASPP and ASPP2 with p53 family of proteins using a solid phase binding assay (rather than equilibrium studies which were used here) and a shorter construct of ASPP2 (a.a. 905–1128). The Kd values are significantly different than those observed here and that of p53 DBD and ASPP2 by Tidow et al. (19). Surprisingly, we observed ASPP2 binding to PUMA when high enough concentrations were titrated into p53– or p73–PUMA complexes. Furthermore, upon challenging the preformed ASPP2–PUMA complex with relatively small excess of p53 or p73, we observed displacement of ASPP2 from the complex, resulting in p53– or p73–PUMA complexes. This suggests that p53 and p73 have higher affinity for PUMA than ASPP2 for PUMA.
Our studies with ASPP1 and p53 family of proteins whilst showing a similar trend as the data with ASPP2, suggest that higher concentrations of ASPP1 are needed to displace the DNA from the preformed protein–DNA complexes. It is plausible that ASPP1–p53, –p63 and –p73 complexes have different DNA-binding abilities towards different promoters i.e PUMA versus Bax. We carried out structure-based alignment to probe the interface between the ASPP2, p63 and p73 based on the X-ray structure of the complex between ASPP2 and p53. In addition, we built models between ASPP1 and p53, p63 and p73. The models provide further evidence that the binding of the DNA and ASPP1 or ASPP2 to p53 or p63 or p73 is mutually exclusive due to the overlapping binding interface, which cannot accommodate tri-complex formation (as supported by our structure-based homology modelling depicted in Figures 7A and B and 8A and B). The models provide further evidence in support of the potential differences in the DNA-binding abilities between ASPP1 and 2 as well as the differences in the displacement of the p53–, p63– and p73–DNA complexes.
CONCLUSIONS
Several models were postulated to explain how a cell might choose between cell cycle arrest and cell death. One of those models (the selective binding model) proposed that the ASPP1 and ASPP2 proteins might act as co-factors and hence might alter the p53 binding specificity and selectivity facilitating their binding to the apoptotic promoters (13). Alternatively, co-factors such as Haematopoietic zinc finger (HZF), which is induced by p53 and binds to its DNA-binding domain, might result in preferential transactivation of cell cycle arrest promoters.
However, our results taken together with reports by others ruled out the possibility of tri-complex formation as a possible mechanism of stimulation of apoptosis by ASPP1 and ASPP2. Could ASPP2 and/or ASPP1 binding specifically to proapoptotic promoters provide a clue for their function as coactivators of p53 protein family? Further structural and molecular studies are needed to probe deeper into the mechanism and function of these proteins.
SUPPLEMENTARY DATA
Supplementary Data are available at NAR Online.
ACKNOWLEDGEMENTS
We are grateful to Prof Xin Lu for providing the cDNA of the ASPP1 and ASPP2, Dr Peter Wang for providing the clones of p63 and p73, Drs Tam Bui and Alex Drake for access and help with CD. We are indebted to Prof. Brian Sutton for all of his support and advice during the course of this study. This study was supported by AICR research grant and the Royal Society research grant to Dr P.V.N. Prof. J.E.L. is a Wellcome Trust Senior Research Fellow. Funding to pay the Open Access publication charges for this article was provided by the School of Biomedical and Heath Sciences, KCL.
Conflict of interest statement. None declared.
REFERENCES
- 1.Slee EA, O'Connor DJ, Lu X. To die or not to die: how does p53 decide? Oncogene. 2004;23:2809–2818. doi: 10.1038/sj.onc.1207516. [DOI] [PubMed] [Google Scholar]
- 2.Caelles C, Helmberg A, Karin M. p53-dependent apoptosis in the absence of transcriptional activation of p53-target genes. Nature. 1994;370:220–223. doi: 10.1038/370220a0. [DOI] [PubMed] [Google Scholar]
- 3.Haupt Y, Rowan S, Shaulian E, Vousden KH, Oren M. Induction of apoptosis in HeLa cells by trans-activation-deficient p53. Genes Dev. 1995;9:2170–2183. doi: 10.1101/gad.9.17.2170. [DOI] [PubMed] [Google Scholar]
- 4.Bell HS, Dufes C, O'Prey J, Crighton D, Bergamaschi D, Lu X, Schatzlein AG, Vousden KH, Ryan KM. A p53-derived apoptotic peptide derepresses p73 to cause tumor regression in vivo. J. Clin. Invest. 2007;117:1008–1018. doi: 10.1172/JCI28920. [DOI] [PMC free article] [PubMed] [Google Scholar]
- 5.Ko LJ, Prives C. p53: puzzle and paradigm. Genes Dev. 1996;10:1054–1072. doi: 10.1101/gad.10.9.1054. [DOI] [PubMed] [Google Scholar]
- 6.Kravchenko JE, Ilyinskaya GV, Komarov PG, Agapova LS, Kochetkov DV, Strom E, Frolova EI, Kovriga I, Gudkov AV, Feinstein E, et al. Small-molecule RETRA suppresses mutant p53-bearing cancer cells through a p73-dependent salvage pathway. Proc. Natl Acad. Sci. USA. 2008;105:6302–6307. doi: 10.1073/pnas.0802091105. [DOI] [PMC free article] [PubMed] [Google Scholar]
- 7.Flores ER, Tsai KY, Crowley D, Sengupta S, Yang A, McKeon F, Jacks T. p63 and p73 are required for p53-dependent apoptosis in response to DNA damage. Nature. 2002;416:560–564. doi: 10.1038/416560a. [DOI] [PubMed] [Google Scholar]
- 8.Flores ER, Sengupta S, Miller JB, Newman JJ, Bronson R, Crowley D, Yang A, McKeon F, Jacks T. Tumor predisposition in mice mutant for p63 and p73: evidence for broader tumor suppressor functions for the p53 family. Cancer Cell. 2005;7:363–373. doi: 10.1016/j.ccr.2005.02.019. [DOI] [PubMed] [Google Scholar]
- 9.Senoo M, Manis JP, Alt FW, McKeon F. p63 and p73 are not required for the development and p53-dependent apoptosis of T cells. Cancer Cell. 2004;6:85–89. doi: 10.1016/j.ccr.2004.06.005. [DOI] [PubMed] [Google Scholar]
- 10.Blandino G, Dobbelstein M. p73 and p63: why do we still need them? Cell Cycle. 2004;3:886–894. [PubMed] [Google Scholar]
- 11.Urist M, Prives C. p53 leans on its siblings. Cancer Cell. 2002;1:311–313. doi: 10.1016/s1535-6108(02)00064-8. [DOI] [PubMed] [Google Scholar]
- 12.Benchimol S. p53—an examination of sibling support in apoptosis control. Cancer Cell. 2004;6:3–4. doi: 10.1016/j.ccr.2004.07.002. [DOI] [PubMed] [Google Scholar]
- 13.Espinosa JM. Mechanisms of regulatory diversity within the p53 transcriptional network. Oncogene. 2008;27:4013–4023. doi: 10.1038/onc.2008.37. [DOI] [PMC free article] [PubMed] [Google Scholar]
- 14.Samuels-Lev Y, O'Connor DJ, Bergamaschi D, Trigiante G, Hsieh JK, Zhong S, Campargue I, Naumovski L, Crook T, Lu X. ASPP proteins specifically stimulate the apoptotic function of p53. Mol. Cell. 2001;8:781–794. doi: 10.1016/s1097-2765(01)00367-7. [DOI] [PubMed] [Google Scholar]
- 15.Bergamaschi D, Samuels Y, Jin B, Duraisingham S, Crook T, Lu X. ASPP1 and ASPP2: common activators of p53 family members. Mol. Cell Biol. 2004;24:1341–1350. doi: 10.1128/MCB.24.3.1341-1350.2004. [DOI] [PMC free article] [PubMed] [Google Scholar]
- 16.Iwabuchi K, Bartel PL, Li B, Marraccino R, Fields S. Two cellular proteins that bind to wild-type but not mutant p53. Proc. Natl Acad. Sci. USA. 1994;91:6098–6102. doi: 10.1073/pnas.91.13.6098. [DOI] [PMC free article] [PubMed] [Google Scholar]
- 17.Gorina S, Pavletich NP. Structure of the p53 tumor suppressor bound to the ankyrin and SH3 domains of 53BP2. Science. 1996;274:1001–1005. doi: 10.1126/science.274.5289.1001. [DOI] [PubMed] [Google Scholar]
- 18.Cho Y, Gorina S, Jeffrey PD, Pavletich NP. Crystal structure of a p53 tumor suppressor-DNA complex: understanding tumorigenic mutations. Science. 1994;265:346–355. doi: 10.1126/science.8023157. [DOI] [PubMed] [Google Scholar]
- 19.Tidow H, Veprintsev DB, Freund SM, Fersht AR. Effects of oncogenic mutations and DNA response elements on the binding of p53 to p53-binding protein 2 (53BP2) J. Biol. Chem. 2006;281:32526–32533. doi: 10.1074/jbc.M604725200. [DOI] [PubMed] [Google Scholar]
- 20.Tidow H, Andreeva A, Rutherford TJ, Fersht AR. Solution structure of ASPP2 N-terminal domain (N-ASPP2) reveals a ubiquitin-like fold. J. Mol. Biol. 2007;371:948–958. doi: 10.1016/j.jmb.2007.05.024. [DOI] [PubMed] [Google Scholar]
- 21.Robinson RA, Lu X, Jones EY, Siebold C. Biochemical and structural studies of ASPP proteins reveal differential binding to p53, p63, and p73. Structure. 2008;16:259–268. doi: 10.1016/j.str.2007.11.012. [DOI] [PubMed] [Google Scholar]
- 22.Rotem S, Katz C, Benyamini H, Lebendiker M, Veprintsev DB, Rudiger S, Danieli T, Friedler A. The structure and interactions of the proline rich domain of ASPP2. J. Biol. Chem. 2008;283:18990–18999. doi: 10.1074/jbc.M708717200. [DOI] [PubMed] [Google Scholar]
- 23.Patel S, Bui TT, Drake AF, Fraternali F, Nikolova PV. The p73 DNA binding domain displays enhanced stability relative to its homologue, the tumor suppressor p53, and exhibits cooperative DNA binding. Biochemistry. 2008;47:3235–3244. doi: 10.1021/bi7023207. [DOI] [PubMed] [Google Scholar]
- 24.Bullock AN, Henckel J, DeDecker BS, Johnson CM, Nikolova PV, Proctor MR, Lane DP, Fersht AR. Thermodynamic stability of wild-type and mutant p53 core domain. Proc. Natl Acad. Sci. USA. 1997;94:14338–14342. doi: 10.1073/pnas.94.26.14338. [DOI] [PMC free article] [PubMed] [Google Scholar]
- 25.Nikolova PV, Henckel J, Lane DP, Fersht AR. Semirational design of active tumor suppressor p53 DNA binding domain with enhanced stability. Proc. Natl Acad. Sci. USA. 1998;95:14675–14680. doi: 10.1073/pnas.95.25.14675. [DOI] [PMC free article] [PubMed] [Google Scholar]
- 26.Nikolova PV, Wong KB, DeDecker B, Henckel J, Fersht AR. Mechanism of rescue of common p53 cancer mutations by second-site suppressor mutations. EMBO J. 2000;19:370–378. doi: 10.1093/emboj/19.3.370. [DOI] [PMC free article] [PubMed] [Google Scholar]
- 27.Schmid FX. Optical spectroscopy to characterize protein conformation and conformational changes. In: Creighton TE, editor. Protein Structure: A Practical Approach. 2nd edn. Oxford: Oxford University Press; 1997. pp. 261–296. [Google Scholar]
- 28.Rost B. Twilight zone of protein sequence alignments. Protein Eng. 1999;12:85–94. doi: 10.1093/protein/12.2.85. [DOI] [PubMed] [Google Scholar]
- 29.Notredame C, Higgins DG, Heringa J. T-Coffee: a novel method for fast and accurate multiple sequence alignment. J. Mol. Biol. 2000;302:205–217. doi: 10.1006/jmbi.2000.4042. [DOI] [PubMed] [Google Scholar]
- 30.Marti-Renom MA, Stuart AC, Fiser A, Sanchez R, Melo F, Sali A. Comparative protein structure modeling gene and genomes. Annu. Rev. Biophys. Biomol. Struct. 2000;29:291–325. doi: 10.1146/annurev.biophys.29.1.291. [DOI] [PubMed] [Google Scholar]
- 31.Berendsen HJC, van der Spoel D, van Drunen R. GROMACS: a message-passing molecular dynamics implementation. Comput. Phys. Commun. 1995;91:43–56. [Google Scholar]
- 32.Daura X, Mark AE, van Gunsteren WF. Parametrization of aliphatic CHn nited atoms of GROMOS96 force field. J. Comput. Chem. 1998;19:535–547. [Google Scholar]
- 33.Humphrey W, Dalke A, Schulten K. VMD: visual molecular dynamics. J. Mol. Graph. 1996;14:33–38. doi: 10.1016/0263-7855(96)00018-5. [DOI] [PubMed] [Google Scholar]
- 34.Kleinjung J, Fraternali F. POPSCOMP: an automated interaction analysis of biomolecular complexes. Nucleic Acids Res. 2005;33:W342–W346. doi: 10.1093/nar/gki369. [DOI] [PMC free article] [PubMed] [Google Scholar]
- 35.Fraternali F, Cavallo L. Parameter optimized surfaces (POPS): analysis of key interactions and conformational changes in the ribosome. Nucleic Acids Res. 2002;30:2950–2960. doi: 10.1093/nar/gkf373. [DOI] [PMC free article] [PubMed] [Google Scholar]
- 36.DeLano WL. The PyMOL Molecular Graphics System. San Carlos, CA, USA: DeLano Scientific; 2002. [Google Scholar]
- 37.Baker NA, Sept D, Joseph S, Holst MJ, McCammon JA. Electrostatics of nanosystems: application to microtubules and the ribosome. Proc. Natl Acad. Sci. USA. 2001;98:10037–10041. doi: 10.1073/pnas.181342398. [DOI] [PMC free article] [PubMed] [Google Scholar]
- 38.Schon O, Friedler A, Bycroft M, Freund SM, Fersht AR. Molecular mechanism of the interaction between MDM2 and p53. J. Mol. Biol. 2002;323:491–501. doi: 10.1016/s0022-2836(02)00852-5. [DOI] [PubMed] [Google Scholar]
Associated Data
This section collects any data citations, data availability statements, or supplementary materials included in this article.