

Summary
Tandem mass spectrometry (MS/MS) experiments often generate redundant datasets containing multiple spectra of the same peptides. Clustering of MS/MS spectra takes advantage of this redundancy by identifying multiple spectra of the same peptide and replacing them with a single representative spectrum. Analyzing only representative spectra results in significant speed-up of MS/MS database searches. We present an efficient clustering approach for analyzing large MS/MS datasets (over ten million spectra) with a capability to reduce the number of spectra submitted to further analysis by an order of magnitude. The MS/MS database search of clustered spectra results in fewer spurious hits to the database and increases number of peptide identifications as compared to regular non-clustered searches. Our open source software MS-Clustering is available for download at http://peptide.ucsd.edu or can be run online at http://proteomics.bioprojects.org/MassSpec.
Keywords: Clustering, MS/MS, database search, spectral archives, spectral libraries
Introduction
Tandem mass spectrometry (MS/MS) experiments often generate millions of spectra that can be used to identify thousands of proteins in complex samples. Analyzing such large datasets poses a computational challenge. The most common computational approach is to search spectra against a protein database [1, 2, 3, 4, 5, 6]. However, even fast algorithms which employ tag based [7, 8, 9] database filtration (used by InsPecT [5] and the Paragon algorithm [6]) or two-pass database reduction (used by X!Tandem [3]), still reach a computational bottleneck when analyzing millions of spectra against large protein databases, particularly when mutations and unexpected post-translational modifications (PTMs) are considered.
Typically in MS/MS analysis, each mass spectrum in the dataset is searched against a sequence database. At times this can be very inefficient since MS/MS datasets contain many redundancies (it is common for peptides to get selected for fragmentation more than once [10]). When mass spectra are collected from several runs, such redundancies can add up to hundreds and even thousands of spectra from the same peptide. Instead of repeating the identification process for each spectrum, it can be beneficial to perform this process once and apply the results to all similar spectra. Tabb et al., 2003 [10] demonstrated how clustering can speed-up the analysis of single runs (though at the cost of losing some peptide identifications). This approach was later improved with the MS2Grouper algorithm [11] which was able to reduce the number of spectra that have to be searched by 20% with a reasonable trade-off of just 1% reduction in number of peptides identified when run on datasets of ≈ 50000 spectra. Beer et al., 2004 [12] developed the Pep-Miner clustering algorithm and applied it to datasets of ≈ 500; 000 spectra. They demonstrated how clustering improves analysis by reducing the runtime and generating additional peptide identifications. However, Pep-Miner (developed at IBM) is not publicly available, and little information was given on its clustering performance. Pep-Miner also relies on retention time prediction for clustering quality assurance, which can be diffcult to calibrate when multiple MS runs are being clustered, unless the runs are carefully aligned [15].
Recently, researchers have tried to adapt new algorithmic ideas, first developed in the context of Internet and database clustering, to MS/MS clustering. Ramakrishnan et al., 2006 [14] and Dutta and Chen, 2007 [15] proposed to use metric space embedding for MS/MS database search and clustering. While these promising approaches offer a potential solution to the problem of clustering very large datasets, the applications of these new ideas were illustrated only with a related task of filtering candidates for database searches [14] or for clustering with relatively small spectral datasets [15].
Due to the nature of MS/MS clustering, the choice of pre-processing parameters, measures of spectral similarity, and construction of cluster representatives are no less important than the speed of the clustering algorithm. For example, a fast clustering algorithm generating low-quality clustered spectra (as compared to the quality of the non-clustered spectra) is not very useful for MS/MS database searches. We developed a simple and effiective MS-Clustering algorithm which is designed to rapidly process large MS/MS datasets (even in the excess of ten million spectra), while insuring the high quality of the resulting clusters. MS-Clustering reduces the number of spectra that have to be searched by up to 90% without reducing the number of identified peptides and proteins (and in many cases even increasing the number of identifications). The number of spectra identified when a clustered dataset is searched is much higher than the number of identifications made with a standard search of non-clustered data (for large datasets the number can be doubled). This increase can be attributed to many weak spectra that do not get identified in a database search, but get identified indirectly with clustering because “spectrum vs. spectrum” analysis has some advantages over the traditional “spectrum vs. peptide” analysis. Particularly, it is diffcult to predict the intensities of peaks in a theoretical spectrum (comparison with a theoretical spectrum is the basis of several MS/MS database search algorithms). Often a spectrum will show higher similarity to another experimental spectrum of the same peptide than it shows to the peptide’s predicted theoretical spectrum. Thus, the spectrum can get identified via its cluster membership even though it does not get identified in a database search (this principle of similarity between experimental spectra is the basis for the spectral library approaches to peptide identifications [16, 17, 18, 19, 20, 21]). For this reason clustering also reduces the number of false database identifications with low-quality spectra (a low signal-to-noise ratio is a leading cause of erroneous database identifications). By joining together both high-quality and low-quality spectra of the same peptide, we decrease the probability of making erroneous identifications as a result of searching the low-quality spectra separately.
Another benefit of clustering is that it can help focus a researcher’s efforts when selecting candidates for advanced time-consuming searchers. For example, while it is possible to identify spectra of peptides with mutations, single amino acid polymorphisms, and unexpected PTMs using “blind” PTM searches [22], such searches against large databases become rather time-consuming. By restricting this advanced search to the set of unidentified clusters, we can reduce the computational time required for advanced analysis. Finding large unidentified clusters can also point us to interesting cases that are not identified in existing database searches such as programmed frameshifts or DNA sequencing errors [23].
Materials and Methods
MS/MS Datasets
We used three MS/MS datasets generated from samples of different organisms to analyze our algorithm’s performance (see references for complete details on the protocols used to generate the data).
Human [24] - 11.4 million spectra from 14 runs from samples of the HEK293 cell culture. Spectra were acquired on an LTQ linear ion trap tandem mass spectrometer. The sequence database used to identify proteins was human IPI (version 3.18, 26.7M amino acids). In addition to performing experiments on all 14 runs, we selected a single run (793000 spectra) and a subset of five runs (4 million spectra) for our experiments, in order to evaluate how increasing the number of runs affects the clustering and identification performance.
Shewanella [25, 23] - 14.5 million spectra from multiple samples of Shewanella oneidensis MR-1. The majority of the spectra were generated on ion-trap mass spectrometers, while approximately 2 million mass spectra generated by an FT-ICR mass spectrometer. The sequence database used to identify proteins was downloaded from NCBI (release 20070113, 1.45M amino acids).
Dictyostelium [26] - 1.4 million spectra from samples of light-chain, heavy-chain, and un-defined cells of Dictyostelium discoideum, acquired on an LTQ linear ion trap tandem mass spectrometer. The sequence database used to identify proteins was downloaded from Dicty-base.org (release 20060828, 7.36M amino acids).
Yeast [27] - 179377 spectra from samples of Saccharomyces cerevisiae, acquired on an LCQ-Dexa XP ion-trap mass spectrometer. We used 3 small runs with different experimental settings: nanoLC-LC MS/MS (MudPIT), nanoLC-MS/MS with gas phase fractionation by mass range selection, and nanoLC-MS/MS with gas phase fractionation by ion abundance selection. The sequence database used to identify proteins was downloaded from SGD (release 20070112, 4.94M amino acids).
Database Search
We used the InsPecT database search tool [5] to perform peptide identifications (release 20070613), using the default search parameters (precursor mass tolerance 2.5 Da, fragment ion tolerance 0.5 Da). All searches were performed using a shuffled decoy database. When computing Inspect F-scores, the files from each experiment were pooled together (rather than analyzing them in a run-by-run fashion). The InsPecT F-score threshold values for accepting identifications were selected to ensure a true positive peptide identification rate of 98% (i.e., only 2% of the peptide hits came from the decoy database).
Filtering MS/MS Datasets
Large MS/MS datasets contain many low-quality spectra that cannot result in reliable peptide identifications [28, 29]. Typically, when a whole MS/MS dataset is searched, only a small fraction of the spectra (less than 20%) get identified. Many low-quality spectra have characteristics that distinguish them from identifiable spectra (lack of complimentary b/y peak pairs, lack of peptide sequence tags, etc.) which can be used by classification algorithms to identify these spectra [28, 30, 29, 31]. Removing such spectra is beneficial to clustering performance since it reduces the number of spectra that undergo pairwise comparisons. Furthermore, filtering reduces the number of clusters generated by the algorithm that get submitted for further analysis. We performed spectral quality filtering as a pre-processing step using our in-house software MS-Filter (available from http://peptide.ucsd.edu). MS-Filter uses an approach similar to the one described in ref. [29] and complements it by charge selection, and precursor mass correction. The filtering procedure typically requires ≈ 5 milliseconds per spectrum. We ran all experiments with the default quality threshold values. Though filtering can lead to the exclusion of some identifiable spectra (less than 0.5%, as benchmarked at the default values), filtering can actually increase the identification rates for a given true positive rate. For example, when searching a single run from the Human samples, filtering increased the number of spectra, peptides, and proteins identified by approximately 0.7% (see Table 1). The additional identifications can be attributed to the fact that when many low quality spectra are removed by the filtering, the number of spurious hits to the decoy database is greatly reduced. Thus for a given true positive rate, the score threshold required to accept an identification is lower with a filtering dataset than it is with an unfiltering one.
Table 1.
Clustering performance with different similarity thresholds. Results are shown for a single run from the human dataset (793000 spectra searched against the human IPI sequence database). For each similarity threshold we report the number of spectra searched, the number of spectra identified, the number of peptides identified and the number of proteins identified. These values are compared with the values obtained from a regular non-clustered search of the same dataset (the difference is reported as a percentage).
| Similarity threshold | Spectra/Clusters searched | Spectra identified | Peptides identified | Proteins identified | ||||
|---|---|---|---|---|---|---|---|---|
| Non-clustered | 793000 | 86682 | 21090 | 6191 | ||||
| 0.30 | 167407 | −78.9% | 116571 | +34.5% | 18352 | −13.0% | 5772 | −6.8% |
| 0.35 | 204851 | −74.2% | 114196 | +31.7% | 19503 | −7.5% | 5991 | −3.2% |
| 0.40 | 241489 | −69.5% | 111309 | +28.4% | 20142 | −4.5% | 6096 | −1.5% |
| 0.45 | 276059 | −65.2% | 104983 | +21.1% | 20592 | −2.4% | 6178 | −0.2% |
| 0.50 | 309501 | −61.0% | 102859 | +18.7% | 20978 | −0.5% | 6229 | +0.6% |
| 0.55 | 340847 | −57.0% | 99488 | +14.8% | 21142 | +0.2% | 6282 | +1.5% |
| 0.60 | 369159 | −53.4% | 95764 | +10.5% | 21163 | +0.3% | 6275 | +1.4% |
| 0.65 | 394990 | −50.2% | 93511 | +7.9% | 21224 | +0.6% | 6266 | +1.2% |
| 0.70 | 417576 | −47.3% | 92666 | +6.9% | 21349 | +1.2% | 6300 | +1.8% |
| 0.75 | 436973 | −44.9% | 91269 | +5.3% | 21412 | +1.5% | 6310 | +1.9% |
| 0.80 | 452294 | −43.0% | 90018 | +3.8% | 21386 | +1.4% | 6289 | +1.6% |
| 0.85 | 467361 | −41.1% | 89137 | +2.8% | 21414 | +1.5% | 6286 | +1.5% |
| 0.90 | 478978 | −39.6% | 88406 | +2.0% | 21367 | +1.3% | 6268 | +1.2% |
| 0.95 | 487833 | −38.5% | 87689 | +1.2% | 21276 | +0.9% | 6245 | +0.9% |
| 1.00(only filtering) | 493023 | −37.8% | 87276 | +0.7% | 21239 | +0.7% | 6242 | +0.8% |
MS-Clustering Algorithm
Our MS-Clustering algorithm is similar in several aspects to the Pep-Miner algorithm [12] but has a number of optimization steps that enable analysis of over 10 million mass spectra (an order of magnitude increase in the maximum number of analyzed spectra compared to the results reported for Pep-Miner). The three major components of our approach are a spectral similarity measure, a method for the selection of a cluster’s representative spectrum, and a clustering algorithm itself.
Spectral Similarity
In order to cluster mass spectra we need to determine the similarity between them. We use the normalized dot-product, which has previously been found to work well by several groups that have approached similar problems [16, 32, 10, 12, 11, 14, 21, 20]. See supplementary material for a description of a fast implementation of spectral similarity and a peak intensity scaling approach that is geared towards clustering applications.
Cluster Representatives
Our algorithm generates a single spectrum representative for each cluster with more than one spectrum (singleton clusters use the spectrum itself as the cluster representative). Having a single representative is beneficial in two ways. First, it reduces the number of spectral similarity computations performed by the clustering algorithm (computing spectral similarity of a candidate spectrum to a cluster requires only a comparison with the cluster’s representative and not the individual cluster members). Second, a single cluster representative can be submitted for the analysis and the results can be assigned to all cluster members.
Since “all spectra are not created equal”, it helps to select representative spectra with the highest signal-to-noise ratio in the cluster or to come up with a virtual spectra with high signal-to-noise ratio. Such spectra can have a significantly higher signal-to-noise ratio than typical spectra in the clusters (see refs [12, 34] and analysis in supplemental material). We examined several methods for selecting a cluster’s representative and chose to use a consensus spectrum [11, 18, 21, 20] as the representative. The consensus spectrum is constructed by consolidating the peaks of all spectra in the cluster. Each consensus peak is assigned a mass that equals the weighted average of the joined peaks’ masses and an intensity that equals the sum of the peaks’ intensities. We discuss the details of our method for constructing a consensus spectrum in the supplemental material and compare the quality of the consensus spectrum with other methods for selecting a cluster representative.
Clustering Algorithm
Many popular clustering algorithms such as k–means [35, 36] require an advance knowledge of the number of clusters that are being sought. However, the nature of MS/MS datasets precludes the use of such algorithms since it is nearly impossible to “guess” the number of clusters. Furthermore, the sheer size of MS/MS datasets makes this approach very time-consuming. A better MS/MS clustering method is to use a “bottom-up” approach like incremental hierarchical clustering [35, 36], which would start with clusters containing single spectra and build the clusters up by merging clusters with similar spectra.
Figure 1 describes a simple hierarchical clustering algorithm. The algorithm starts with the list Clusters consisting of all elements as singletons. There are r rounds of clustering with a decreasing similarity threshold τ. In each round the algorithm tries to merge pairs of elements in Clusters with a similarity that exceeds the threshold τ. This is done by sequentially comparing each cluster c in Clusters with the clusters preceding it in the list. If there exists a cluster c′ that is similar to cluster c in Clusters (similarity exceeds the thresholdτ), the spectra in c are appended to spectra in c′ and c is removed from the list of clusters (Figure 2). After r rounds, the final set of clusters is returned by the algorithm. Applying the algorithm to clustering of mass spectra is straightforward. The elements being clustered are the spectra themselves, and the function used to determine cluster similarity is the spectral similarity which is applied to the clusters’ representative spectra (these consensus spectra are continuously updated as clusters are merged).
Figure 1.

A pseudocode description of the approximate hierarchical clustering algorithm used by MS-Clustering.
Figure 2.

Illustration of cluster appending. The set Clusters is a linked list where each element is a list of spectra. When the algorithm merges cluster c with a preceding cluster c′ it appends the list of spectra in cluster c to the list of spectra in cluster c′ and then removes the entry for c from the linked list of clusters.
Our algorithm does not necessarily join clusters with maximum similarity, rather it joins the first ones it encounters that have a similarity above the threshold τ. However, since the algorithm consists of several rounds with decreasing similarity thresholds, it approximates the hierarchical clustering’s gradual joining of clusters, in which the most similar clusters are merged first. By using this heuristic approach we are able to reduce the number of spectral similarity computations compared to traditional hierarchical clustering algorithms.
We employ additional heuristics that further reduce the number of similarity computations, and alleviate the computational cost associated with performing the clustering in several rounds. One heuristic we use is to restrict the similarity computations to pairs of spectra that have at least one peak in common amongst the sets of the five strongest peaks in each spectrum. Using this heuristic we can avoid 94.5% of the unnecessary similarity computations (i.e., computing the similarity between pairs of spectra from different peptides) while overlooking only 2% of the pairs of spectra from the same peptides. The reduction in running time required for similarity computations achieved with this heuristic is in par with the reductions reported for metric space indexing [14] or local sensitive hashing [15]. Additional analysis of the heuristics we use is given in the supplemental material.
Results
Clustering Performance
The performance of the clustering algorithm depends on the similarity threshold used to determine if two spectra should be joined. A low threshold leads to large heterogeneous clusters, while a higher threshold results into a larger number of smaller, but more homogenous clusters. Table 1 contains the results of experiments we ran to examine the tradeoffs of using different threshold values. A single run with 793000 spectra from the Human dataset was clustered using varying similarity values between 0.35 and 1 (with a similarity threshold of 1 no clustering is effiectively performed). Different thresholds should be chosen depending on the objective we wish to maximize. To maximize the number of spectra identified, we would prefer a low threshold of 0.35–0.4 which generates large, but possibly corrupt clusters. Using threshold 0.75 maximizes the number of peptides and proteins identified (though at the expense of generating a larger number of clusters). We found that the similarity threshold of 0.55 offers both an increase in the number of identifications compared to the search of the non-clustered data (14.8% more spectra, 0.2% more peptides and and 1.5% more proteins at the same 98% rate of true positive peptide identifications), and also relatively efficient clustering (a reduction of 57% to the number of spectra submitted to database search).
Table 2 breaks down the identifications of spectra, peptides and proteins made in the searches described in Table 1. When we examine the differences between the identifications made by searching the clustered and non-clustered data we find that even when high similarity thresholds are used, there are differences in the sets of identifications made by the two searches (though the majority of identifications are common to both). One reason why some spectra are identified only in the clustered search is that clustering greatly reduces the number of spurious hits made to the decoy database. Many weak spectra are removed from the MS/MS database search, since they cluster with stronger spectra. Consequently, this results in a smaller number of spectra that have spurious hits to the database, which leads to a lower F-score threshold for accepting identifications at a given true positive rate. For example, to maintain a 98% true positive peptide identification rate, spectra in the non-clustered data must have a minimal F-score of 3.34 to be accepted while spectra in the clustered dataset need only 3.21. There are a couple reasons why there are spectra that get identified only when searching the non-clustered dataset. First, some of the identifiable spectra are filtering out due to low quality. Second, in many cases, especially with large clusters, the consensus spectra can have a lower signal than the best spectrum in the cluster, which can lead to it being missed (due to its lower score), while some of the individual cluster members are good enough to be identified (see analysis in supplementary material). In any case, starting from a similarity threshold of 0.55, the total number of identifications (spectra, peptides, or proteins) made when searching a clustered dataset is higher than the number achieved without clustering.
Table 2.
Comparison of identifications in clustered and non-clustered datasets. The table contains a breakdown of the identifications of spectra, peptides and proteins as displayed in Table 1. For each similarity threshold the table shows how many identifications were common both when searching the clustered and non-clustered datasets, how many appeared only in the search of the non-clustered data, and how many identifications were unique to the clustered data.
| Similarity threshold | Spectra identifications
|
Peptide identifications
|
Protein identifications
|
||||||
|---|---|---|---|---|---|---|---|---|---|
| Botha | Non-C.b | Clust.c | Both | Non-C. | Clust. | Both | Non-C. | Clust. | |
| 0.30 | 64472 | 19194 | 49083 | 16957 | 4133 | 1395 | 5447 | 744 | 325 |
| 0.35 | 67464 | 16896 | 44410 | 18129 | 2961 | 1374 | 5672 | 519 | 319 |
| 0.40 | 70580 | 14420 | 39047 | 18854 | 2236 | 1288 | 5795 | 396 | 301 |
| 0.45 | 71294 | 14054 | 32355 | 19314 | 1776 | 1278 | 5867 | 324 | 311 |
| 0.50 | 73635 | 11956 | 28133 | 19733 | 1357 | 1245 | 5938 | 253 | 291 |
| 0.55 | 75582 | 10324 | 23130 | 19980 | 1110 | 1162 | 5987 | 204 | 295 |
| 0.60 | 76849 | 9190 | 18272 | 20186 | 904 | 977 | 6020 | 171 | 255 |
| 0.65 | 78642 | 7604 | 14433 | 20360 | 730 | 864 | 6047 | 144 | 219 |
| 0.70 | 80381 | 6030 | 12014 | 20522 | 568 | 827 | 6075 | 116 | 225 |
| 0.75 | 81721 | 4773 | 9360 | 20638 | 452 | 774 | 6102 | 89 | 208 |
| 0.80 | 82679 | 3845 | 7181 | 20698 | 392 | 688 | 6103 | 88 | 186 |
| 0.85 | 83584 | 3002 | 5457 | 20774 | 316 | 640 | 6118 | 73 | 168 |
| 0.90 | 84423 | 2203 | 3927 | 20799 | 291 | 568 | 6119 | 72 | 149 |
| 0.95 | 84887 | 1760 | 2767 | 20789 | 301 | 487 | 6118 | 73 | 127 |
| 1.00 | 85170 | 1505 | 2099 | 20787 | 303 | 452 | 6121 | 70 | 121 |
Identifications common to both searches;
Identifications unique to the non-clustered search;
Identifications unique to the clustered search.)
There are some cases where clustering improves the signal-to-noise ratio beyond the best individual members’ which leads to new identifications. Figure 3 gives an example of a cluster of three spectra of the peptide TGSVDIIVTDLPFGK along with the consensus spectrum created from them (TGSVDIIVTDLPFGK comes from a protein sequence for which six additional peptide hits were found). Because the consensus spectrum aggregates peaks from the different spectra, it was able to accumulate peaks for 14 b/y-ions while the other spectra have peaks for at most 13 b/y-ions. However, more important is the fact that the consensus spectrum has a significantly stronger signal, explaining 67% of the spectrum’s intensity, compared to between 49% (spectrum I) to 42% (spectrum III) explained intensity for the cluster members. These factors gave the consensus spectrum an InsPecT F-score of 5.9 which was suffcient to make a positive identification, while the other spectra fell short with scores between −0.3 and 3.0. When searched with Mascot [2], the three spectra had Mowse scores of 19 and below, while the consensus had a score of 31.
Figure 3.
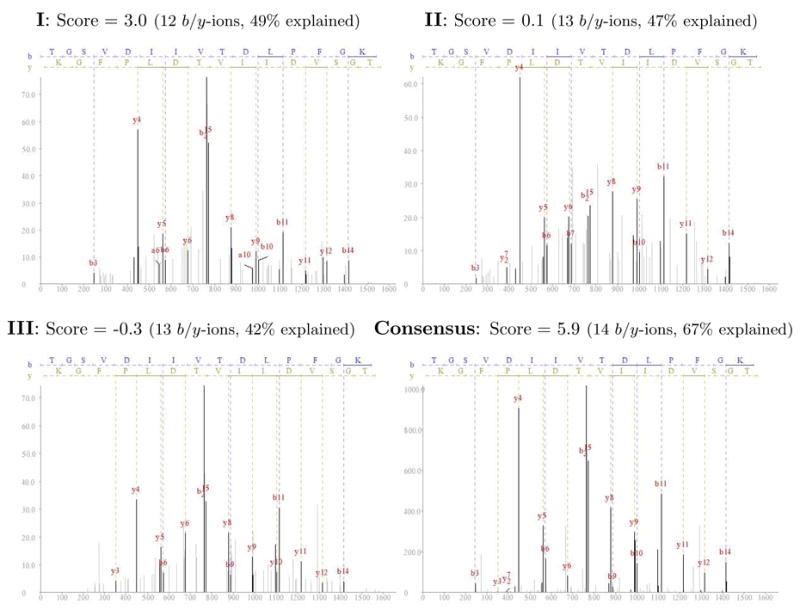
Example of cluster for the peptide TGSVDIIVTDLPFGK. A cluster of three spectra is shown along with the consensus spectrum that was created from them. For each spectrum the InsPecT score is shown, along with the number of identified b/y-ions and the percentage of the spectrum’s intensity that is explained by the peptide’s fragment ions. Only the consensus spectrum had a suffciently high score to be positively identified in the database search using InsPecT. All spectra have a precursor charge 2 with precursor m/z errors below 1 Da. The figures’ x-axes represents the fragments’ m/z values and the y-axes represents the intensities.
As the clustering similarity threshold increases, we witness a growing number of fragmented clusters i.e., several distinct clusters containing spectra of the same peptide. Though this might pose a slight increase in the computational cost since there are more spectra to analyze, cluster fragmentation is not really a problem when MS/MS data is concerned. In fact, in many cases attempting to create “optimal” clusters where all spectra of the same peptide fall into a single cluster can be counterproductive. Even with fragmented clusters, clustering still offers a significant reduction in the search time, so creating even larger clusters will only offer a modest improvement from that respect. However, an attempt to group all spectra from the same peptide into a single cluster may backfire since it may bring some noisy and unrelated spectra into the cluster yielding a noisier consensus spectrum. This can lower the number of peptides that ultimately get identified. In our experiments, a larger number of peptides and proteins were identified when we use a larger number of tighter clusters (data not shown)
In many cases fragmented clusters stem naturally from the variation observed between different experimental spectra of the same peptide [37]. Figure 4 shows two clusters of spectra of the same peptide VDDPNAEDKR that were not grouped together into a single cluster (three spectra are shown from each cluster). All spectra were identified confidently both by InsPecT (average InsPecT F-scores for the spectra in cluster I was 8.1 and 4.2 for the spectra in cluster II), and Mascot (average Mascot Mowse score of 74 for the spectra in cluster I and 52 for cluster II). There are several differences in the fragmentation patterns between the spectra of the two clusters, the most notable difference being that in cluster I the strongest peak is the doubly charged y8 and the b5 is very weak, while in cluster II b5 is the strongest peak in all three spectra. The spectra in cluster II also contain some additional noise peaks not present in cluster I. These differences were suffcient to cause MS-clustering not to join these two clusters. This example exposes a possible vulnerability of spectral libraries that use a single consensus spectrum for each peptide. If the consensus spectrum is created using examples of only one of the variants (e.g., cluster I), it is likely that spectra from the other variant (cluster II) will not be similar enough to the consensus spectrum to be identified when they are searched against the library.
Figure 4.
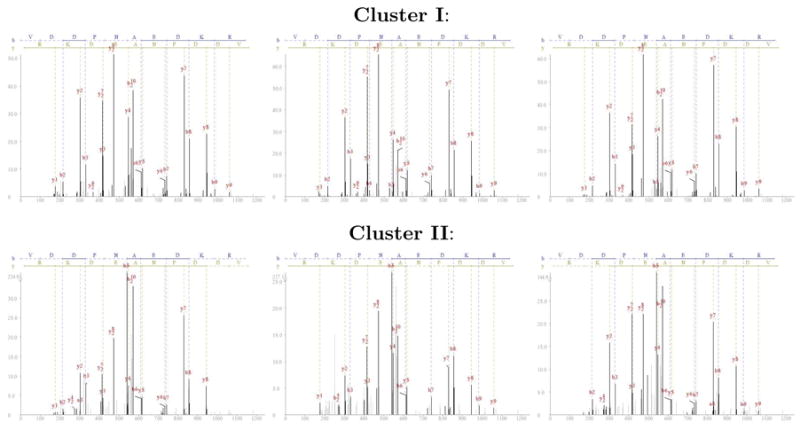
Fragmented clusters. Spectra of the peptide VDDPNAEDKR from two clusters that were not joined are shown (the figure contains 3 spectra from each cluster, originally cluster I contained 6 spectra and cluster II contained 4 spectra). The figures’ x-axes represents the fragments’ m/z values and the y-axes represents the intensities.
Database Searches With Clustered MS/MS Datasets
We tested our clustering algorithm with samples of varying sizes from four different organisms. Each dataset was searched in two methods:
Non-clustered - regular search of complete MS/MS dataset.
Clustered - a search of the consensus spectra generated by MS-Clustering using the default settings (r = 3 rounds, a similarity threshold of τmin = 0:55).
Table 3 holds statistics on the sizes of the MS/MS datasets and the sequence databases, along with the running time required for the clustering and database searches and the total speed-up achieved by clustering. Table 4 holds statistics on the spectra, peptides and proteins that were identified in the experiment.
Table 3.
Running time statistics. MS/MS samples were selected from Human, Shewanella, Dictyostelium and Yeast datasets. The results are shown in two modes: without clustering, and clustering using default values. The table holds the sizes of the original MS/MS datasets and the sequence databases used for identifications. For each experiment the table also holds the run-time (in cpu hours), and the relative speed-up factor achieved by clustering vs. the non-clustered search. The runtime was measured on a 3.0GHz desktop PC with 2GB of RAM.
| Dataset | Database size (amino acids) | Dataset size (# spectra) | Experiment type | Run Time (cpu hours)
|
Speed-up | ||
|---|---|---|---|---|---|---|---|
| clustering | search | total | |||||
| Human (1 run) | 26.7 M | 0.793 M | Non-clustered | - | 132.2 | 132.2 | |
| Clustered | 0.77 | 56.6 | 57.4 | 2.3 | |||
| Human (5 runs) | 26.7 M | 4.0 M | Non-clustered | - | 664.3 | 664.3 | |
| Clustered | 6.4 | 107.4 | 113.8 | 5.8 | |||
| Human (14 runs) | 26.7 M | 11.4 M | Non-clustered | - | 1812.7 | 1812.7 | |
| Clustered | 24.3 | 308.2 | 332.5 | 5.5 | |||
| Shewanella | 1.45 M | 14.5 M | Non-clustered | - | 286.3 | 286.3 | |
| Clustered | 26.8 | 28.5 | 55.3 | 5.2 | |||
| Dictyostelium | 7.36 M | 1.4 M | Non-clustered | - | 78.6 | 78.6 | |
| Clustered | 2.3 | 39.3 | 41.6 | 1.9 | |||
| Yeast | 4.9 M | 0.179 M | Non-Clustered | - | 7.5 | 7.5 | |
| Clustered | 0.1 | 3.5 | 3.6 | 2.1 | |||
Table 4.
Summary of database search results. MS/MS samples were selected from Human, She-wanella, Dictyostelium and Yeast datasets. The results are shown in two modes: without clustering, and clustering using default values. The table holds for each experiment the number of spectra (or clusters) submitted to search, the number of spectra/peptides/proteins that were identified (using score thresholds set to maintain a 98% true positive peptide identification rate. The table also notes the difference (as percentages) between the figures obtained for the non-clustered search and the clustered searches of each dataset.
| Dataset | Search type | #Spectra searched | # Spectra identified | Peptides identified | Proteins identified | ||||
|---|---|---|---|---|---|---|---|---|---|
| Human (1 run) | Non-clustered | 0.793 M | 86682 | 21090 | 6191 | ||||
| Clustered | 0.341 M | −57.0% | 99488 | +14.8% | 21142 | +0.2% | 6281 | +1.5% | |
| Human (5 runs) | Non-clustered | 4.0 M | 369431 | 33975 | 7142 | ||||
| Clustered | 0.65 M | −83.8% | 484913 | +31.3% | 33175 | −2.4% | 7143 | +0.0% | |
| Human (14 runs) | Non-clustered | 11.4 M | 815764 | 59062 | 8562 | ||||
| Clustered | 1.85 M | −83.8% | 1610667 | +97.4% | 64512 | +9.2% | 9104 | +6.3% | |
| Shewanella | Non-clustered | 14.5 M | 1628796 | 39411 | 2797 | ||||
| Clustered | 1.29 M | −91.1% | 2889426 | +77.4% | 43262 | +9.8% | 2895 | +3.5% | |
| Dictyostelium | Non-clustered | 1.41 M | 272900 | 40578 | 6076 | ||||
| Clustered | 0.71 M | −49.6% | 319735 | +17.2% | 39759 | −2.0% | 6077 | +0.0% | |
| Yeast | Non-clustered | 179377 | 21597 | 2555 | 658 | ||||
| Clustered | 116227 | −35.2% | 23666 | +9.6% | 2482 | −2.9% | 653 | −0.8% | |
Searching a clustered dataset typically resulted in a 2×–6× speed-up in running time. Note that the database search we performed was a basic search that did not consider PTMs. With more complex searches, the speed-up achieved with clustering would be closer to the ratio in which clustering reduced the number of spectra submitted to analysis (10× in the case of the Shewanella dataset, see Table 4). In all cases, searching clustered datasets yielded a larger number of spectrum identifications than the non-clustered data. It ranged between a modest 9.6% gain (with the yeast samples) to almost 100% gain with the 14 runs from the human sample. This increase was achieved despite the fact that the number of cluster consensus spectra that were submitted for analysis was six times smaller than the original dataset size. Searching clustered datasets generally increased the number of peptide and protein identifications, especially with the larger datasets, while the smaller datasets tended to display slight loss in the number of identifications.
The results in Table 4 illustrate an important and often neglected point that needs to be addressed when analyzing large MS/MS datasets using a decoy database. The score thresholds for spectra must be computed using the entire set of search results. Though it might be tempting, especially from a computational standpoint, to determine p-values or F-scores independently for portions of the dataset (e.g., analyzing each run independently when the data is collected from the instrument), this will inadvertently lead to more false positives than expected. The main culprit is that repeated runs of the same sample are highly dependent, with many of the peptide identifications appearing in multiple runs. This leads to a log-like discovery curve of new peptides (searching 14 runs instead of single run only tripled the number of peptide identifications obtained with the Human data). However, the false identifications are more diverse between runs (since they are spurious database hits generally occurring with lower quality spectra). Thus the growth rate of false identifications accumulated when results of multiple runs are combined is greater than the growth rate of correct peptides. This observation is illustrated well in the results for the human samples in Table 4. When searching a single run from the human sample, the F-score threshold needed for 98% true positive peptide identifications was 3.34. With this threshold 86682 of the 793000 spectra (10.9%) were identified in the non-clustered search. When the results of the 14 runs from the human sample were pooled together, in order to achieve a similar rate of 98% the F-score threshold had to be raised to 3.74. With this higher threshold only 815764 of the 11.4 million spectra were identified (7.2%). Had we used the score threshold of 3.34 with the 14 runs, we would have identified 1.32 million spectra, however the peptide accuracy rate would have been only 95.9%.
Our clustering experiments support the common view that the existing peptide identification approaches do not identify many spectra in MS/MS datasets. Of the 11.4 million spectra from the human dataset submitted for clustering, 5.6 million passed the spectral quality filtering and ended up being grouped into 1.85 million clusters (see Table 5). Only 267492 of these clusters, containing 1.6 million spectra from the original non-clustered dataset were identified in the database search. Thus the majority of the clusters (86.5%) and the majority of the spectra (71.4%) remain unidentified after the database search. Table 5 also shows that there is a significant difference between the distribution of cluster sizes in the entire dataset and the distribution of sizes of the identified clusters, with the identified spectra on average belonging to larger clusters. As we mentioned above, our algorithm is not aimed at producing the optimal clustering (i.e., minimal number of clusters). On average, each of the 64318 identified peptides has 4.16 clusters associated with it. It is interesting to note the large range of spectral counts observed for the identified peptides. While most of the peptides have low spectral counts (56.5% of the peptides have 1–5 spectra assigned to them), most of the identified spectra belong to peptides with high redundancy (62.1% of the identified spectra belonged to 2223 peptides, each with at least 100 spectra assigned to it).
Table 5.
Distributions of cluster sizes. Results of clustering 11.4 million spectra from 14 runs of the Human dataset. The left side holds the cluster size distribution for 5.6 million spectra that passed spectral quality filtration and were grouped into 1.85 million clusters. The middle holds the distribution for the subset of clusters that were identified in the database search. The right hand side holds the distribution of “perfect” clustering, in which all the spectra belonging to a single peptide are grouped into a single cluster.
| Clust. size | All Clusters | Identified Clusters | “Perfect” Clusters | |||||||||
|---|---|---|---|---|---|---|---|---|---|---|---|---|
| #Clust. | (%) | #Spec. | (%) | #Clust. | (%) | #Spec. | (%) | #Clust. | (%) | #Spec. | (%) | |
| 1 | 1275893 | 68.9% | 1275893 | 22.7% | 143487 | 53.6% | 143487 | 8.9% | 15830 | 24.6% | 15830 | 1.0% |
| 2 | 235387 | 12.7% | 470774 | 8.4% | 30993 | 11.6% | 61986 | 3.8% | 8027 | 12.5% | 16054 | 1.0% |
| 3–5 | 156917 | 8.5% | 558491 | 10.0% | 31008 | 11.6% | 113935 | 7.1% | 12474 | 19.4% | 47641 | 3.0% |
| 6–10 | 58085 | 3.1% | 447501 | 8.0% | 17902 | 6.7% | 138702 | 8.6% | 9447 | 14.7% | 72646 | 4.5% |
| 11–15 | 38758 | 2.1% | 506373 | 9.0% | 12484 | 4.7% | 163030 | 10.1% | 4905 | 7.6% | 62629 | 3.9% |
| 16–25 | 75335 | 4.1% | 1290671 | 23.0% | 26742 | 10.0% | 461884 | 28.7% | 5169 | 8.0% | 101827 | 6.4% |
| 26–50 | 6065 | 0.32% | 210775 | 3.8% | 2636 | 1.0% | 91294 | 5.7% | 4169 | 6.5% | 146599 | 9.2% |
| 51–100 | 2590 | 0.14% | 179410 | 3.2% | 1203 | 0.4% | 82743 | 5.1% | 2074 | 3.2% | 143300 | 9.0% |
| 101–500 | 1689 | 0.09% | 332853 | 5.9% | 832 | 0.3% | 166587 | 10.3% | 1820 | 2.8% | 375502 | 23.5% |
| 500+ | 373 | 0.02% | 335727 | 6.0% | 205 | 0.1% | 187019 | 11.6% | 403 | 0.6% | 617369 | 38.6% |
| Total | 1851092 | 5608468 | 267492 | 1610667 | 64318 | 1599397 | ||||||
Discussion
We presented a practical MS-Clustering algorithm capable of handling large datasets (over ten million spectra) using a single desktop PC. MS-Clustering can lead to a tenfold reduction in the number of spectra submitted to further analysis. With large datasets, searching clusters often yields more peptide and protein identifications than a regular search without clustering (see Table 4). These additional identifications can mostly be attributed to the fact that clustering greatly reduces the number of low quality spectra that are submitted to analysis, which in turn reduces the number of spurious database hits to the decoy database. When smaller datasets are clustered (1 million spectra), clustering still gives 2–4 folds reduction in the number of spectra that need to be analyzed, possibly with a small reduction in the number of peptides and proteins identified (typically around 2%), it is not as useful for smaller datasets (below 0.5 million), since this usually leads to some loss of peptide identifications.
Since clustering is usually much faster than a database search, reducing the number of spectra that need to be submitted for analysis leads to a significant reduction in the running time (see Table 3). Another benefit of clustering is its ability to single out interesting cases of unidentified spectra that are worthy of further examination. For instance, spectra of peptides with mutations and unexpected PTMs require time-consuming advanced search techniques. Instead of scattering the resources on examination of all unidentified spectra in the dataset (which typically involves the majority of the spectra), we can focus the efforts on the large unidentified clusters which represent the most likely candidates for these interesting peptides. This way we can afford to apply more time-consuming searches to a smaller set of high quality candidates (consensus spectra of large clusters have a high signal-to-noise ratio). In an essence, if searching for these atypical peptides is analogous to searching for a needle in a haystack, clustering can be used to reduce the haystack to an amenable size. Such a reduction can make the application of time-consuming analysis methods such as “blind” PTM searches computationally feasible even for large scale projects with tens of millions of spectra. When we applied clustering to a large 14.5 million spectra dataset, we were able to reduce the number of unexplained spectra left for further examination by over 10-folds (see supplemental material for more details).
With the increasing amount of experimental data being collected and validated, spectrum libraries of identified mass spectra are emerging as a viable method for peptide identification [16, 17, 18, 19, 21, 20]. Spectral libraries contain spectra derived from clusters of spectra from previously identified peptides that are compared with the query spectrum to determine a match. The main drawback of spectrum libraries is that they are not applicable to spectra of previously unidentified peptides. We propose to extend the notion of spectral libraries by introducing spectral archives 1 that contain clusters of unidentified spectra as well. Recently proposed spectral network approach allows one to identify uninterpreted spectra using other uninterpreted spectra (as opposed to using a database) thus opening a possibility to use spectral archives for peptide identifications. Clustering can be viewed as an instrument for constructing spectral archives that can be further interpreted via spectral networks and shotgun protein sequencing [34, 33].
When examining the details of our clustering algorithm we note that it takes a heuristic approach, and thus might not deliver optimal” clustering. However, in the mass spectra domain, the payoff for having optimal clustering (as compared to suboptimal) is not high. Often times, clusters get split due to natural variation observed in different instances of spectra of the same peptide. There is no significant advantage to minimizing cluster fragmentation. Whether we have a minimal number of clusters or a slightly larger number, it still represents large savings in time compared to the case when no clustering is performed at all (see Table 4). Furthermore, there can be advantages to having several small but more homogenous clusters instead of one larger and more diverse cluster. It is more likely that the peptide in question will get identified at least once when searching several consensus spectra of tighter homogeneous clusters, compared to the case where we have only a single consensus spectrum from a large and noisier cluster.
Supplementary Material
Acknowledgments
AF was supported by the La Jolla Interfaces in Science (LJIS) interdisciplinary fellowship which is sponsored by the Burroughs Wellcome Fund. This project was supported by NIH grant NIGMS 1-R01-RR16522. The authors would like to acknowledge the UCSD FWGrid Project for the availability of their computational infrastructure. The UCSD FWGrid Project is funded in part by NSF Research Infrastructure Grant number NSF EIA-0303622. The authors would like to thank Debo Dutta, Tim Chen, Vineet Bafna, Nitin Gupta and Samuel Payne for many useful discussions on spectral clustering.
Abbreviations
- PTM
post-translational modification
Footnotes
We use the term “archives”, since as opposed to libraries that are typically well-annotated collections of books, archives often have many documents that were never looked at, studied, or annotated.
References
- 1.Eng JK, McCormack AL, Yates JR., III An Approach to Correlate Tandem Mass-Spectral Data of Peptides with Amino Acid Sequences in a Protein Database. J Am Soc Mass Spectrom. 1994;5:976–989. doi: 10.1016/1044-0305(94)80016-2. [DOI] [PubMed] [Google Scholar]
- 2.Perkins DN, Pappin DJ, Creasy DM, Cottrell JS. Probability-based protein identification by searching sequence databases using mass spectrometry data. Electrophoresis. 1999;20:3551–3567. doi: 10.1002/(SICI)1522-2683(19991201)20:18<3551::AID-ELPS3551>3.0.CO;2-2. [DOI] [PubMed] [Google Scholar]
- 3.Craig R, Beavis RC. TANDEM: matching proteins with tandem mass spectra. Bioinformatics. 2004;20:1466–1467. doi: 10.1093/bioinformatics/bth092. [DOI] [PubMed] [Google Scholar]
- 4.Geer LY, Markey SP, Kowalak JA, Wagner L, Xu M, Maynard DM, Yang X, Shi W, Bryant SH. Open mass spectrometry search algorithm. J Proteome Res. 2004;3:958–964. doi: 10.1021/pr0499491. [DOI] [PubMed] [Google Scholar]
- 5.Tanner S, Shu H, Frank A, Mumby M, Pevzner P, Bafna V. Inspect: Fast and accurate identification of post-translationally modified peptides from tandem mass spectra. Anal Chem. 2005;77:4626–4639. doi: 10.1021/ac050102d. [DOI] [PubMed] [Google Scholar]
- 6.Shilov IV, Seymour SL, Alpesh AP, Loboda A, Tang WH, Keating SP, Hunter CL, Nuwaysir LM, Schaeffer DA. The Paragon Algorithm, a Next Generation Search Engine That Uses Sequence Temperature Values and Feature Probabilities to Identify Peptides from Tandem Mass Spectra. Mol Cell Proteomics. 2007;6:1638–1655. doi: 10.1074/mcp.T600050-MCP200. [DOI] [PubMed] [Google Scholar]
- 7.Mann M, Wilm M. Error-tolerant identification of peptides in sequence databases by peptide sequence tags. Anal Chem. 1994;66:4390–4399. doi: 10.1021/ac00096a002. [DOI] [PubMed] [Google Scholar]
- 8.Mørtz E, O’Connor PB, Roepstorff P, Kelleher NL, Wood TD, McLafferty FW, Mann M. Sequence tag identification of intact proteins by matching tandem mass spectral data against sequence data bases. PNAS. 1996;93:8264–8267. doi: 10.1073/pnas.93.16.8264. [DOI] [PMC free article] [PubMed] [Google Scholar]
- 9.Frank A, Tanner SW, Bafna V, Pevzner PA. Peptide sequence tags for fast database search in mass-spectrometry. J of Proteome Research. 2005;4:1287–95. doi: 10.1021/pr050011x. [DOI] [PubMed] [Google Scholar]
- 10.Tabb DL, MacCoss MJ, Wu CC, Anderson SD, Yates JR., III Similarity among tandem mass spectra from proteomic experiments: detection, significance, and utility. Anal Chem. 2003;75:2470–2477. doi: 10.1021/ac026424o. [DOI] [PubMed] [Google Scholar]
- 11.Tabb DL, Thompson MR, Khalsa-Moyers G, VerBerkmoes NC, McDonald WH. MS2Grouper: Group assessment and synthetic replacement of duplicate proteomic tandem mass spectra. J Am Soc Mass Spec. 2005;16:1250–1261. doi: 10.1016/j.jasms.2005.04.010. [DOI] [PubMed] [Google Scholar]
- 12.Beer I, Barnea E, Ziv T, Admon A. Improving large-scale proteomics by clustering of mass spectrometry data. Proteomics. 2004;4:950–960. doi: 10.1002/pmic.200300652. [DOI] [PubMed] [Google Scholar]
- 13.Romine MF, Elias DA, Monroe ME, Auberry K, Fang R, Fredrickson JK, Anderson GA, Smith RD, Lipton MS. Validation of Shewanella oneidensis MR-1 small proteins by AMT tag-based proteome analysis. OMICS. 2004;8:239–254. doi: 10.1089/omi.2004.8.239. [DOI] [PubMed] [Google Scholar]
- 14.Ramakrishnan SR, Mao R, Nakorchevskiy AA, Prince JT, Willard WS, Xu W, Marcotte EM, Miranker DP. A fast coarse filtering method for peptide identification by mass spectrometry. Bioinformatics. 2006;22:1524–1531. doi: 10.1093/bioinformatics/btl118. [DOI] [PubMed] [Google Scholar]
- 15.Dutta D, Chen T. Speeding up tandem mass spectrometry database search: Metric embeddings and fast near neighbor search. Bioinformatics. 2007;23:612–618. doi: 10.1093/bioinformatics/btl645. [DOI] [PubMed] [Google Scholar]
- 16.Stein SE, Scott DR. Optimization and testing of mass spectral library search algorithms for compound identification. J Am Soc Mass Spectrom. 1994;5:859–866. doi: 10.1016/1044-0305(94)87009-8. [DOI] [PubMed] [Google Scholar]
- 17.Yates JR, III, Morgan SF, Gatlin CL, Griffin PR, Eng JK. Method to compare collision-induced dissociation spectra of peptides: Potential for library searching and subtractive analysis. Anal Chem. 1998;70:3557–3565. doi: 10.1021/ac980122y. [DOI] [PubMed] [Google Scholar]
- 18.Craig R, Cortens JC, Fenyo D, Beavis RC. Using annotated peptide mass spectrum libraries for protein identification. J of Proteome Research. 2006;5:1843–1849. doi: 10.1021/pr0602085. [DOI] [PubMed] [Google Scholar]
- 19.Frewen FB, Merrihew GE, Wu CC, Stanford Noble W, MacCoss MJ. Analysis of peptide ms/ms spectra from large-scale proteomics experiments using spectrum libraries. Anal Chem. 2006;78:5678–5684. doi: 10.1021/ac060279n. [DOI] [PubMed] [Google Scholar]
- 20.Lam H, Deutsch EW, Eddes JS, Eng JK, King SE, Stein N, Aebersold R. Development and validation of a spectral library searching method for peptide identification from ms/ms. Proteomics. 2007;7:655–667. doi: 10.1002/pmic.200600625. [DOI] [PubMed] [Google Scholar]
- 21.Liu J, Bell AW, Bergeron JJ, Yanofsky CM, Carrillo B, Beaudrie CE, Kearney RE. Methods for peptide identification by spectral comparison. Proteome Sci. 2007;5:3. doi: 10.1186/1477-5956-5-3. [DOI] [PMC free article] [PubMed] [Google Scholar]
- 22.Tsur D, Tanner S, Zandi E, Bafna V, Pevzner PA. Identification of post-translational modifications via blind search of mass-spectra. Nature Biotechnology. 2005;23:1562–1567. doi: 10.1038/nbt1168. [DOI] [PubMed] [Google Scholar]
- 23.Gupta N, Tanner S, Jaitly N, Adkins J, Lipton M, Edwards R, Romine M, Oster-man A, Bafna V, Smith RD, Pevzner P. Whole proteome analysis of post-translational modifications: applications of mass-spectrometry for proteogenomic annotation. Genome Res. 2007;17:1362–1377. doi: 10.1101/gr.6427907. [DOI] [PMC free article] [PubMed] [Google Scholar]
- 24.Tanner S, Shen Z, Ng J, Florea L, Guig R, Briggs SP, Bafna V. Improving gene annotation using peptide mass spectrometry. Genome Res. 2007;17:231–239. doi: 10.1101/gr.5646507. [DOI] [PMC free article] [PubMed] [Google Scholar]
- 25.Masselon C, Pasa-Tolic L, Tolic N, Anderson GA, Bogdanov B, Vilkov AN, Shen Y, Zhao R, Qian WJ, Lipton MS, Camp DG, Smith RD. Targeted comparative proteomics by liquid chromatography-tandem fourier ion cyclotron resonance mass spectrometry. Anal Chem. 2005;77:400–406. doi: 10.1021/ac049043e. [DOI] [PMC free article] [PubMed] [Google Scholar]
- 26.Tanner S, Payne HS, Dasari S, Shen Z, Wilmarth P, David L, Loomis WF, Briggs SP, Bafna V. Accurate Annotation of Peptide Modifications through Unrestrictive Database Search. 2007 doi: 10.1021/pr070444v. submitted. [DOI] [PubMed] [Google Scholar]
- 27.Breci L, Hattrup E, Keeler M, Letarte J, Johnson R, Haynes PA. Comprehensive proteomics in yeast using chromatographic fractionation, gas phase fractionation, protein gel electrophoresis, and isoelectric focusing. Proteomics. 2005;5:2018–2028. doi: 10.1002/pmic.200401103. [DOI] [PubMed] [Google Scholar]
- 28.Bern M, Goldberg D, McDonald WH, Yates JR., III Automatic quality assessment of peptide tandem mass spectra. Bioinformatics. 2004;20:i49–i54. doi: 10.1093/bioinformatics/bth947. [DOI] [PubMed] [Google Scholar]
- 29.Nesvizhskii AI, Roos FF, Grossmann J, Vogelzang M, Eddes JS, Gruissem W, Baginsky S, Aebersold R. Dynamic spectrum quality assessment and iterative computational analysis of shotgun proteomic data: toward more efficient identification of post-translational modifications, sequence polymorphisms, and novel peptides. Mol Cell Proteomics. 2006;5:652–670. doi: 10.1074/mcp.M500319-MCP200. [DOI] [PubMed] [Google Scholar]
- 30.Purvine S, Kolker N, Kolker E. Spectral quality assessment for high-throughput tandem mass spectrometry proteomics. OMICS. 2004;8:255–265. doi: 10.1089/omi.2004.8.255. [DOI] [PubMed] [Google Scholar]
- 31.Flikka K, Martens L, Vandekerckhove J, Gevaert I, Eidhammer K. Improving the reliability and throughput of mass spectrometry-based proteomics by spectrum quality filtering. Proteomics. 2006;6:2086–2094. doi: 10.1002/pmic.200500309. [DOI] [PubMed] [Google Scholar]
- 32.Wan XK, Vidavsky I, Gross ML. Comparing similar spectra: from similarity index to spectral contrast angle. J Am Soc Mass Spectrom. 2002;13:85–88. doi: 10.1016/S1044-0305(01)00327-0. [DOI] [PubMed] [Google Scholar]
- 33.Bandeira N, Clauser K, Pevzner P. Shotgun protein sequencing: Assembly of ms/ms spectra from mixtures of modified proteins. Mol Cell Proteom. 2007;6:1123–1134. doi: 10.1074/mcp.M700001-MCP200. [DOI] [PubMed] [Google Scholar]
- 34.Bandeira N, Tsur D, Frank A, Pevzner PA. Protein identification by spectral networks analysis. PNAS. 2007;104:6140–6145. doi: 10.1073/pnas.0701130104. [DOI] [PMC free article] [PubMed] [Google Scholar]
- 35.Jain AK, Murty MN, Flynn PJ. Data clustering: a review. ACM Computing Surveys. 1999;31:264–323. [Google Scholar]
- 36.Everitt SB, Landau S, Leese M. Arnold. 4. 2001. Cluster Analysis. [Google Scholar]
- 37.Venable JD, Yates JR., III Impact of ion trap tandem mass spectra variability on the identification of peptides. Anal Chem. 2004;76:2928–2937. doi: 10.1021/ac0348219. [DOI] [PubMed] [Google Scholar]
Associated Data
This section collects any data citations, data availability statements, or supplementary materials included in this article.