

Abstract
The crude extract of an Alaskan ethnobotanical plant, Oplopanax horridus, was subjected to counter-current chromatography (CCC), and the selected active regions were evaluated for their synergistic effects with an in vitro model of anti-tubercular efficacy. CCC as a support-free high-resolution separation method was employed to preclude potential irreversible absorption to a solid stationary phase. The microplate Alamar blue assay and the isobole method were used to measure the biological activity and eliminate dose-response dependent errors, respectively. Using the combination of CCC, bioassay and isobole method, significant synergistic effects were observed. Among the entire polarity range, fractions with distribution constant between 0.44 and 0.81 showed the most synergistic enhancement with an increase in potency by 108% for the recombined fractions.
Keywords: Devil’s Club, Oplopanax horridus, synergy, CCC, isobole method
1. Introduction
It has been a common practice in numerous traditional medicines, such as traditional Chinese medicine and Ayurveda, to mix multiple agents for treatments. In ethnopharmacology, and when compared to single ingredient therapy, there are potentially three main advantages associated with the mixing of agents:(1) enhancement of efficacy; (2) reduction of unwanted side effects; and (3) increase of the stability and/or bioavailability of the drugs and/or selected components. Accordingly, when evaluating the biological activity of botanical and ethnobotanical preparations, the possibility of multiple plant secondary metabolites working together has to be taken into account when trying to rationalize an observed activity. This provides a reasonable working hypothesis for the evaluation of herbal remedies, especially when considering that plants have highly complex metabolic pathways and produce thousands of compounds [1,2]. Hence it is vital to understand the complexity and interactions among constituents in order to fully assess the efficacy of ethnobotanicals.
Considering that synergy is a widely acknowledged phenomenon in medicine, there are few reports in the literature that deal with the evaluation of synergy of natural products [3–7]. At the same time, to the authors best knowledge, there is no report investigating synergy in plants with scope to determine the best degree of purity for the highest activity. The paucity of research on this topic may result from the following complications that, at least in part, make synergy research of natural products challenging. (1) The pharmacological mechanism of action is often unknown. (2) It is hard to predict the effect of combined. (3) In order to explain the commonly observed loss of bioactivity during bioassay-guided fractionation, two principle lines of reasoning can be established: loss of active components and synergy. However, because irreversible absorption to a solid stationary phase is an inescapable problem of adsorption chromatography, any experimental implementation that employs column chromatography or HPLC ultimately is inherently incapable of addressing this question. In order to address these issues, we employed microplate Alamar blue assay (MABA), isobole method, and counter-current chromatography (CCC):
(1) MABA is a cell-based assay using virulent Mycobacterium tuberculosis, hence it is non-discriminatory of the mechanism of action. (2) The isobole method is independent from dose-response curves of agents. (3) CCC has an advantage to avoid irreversible absorption to the stationary phase because of its liquid-liquid partitioning mode of separation, hence it theoretically achieves 100 % sample recovery. It is also advantageous not to have a solid stationary phase since it reduces the risk of sample decomposition during the separation.
An Alaskan ethnobotanical, Oplopanax horridus Michix (Araliaceae), commonly known as Devil’s Club, was employed as the study organism. O. horridus is a tall deciduous shrub which has been traditionally used in regions along Pacific coast in North America. Its traditional uses include treatments for tuberculosis (TB), rheumatism, gastro-intestinal ailments, and wounds, as well as for spiritual purposes [8,9]. O. horridus has been used for TB treatment in at least seven different ethnic groups [10].
The crude extract of O. horridus was subjected to CCC separation. All analytically distinct fractions were tested for their anti-TB activity, and the fractions with potent activity within the active region of the CCC chromatogram were re-combined by themselves as well as with inactive fractions in the same region. All re-combined cocktails were re-tested to assess the synergistic effect.
2. Experimental
2.1. Plant collection and extraction
Inner stem bark of Oplopanax horridus (Araliaceae) was harvested from wild cultures in Anchorage, Alaska by David C. Smith, Alaska Green Gold, Anchorage, in 2002. Voucher specimens are deposited in the Chicago Field Museum’s herbarium. In order to obtain the full range of soluble compounds as part of the extract, 157 g of powdered inner stem bark of O. horridus was exhaustively extracted with an Ultra Turrax (IKA Works, Wilmington, NC, USA) homogenizer, using three solvents of increasing polarity (dichloromethane, methanol, and 50% methanol in water) to yield 47 g of total extract.
2.2. High-speed counter-current chromatography fractionation
Fractionation was conducted on a CCC-1000 J-type three-coiled planetary motion HSCCC (Pharma-Tech Research, Baltimore, MD, USA), which has a rotation radius (R) of 7.5 cm, uses 3 × 283 ml PTFE coils (I.D. 2.6 mm, O.D. 4.1 mm), and has beta values from 0.47 to 0.73. The HSCCC system was equipped with a Lab-Alliance Series III digital single-piston solvent pump, a Shimadzu SPD-10A VP UV-Vis detector with preparative flow cell, a Cole-Parmer modular paperless recorder model 80807-00, and a Pharmacia Biotech RediFrac 95-tube fraction collector.
The quaternary system of hexane:EtOAc:MeOH:H2O (7:3:6:4, HEMwat-4) was chosen as 2-phase solvent system. The decision was based on preliminary research in which the solvent system was optimized for falcarindiol, one of known active constituents in O. horridus, and two parallel runs with the same experimental condition, which suggested the presence of synergy, were conducted with one run having finer fractionation than the other.[11] All organic solvents were HPLC grade from Fisher Scientific (Pittsburgh, PA, USA). Water was deionized to 18.2 MΩ cm at 25° through the MilliQ Synthetic A10, Millipore Water (Bedford, MA, USA) system using a Quantum Ultrapure Cartridge and fed through a double cartridge ion exchange system (Culligan, Northbrook, IL, USA). A 1.2 g aliquot of the O. horridus extract was dissolved in 10 ml of a 1:1 mixture of upper and lower phase. The HSCCC instrument with the 3 × 283 ml coil set was equilibrated with upper phase as the mobile phase (normal phase, tail in head out) and achieved a SF of 0.71 at a flow rate of 3 ml/min and a rotation speed of 1000 rpm. The eluent was collected at 3 min intervals until distribution constant (KD) reached 3.2 (12 hours after injection).
All HSCCC fractions were analyzed by thin-layer chromatography (TLC) using Alugram Silica G/UV254 10 × 20 cm plates with a thickness of 0.20 mm (Macherey-Nagel, Düren, Germany), on which the fractions were horizontally spotted. While all samples were detected with a nonspecific p-anisaldehyde dipping reagent (96% glacial acetic acid, 2% H2SO4, 2% p-anisaldehyde), the solvent system used for the development of the TLC plates was hexane:EtOAc (8:2 and 7:3 v/v). Based on the TLC monitoring, HSCCC fractions were combined into 64 analytically distinct fractions.
2.3. Anti-TB bioassay
The anti-TB bioassay utilized was MABA employing virulent Erdman strain of Mycobacterium tuberculosis(ATCC 35801). This assay was chosen based on the advantages of versatility for all anti-TB mechanism of actions, small sample requirements, low cost, and high throughput capabilities, and has been validated against the clinical standard in susceptibility testing (BACTEC system) [12,13]. Due to the relatively large number of fractions to be tested, and taking into account the minimum inhibitory concentrations (MICs) of crude fractions (15–21 µg/ml in active regions), activities were initially determined as percent inhibition (PI) at various concentrations . Rifampin was used as a positive control, the solvent dimethyl sulfoxide (DMSO) as negative control.
2.4. Isobole method
The “expected effects” of the recombined fractions were calculated by utilizing Isobole method and the hypothesis described in the next paragraph [14]. The following outlines the isobole method theory, that ultimately lead to the determination of synergy, antagonism and zero interaction based on the employed dosing scheme. First it is necessary to determine the concentrations of individual fractions, frn and frn+1, to achieve a given activity (e.g. 40% inhibition). They are described as Dn and Dn+1 (which in this case is equal to IC40n and IC40n+1) in Fig. 1. If there is zero interaction between two fractions, any concentration combination which exhibits the given effect will be plotted on the straight line connecting Dn and Dn+1 thereby fulfill Eq. 1. When a synergistic effect exists between two fractions, it requires less concentration to exhibit the same level of effect hence fulfills Eq. 2 and the line of the same effect will be concave down. If the interaction is antagonistic, the concentration/effect curve fulfills Eq. 3.
| (1) |
| (2) |
| (3) |
Fig. 1. The concept of the isobole method.
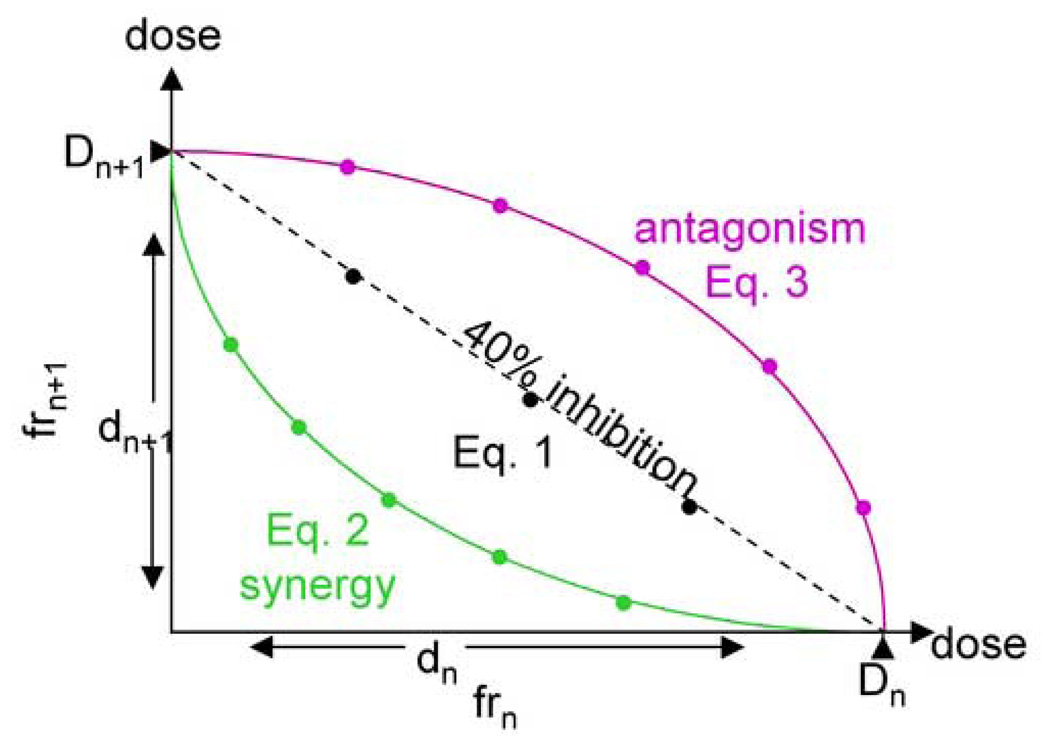
The x-axis represents the concentration of fraction n (dn), and the y-axis gives the concentration of fraction n+1 (dn+1). Dn and Dn+1 are the concentrations required to achieve the target activity (40% mycobacterial growth inhibition in this figure) based on the individual concentrations of one of the fractions n and n+1. If there is no interaction, a plot of the possible combinations of concentrations that achieve the target activity will be a straight line (Eq. 1). If there is synergy, a lower concentration will be required to achieve the same effect, hence the plot will be a down-oriented concave curve (Eq. 2). On the contrary, a higher concentration will be required when there is antagonistic interaction, in which case the curve represents an up-oriented concave (Eq. 3).
Based on this theory, fractions were recombined to satisfy Eq. 1 hypothesizing that there is zero interaction. The recombined fractions were tested against M. tuberculosis as described above to test the hypothesis. The expected activity of 40% bacterial growth inhibition was chosen in order to allow evaluation of both synergy and antagonism and owing to the fact that it is just below the center between undetectable (<5% inhibition) and hard-to distinguish high inhibition (>90% inhibition) of the bioassay. In the few cases where the activity and/or availability of the individual samples did not allow recombination to a target value of 40% inhibition of the cocktail, 80% was chosen as the alternative target inhibition.
3. Results and Discussion
A variety of nomenclature is used in the literature for describing multi-agent interactions. This work follows the definition of Berenbaum [15], which distinguishes between three interactions. (1) If the observed effect is the same as expected with the model, it is defined as zero interaction; (2) there is synergy if the observed effect is greater than expected; and (3) there is antagonism if the effect is less than expected.
A preliminary study suggested the presence of synergy in O. horridus, when two parallel fractionations with different resolutions exhibited a gap in potency among fractions [11]. Two CCC runs were performed under the same condition described in the experimental section, however in one run the eluent was separated into 12 fractions (low resolution mode), while for the other a total of 64 distinct fractions was obtained (high resolution mode). As a result, fractions in low-resolution mode showed higher activities (Fig. 2).
Fig. 2. Parallel low - and high-resolution CCC fractionation of O. horridus extract.
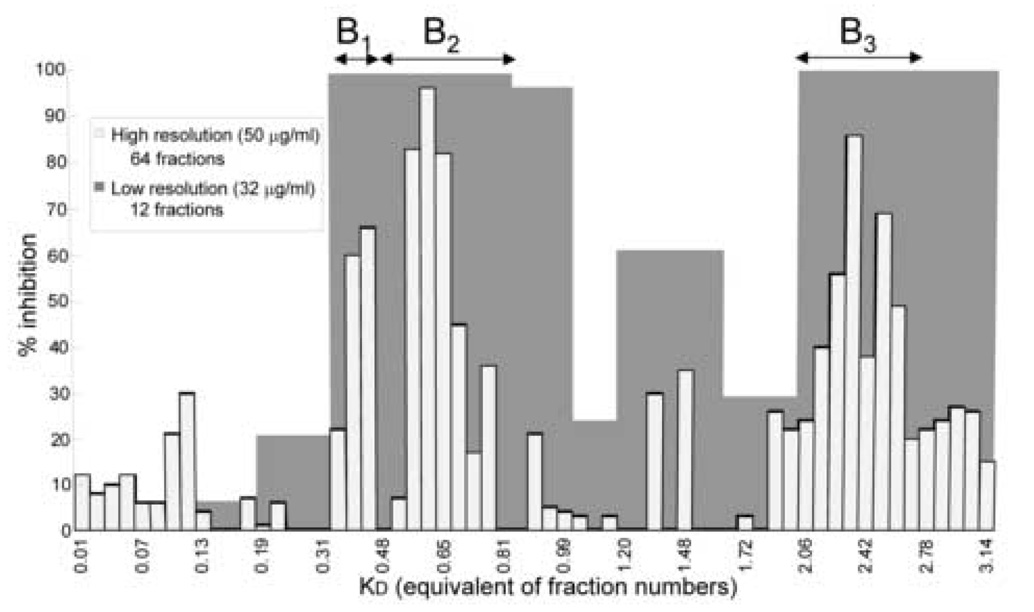
The anti-TB activities of individual fractions in % inhibition were plotted against the KD value of their respective position in the CCC chromatogram. Low-resolution fractions show higher inhibition than high-resolution fractions at lower concentration. The three regions with the activity gap represent the most prominent regions (B1−B3) chosen for synergy evaluation (chromatogram analogous to the data in Figure 3 in from Inui & Case et. al.).
Based on these preliminary results, fractions from three regions in the CCC chromatogram were selected for the evaluation of synergistic effects. Those three regions were named as B1 (0.35<KD<0.44), B2 (0.44<KD<0.81), and B3 (2.06<KD<2.78) as they fell in the B-region or sweet spot (0.3<KD<3.0) of the previously established A-B-C scheme [11,16]. Every individual fraction in the selected region was tested against M. tuberculosis and the results for active fractions are shown in Table 1.
Table 1.
Individual anti-TB activities of the active fractions
| Sample | IC40 (µg/ml) | IC80 (µg/ml) |
|---|---|---|
| B12 | 41.39 | |
| B13 | 25.85 | |
| B23 | 35.28 | 48.87 |
| B24 | 30.50 | 44.47 |
| B25 | 36.50 | 49.27 |
| B26 | 44.64 | |
| B36 | 50.00 | |
| B37 | 41.70 | |
| B38 | 23.45 | |
| B39 | 37.48 | |
| B310 | 42.52 | |
Based on Eq. 1 and taking into account the results from Table 1, combinations of individual fractions were designed to produce eight recombined “cocktails” (Table 2). All inactive fractions were mixed at concentrations at which they showed no mycobacterial growth inhibition.
Table 2.
Recombination scheme for the anti-TB fractions used to produce the cocktails for synergy evaluation
From the left: cocktail mix number, contents, expected activity in case of no interaction, concentration for the expected activity, detailed concentrations for each fraction.
| Cocktails | Ingredients | Expected inhibition (%) | Conc (µg/ml) | Concentrations for each component fraction (µg/ml) | |||||||||
|---|---|---|---|---|---|---|---|---|---|---|---|---|---|
| B11 | B12 | B13 | |||||||||||
| mix 1 | B12+B13 | 40 | 32 | - | 16.29 | 15.71 | |||||||
| mix 2 | B11−B13 | 40 | 32 | 3.00 | 8.28 | 20.72 | |||||||
| B21 | B22 | B23 | B24 | B25 | B26 | B27 | |||||||
| mix 3 | B23−B26 | 40 | 32 | - | - | 6.28 | 23.30 | 0.78 | 1.64 | - | |||
| mix 4 | B23−B27 | 40 | 64 | 10.39 | 10.39 | 2.90 | 22.31 | 3.15 | 4.47 | 10.39 | |||
| mix 5 | B21−B25 | 80 | 64 | 4.54 | 13.33 | 8.74 | 28.43 | 8.96 | - | - | |||
| B31 | B32 | B33 | B34 | B35 | B36 | B37 | B38 | B39 | B310 | ||||
| mix 6 | B36−B310 | 40 | 32 | - | - | - | - | - | 8.53 | 2.82 | 13.71 | 4.39 | 2.55 |
| mix 7 | B31−B28 | 40 | 64 | 22.68 | 0.50 | 0.50 | 0.50 | 8.66 | 7.35 | 8.71 | 15.10 | - | - |
The bioassays were run in triplicate, and the resulting anti-TB activities of the recombined cocktails are shown in Fig. 3. Cocktail 4 from the B2 region of the CCC chromatogram showed the strongest enhancement of 108 %, followed by cocktails 1 and 2 from the B1 region with enhancements of 60.0% and 49.1% respectively.
Fig. 3. Anti-TB activities of the recombined cocktails.
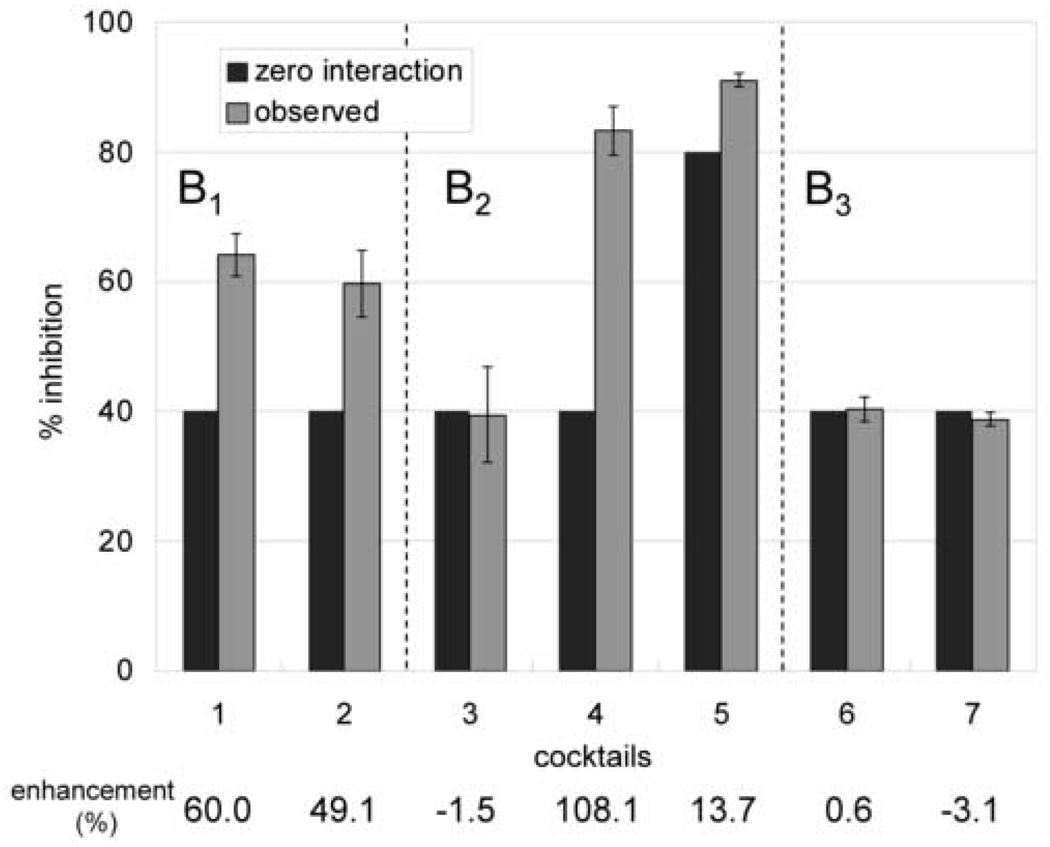
The x-axis is assigned to the different cocktail mixtures as they relate to the three regions B1−B3 of the CCC separation (see Fig 2). The y-axis denotes anti-TB activity as % inhibition. In each mixture, the left bar indicates the expected activity when and only when there is no interaction (Eq. 1). The right bar indicates the observed activity with standard deviations (triplicate testing). The bottom line shows the % difference between expected and observed activities for each of the cocktail mixtures, indicating a significant 2-fold synergistic effect present in cocktail 2.
Table 3 summarizes the result shown in Fig. 3 and Table 2. The fractions containing enhancers can be located by comparing the enhancement. Consequently, in the B1 region of the CCC separation the active principles and enhancers are both contained in the same active fractions B12 and B13. Interestingly and in contrast to this, the enhancers of the B2 region are contained in inactive fractions. No significant synergy was found to occur within the tested KD range in the B3 region. Overall, there was no antagonistic effects observed in any of the cocktail re-combinations and all assays were reproducible in triplicate.
Table 3.
Summary of synergistic enhancements observed for the recombined cocktails
| Cocktail | Enhancement (%) | Recipe |
|---|---|---|
| 1 | 60.01 | 2 active fraction in B1 |
| 2 | 49.14 | all 3 fractions in B1 |
| 3 | −1.56 | 4 active fractions in B2 |
| 4 | 108.10 | all 7 fractions in B2 |
| 5 | 13.77 | 3 active fractions B23−B25 + 2 inactives (B21,B22) |
| 6 | 0.58 | 5 active fractions in B3 |
| 7 | −3.17 | 3 active fractions (B36−B38)+ 5 inactives (B31−B35) |
In conclusion, the presence of synergy (maximum enhancement of 108%) in O. horridus as an anti-TB agent with in vitro activity against M. tuberculosis ERDMAN strain was confirmed in two different regions of the optimized CCC polarity window with no chemical overlap. Moreover it has to be emphasized that, for synergy research, it is vital to exclude the possibility of activity loss in the course of separation. At present, CCC is the only technique fit for this purpose, while being capable of providing high throughput and high-resolution separations at the same time. It is also worthwhile to re-emphasize the importance of the selection of solvent system, as it is essential to concentrate the active constituents and synergistic enhancers in the polarity range where CCC separates with the highest resolution in the run. Finally, the combination of liquid-liquid partition chromatography and the isobole method proves to be an effective tool for the evaluation of synergy and provides guidance for further separation of active and enhancing constituents in a bioassay-guided isolation procedure. Concurrently, the strategy can be utilized to optimize the efficacy of ethnobotanicals by selecting the polarity range containing only active constituents and enhancers while excluding potential side effects.
Acknowledgement
The authors would like to thank Dr. Fanqiu Zhang for in vitro bioassay support, Mr. Samuel Pro for assistance with IT procedures, and Dr. B. Friesen for helpful suggestions. This research was supported by NIH/NCCAM 1R43AT001758-01 and by a grant from the State of Alaska.
Footnotes
Publisher's Disclaimer: This is a PDF file of an unedited manuscript that has been accepted for publication. As a service to our customers we are providing this early version of the manuscript. The manuscript will undergo copyediting, typesetting, and review of the resulting proof before it is published in its final citable form. Please note that during the production process errors may be discovered which could affect the content, and all legal disclaimers that apply to the journal pertain.
References
- 1.Koch M, Schuffenhauer AA, Scheck M, Wetzel S, Casaulta M, Odermatt A, Ertl P, Waldmann H. Proc. Natl. Acad. Sci. U.S.A. 2005;102:17272. doi: 10.1073/pnas.0503647102. [DOI] [PMC free article] [PubMed] [Google Scholar]
- 2.Dobson CM. Nature (London, U.K.) 2004;432:824. doi: 10.1038/nature03192. [DOI] [PubMed] [Google Scholar]
- 3.Stermitz FR, Lorenz P, Tawara JN, Zenewicz LA, Lewis K. Proc. Natl. Acad. Sci. U.S.A. 2000;97:1433. doi: 10.1073/pnas.030540597. [DOI] [PMC free article] [PubMed] [Google Scholar]
- 4.Williamson EM. Phytomedicine. 2001;8:401. doi: 10.1078/0944-7113-00060. [DOI] [PubMed] [Google Scholar]
- 5.Gilbert B, Alves LF. Curr. Med. Chem. 2003;10:13. doi: 10.2174/0929867033368583. [DOI] [PubMed] [Google Scholar]
- 6.Belofsky G, Carreno R, Lewis K, Ball A, Casadei G, Tegos GP. J. Nat. Prod. 2006;69:261. doi: 10.1021/np058057s. [DOI] [PubMed] [Google Scholar]
- 7.Belofsky G, Percivill D, Lewis K, Tegos GP, Ekart J. J. Nat. Prod. 2004;67:481. doi: 10.1021/np030409c. [DOI] [PubMed] [Google Scholar]
- 8.Justice JW. Alaska Med. 1966;8:36. [PubMed] [Google Scholar]
- 9.Smith GW. J. Ethnopharmacol. 1983;7:313. doi: 10.1016/0378-8741(83)90005-3. [DOI] [PubMed] [Google Scholar]
- 10.Turner NJ. J. Ethnobiol. 1982;2:17. [Google Scholar]
- 11.Inui T, Case R, Chou E, Soejarto DD, Fong HHS, Franzblau SG, Smith DC, Pauli GF, Liq J. Chromatogr. Rel. Technol. 2005;28:2017. [Google Scholar]
- 12.Collins LA, Franzblau SG. Antimicrob. Agents Chemother. 1997;41:1004. doi: 10.1128/aac.41.5.1004. [DOI] [PMC free article] [PubMed] [Google Scholar]
- 13.Franzblau SG, Witzig RS, McLaughlin JC, Torres P, Madico G, Hernandez A, Degnan MT, Cook MB, Quenzer VK, Ferguson RM, Gilman RH. J. Clin. Microbiol. 1998;36:362. doi: 10.1128/jcm.36.2.362-366.1998. [DOI] [PMC free article] [PubMed] [Google Scholar]
- 14.Berenbaum MC. J. Theor. Biol. 1985;114:413. doi: 10.1016/s0022-5193(85)80176-4. [DOI] [PubMed] [Google Scholar]
- 15.Berenbaum MC. Pharmacol. Rev. 1989;41:93. [PubMed] [Google Scholar]
- 16.Friesen JB, Pauli GF, Liq J. Chromatogr. Rel. Technol. 2005;28:2777. [Google Scholar]