

Abstract
NMR relaxation dispersion spectroscopy is a powerful technique to elucidate the mechanism of protein-protein binding reactions. However, it is difficult to optimize the concentration ratios that give relaxation dispersions of appropriate amplitude to determine accurate kinetic and thermodynamic parameters, especially in cases of very tight binding. In this study, we have obtained 15N R2 dispersions of Asn803-hydroxylated hypoxia-inducible factor-1α (HIF-OH) in the presence of sub-stoichiometric amount of its target protein, the transcriptional adapter zinc-binding (TAZ1) domain of CREB binding protein, whereas no R2 dispersion was observed for the bound state of HIF-OH at 1:1 concentration ratio because the binding is too tight. Although the R2 dispersions were measured for the free peaks of HIF-OH, they enabled us to quantitate the kinetic and thermodynamic parameters of HIF-OH/TAZ1 binding process. Simulations of effective R2 rates revealed that the association rate is the key factor to determine the amplitude of R2 dispersions. By careful optimization of the concentration ratio, the R2 dispersion method should be generally applicable for studying a wide range of protein-protein, protein-nucleic acid, and protein-small molecule interactions.
NMR relaxation dispersion spectroscopy1–3 is a very powerful technique to characterize chemical and conformational exchange processes in proteins and other biologically important molecules on μs–ms timescales.4 Many of these processes proceed through weakly populated higher energy states that are difficult to detect experimentally. A major advantage of the relaxation dispersion method is that it can provide information on the structure of invisible high energy intermediates by analyzing the relaxation rates of an observable state that interconverts with them.5
We recently developed a method combining 15N R2 relaxation dispersion spectroscopy and NMR titration to elucidate the mechanism of protein-protein binding reactions, and in particular the coupled folding and binding processes that occur when an intrinsically disordered protein binds to its target.6 The method was applied to study binding of the phosphorylated kinase inducible domain (pKID) of the transcription factor CREB to the KIX domain of the CREB binding protein (CBP). By measuring 15N R2 dispersions of pKID in the bound form as a function of pKID:KIX concentration ratio, we showed that pKID forms weak non-specific encounter complexes with KIX that evolve via a folding intermediate to the fully bound state. Although our method is potentially applicable to a broad spectrum of biological interactions, it can be difficult to optimize the concentration ratios that give relaxation dispersions of sufficient amplitude to determine accurate kinetic and thermodynamic parameters. In this Communication, we describe methods for measuring relaxation dispersion in cases of very tight binding or loss of resonances in the bound state due to intermediate exchange.
As an example, we consider binding of the Asn803-hydroxylated hypoxia-inducible factor-1α (HIF-OH) to the transcriptional adapter zinc finger (TAZ1) domain of CBP.7–9 Although HIF-OH binds to TAZ1 by a coupled folding and binding mechanism (Supplementary Figure S1) similar to the binding of pKID to KIX,6 we observe no 15N R2 dispersion for HIF-OH in the fully bound state, i.e. at concentration ratios close to 1:1 that were appropriate for study of the lower-affinity pKID:KIX complex (Supplementary Figure S2).
We therefore analyzed 15N R2 dispersions of the free HIF-OH resonances in samples containing sub-stoichiometric amounts of TAZ1; no dispersion was observed in the absence of TAZ1. In contrast to experiments performed on the bound state of HIF-OH in the presence of equimolar TAZ1, high quality R2 dispersion curves were obtained (Figure 1) and could be fitted well to a two-site exchange model:
where the fitting parameters are the chemical shift difference between the free and bound states, ΔωFB, the population-average intrinsic relaxation rate, R20, the association and dissociation rate constants, kon and koff, and the total concentrations of HIF-OH and TAZ1 (denoted [HIF-OH]0 and [TAZ1]0, respectively). The free TAZ1 concentration, [TAZ1], is calculated from KD, [HIF-OH]0 and [TAZ1]0.
Figure 1.
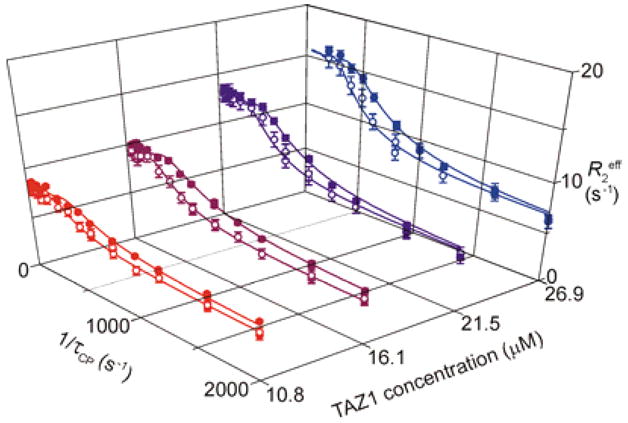
15N R2 dispersion profiles for Arg820 of HIF-OH recorded for 510 μM [15N]-HIF-OH in the presence of sub-stoichiometric amounts of TAZ1. Data were acquired at 900 MHz (filled circles) and 600 MHz (open circles) using relaxation compensated Carr-Purcell-Meiboom-Gill (CPMG) pulse sequences.1,12 Curves for all observable dispersions are shown in Supplementary Figure S3.
For simplicity, we focused on the C-terminal α-helix (residues 816-825), which forms a distinctive binding element in the HIF-1α-TAZ1 complex.7,8 and fitted the dispersion curves to a global exchange process with fixed kon and koff values for all residues. The chemical shift changes ΔωFB determined from the R2 dispersion data correlate well with equilibrium chemical shift changes measured from NMR titration of HIF-OH with TAZ1 (Supplementary Figure S4). The linear correlation with slope near 1 indicates that the weakly populated state detected by the R2 dispersion experiment is the TAZ1-bound form.
Since the kon obtained from these measurements (Table 1) is on the same order as translational diffusion,10 we infer that HIF-OH binding to TAZ1 is diffusion limited.
Table 1. R.
2 dispersion with two-site exchange
| Parameter | value (fitting) |
|---|---|
| [HIF-OH]0 [μM] | 505 (62)a |
| [TAZ1]0 [μM] | 26.9 (3.2)a,b |
| kon × 109 [M−1·s−1] | 1.29 (0.94)a |
| koff [s−1] | 185 (7.6)a |
| KD [nM] | 143c |
Values in parentheses are standard deviations.
determined for the sample with the largest amount of TAZ1. The concentrations of TAZ1 in other samples were scaled by 0.4, 0.6 and 0.8.
calculated according to the formula: KD=koff/kon. This value is in reasonable agreement with the KD of 70 nM measured by isothermal titration calorimetry (unpublished data). Fits to three-site exchange models failed to reproduce the measured KD.
The kon value is greater by three orders of magnitude than that for pKID-KIX complex formation (106 M−1·s−1).6 The difference suggests that we were not able to observe R2 dispersions in the bound state for the HIF-OH-TAZ1 complex because kon is very fast. To understand how the relative concentrations of the binding partners affect the R2 dispersion profile, we simulated11 the dependence of the effective R2 relaxation rate, R2eff (=R20+Rex), on the concentration ratio, [TAZ1]0/[HIF-OH]0, using the parameters obtained from the relaxation dispersion analysis (Figure 2a). Rex is the excess contribution to R2eff caused by the exchange process.
Figure 2.
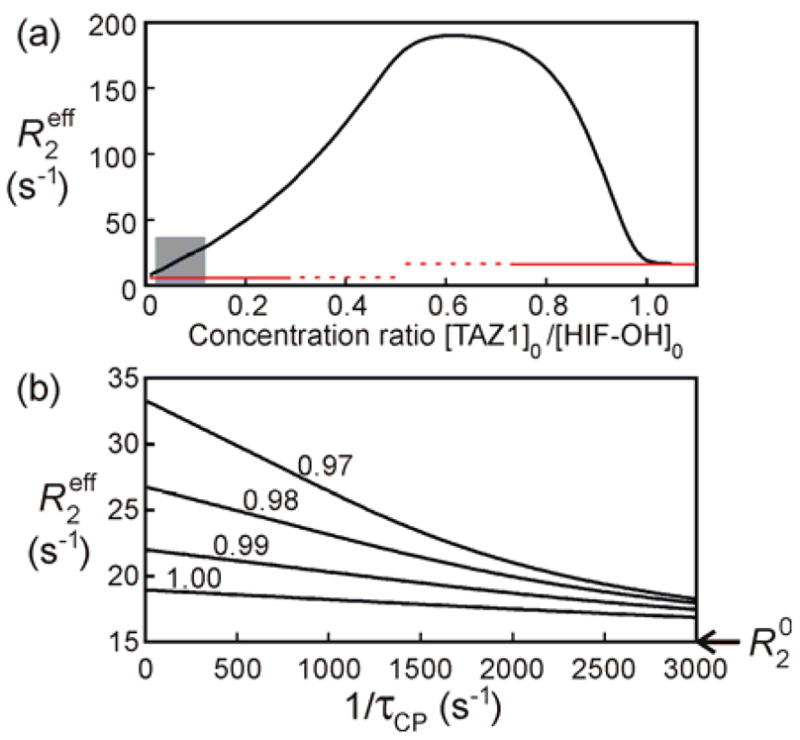
R2eff rates for Arg820 of HIF-OH simulated using the parameters listed in Table 1. (a) R2eff rates versus the concentration ratio, [TAZ1]0/[HIF-OH]0. The red lines indicate R20, where the R20 rates for the free and bound states are 5 and 15 s−1, respectively. The grey area indicates the concentration ratios that give Rex rates from 3 to 25 s−1. A similar plot for the pKID/KIX system6 is shown in Figure S5. (b) R2 dispersion profiles at concentration ratios of 0.97, 0.98, 0.99 and 1. τCP indicates the delay between successive 15N 180 pulses in the CPMG sequence.
Our previous experience of R2 dispersion curve fitting suggests that Rex should be moderate, ~3–25 s−1, as shown by the gray area (concentration ratio of ~0.02–0.12 for the HIF-OH-TAZ1 system), in order to obtain reliable kinetic and thermodynamic parameters from the fits. The concentration ratios that gave good R2 dispersion curves in the experiment (0.021–0.053) indeed fall into this range. When Rex is too large, the NMR peak will be very broad (or unobservable), resulting in an R2 dispersion curve with low signal/noise. On the other hand, Rex is completely suppressed in the presence of excess TAZ1, because the HIF-OH:TAZ1 complex is of sufficiently high affinity (ca. 70 nM by ITC) that the population in the free state is very low. In this case, R2eff reaches the limiting value of R20 for the bound state and there will be no R2 dispersion. Rex is determined by the ratio of the exchange rate, which is a sum of the forward and backward rates([TAZ1]kon+koff), to the chemical shift difference. Since the forward rate, [TAZ1]kon, is the only parameter that depends on the concentration ratio, the forward rate is the key factor that determines the amplitude of Rex. At equimolar concentrations of HIF-OH and TAZ1, the forward rate is very fast compared to the chemical shift difference between the free and bound states ([TAZ1]kon=10883 s−1; ΔωFB=1675 rad·s−1 (3.78 ppm) at 15N frequency of 60.8 MHz). This is the reason why no R2 dispersion was observed at 1:1 concentration ratio. Figure 2a suggests that it should be possible to observe R2 dispersions that satisfy the criterion that Rex be in the range ~3–25 s−1 for concentration ratios from 0.97 to 1. However, simulations of the resulting dispersion profiles (Figure 2b) show that R2eff does not converge to R20 with experimentally attainable 15N 180° pulse repetition rates (1/τCP) so that the derived kinetic and thermodynamic parameters will be unreliable. Therefore, we conclude that when the kon is very fast, dispersion curves should be measured for the free state of a protein in the presence of sub-stoichiometric amounts of the binding partner.
In summary, despite the absence of observable R2 dispersions for the bound state of HIF-OH, we have obtained R2 dispersion profiles of HIF-OH sufficient to derive kinetic and thermodynamic parameters by using sub-stoichiometric concentrations of TAZ1. Although the relaxation rates of the free resonances were analyzed, the chemical shifts of the unobservable bound state could be determined by fitting the dispersion data. In the rather common case where bound peaks are unobservable due to intermediate exchange, relaxation dispersion measurements for free ligand resonances could provide chemical shifts and hence valuable structural information for the complex. By careful optimization of the concentration ratio, the R2 dispersion method should be generally applicable for studying a wide range of protein-protein, protein-nucleic acid, and protein-small molecule interactions.
Supplementary Material
Details of sample preparation, NMR titration of [15N]-HIF-OH with TAZ1, 15N R2 dispersion experiments, fitting of R2 dispersion profiles and simulation of R2 dispersion profiles. This material is available free of charge via the Internet at http://pubs.acs.org.
Acknowledgments
This work was supported by grant CA 96865 from the National Institutes of Health and by the Skaggs Institute for Chemical Biology. J.C.L. was the recipient of an American Cancer Society postdoctoral fellowship. We thank Dr Maria Yamout for valuable discussions and for unpublished ITC data.
References
- 1.Loria JP, Rance M, Palmer AG. J Am Chem Soc. 1999;121:2331–2332. [Google Scholar]
- 2.Mulder FA, Mittermaier A, Hon B, Dahlquist FW, Kay LE. Nat Struct Biol. 2001;8:932–935. doi: 10.1038/nsb1101-932. [DOI] [PubMed] [Google Scholar]
- 3.Boehr DD, McElheny D, Dyson HJ, Wright PE. Science. 2006;313:1638–1642. doi: 10.1126/science.1130258. [DOI] [PubMed] [Google Scholar]
- 4.McCammon JA, Harvey SC. Dynamics of Proteins and Nucleic Acids. Cambridge University Press; Cambridge: 1987. [Google Scholar]
- 5.Korzhnev DM, Salvatella X, Vendruscolo M, Di Nardo AA, Davidson AR, Dobson CM, Kay LE. Nature. 2004;430:586–590. doi: 10.1038/nature02655. [DOI] [PubMed] [Google Scholar]
- 6.Sugase K, Dyson HJ, Wright PE. Nature. 2007;447:1021–1025. doi: 10.1038/nature05858. [DOI] [PubMed] [Google Scholar]
- 7.Dames SA, Martinez-Yamout M, De Guzman RN, Dyson HJ, Wright PE. Proc Natl Acad Sci USA. 2002;99:5271–5276. doi: 10.1073/pnas.082121399. [DOI] [PMC free article] [PubMed] [Google Scholar]
- 8.Freedman SJ, Sun ZY, Poy F, Kung AL, Livingston DM, Wagner G, Eck MJ. Proc Natl Acad Sci USA. 2002;99:5367–5372. doi: 10.1073/pnas.082117899. [DOI] [PMC free article] [PubMed] [Google Scholar]
- 9.Lando D, Peet DJ, Whelan DA, Gorman JJ, Whitelaw ML. Science. 2002;295:858–861. doi: 10.1126/science.1068592. [DOI] [PubMed] [Google Scholar]
- 10.Berg OG, von Hippel PH. Annu Rev Biophys Biophys Chem. 1985;14:131–160. doi: 10.1146/annurev.bb.14.060185.001023. [DOI] [PubMed] [Google Scholar]
- 11.Eisenmesser EZ, Bosco DA, Akke M, Kern D. Science. 2002;295:1520–1523. doi: 10.1126/science.1066176. [DOI] [PubMed] [Google Scholar]
- 12.Tollinger M, Skrynnikov NR, Mulder FA, Forman-Kay JD, Kay LE. J Am Chem Soc. 2001;123:11341–11352. doi: 10.1021/ja011300z. [DOI] [PubMed] [Google Scholar]
Associated Data
This section collects any data citations, data availability statements, or supplementary materials included in this article.
Supplementary Materials
Details of sample preparation, NMR titration of [15N]-HIF-OH with TAZ1, 15N R2 dispersion experiments, fitting of R2 dispersion profiles and simulation of R2 dispersion profiles. This material is available free of charge via the Internet at http://pubs.acs.org.