

Abstract
A tetrafluorophenyl (TFP) ester-terminated self-assembled monolayer (SAM) for the fabrication of DNA arrays on gold surfaces is described. Activated ester SAMs are desirable for biomolecule array fabrication because they readily react with amine-containing molecules to form a stable amide linkage. N-hydroxysuccinimide (NHS) ester SAMs are commonly used for this purpose but are subject to a competing hydrolysis side reaction, limiting their effectiveness under basic conditions. TFP was evaluated here as an alternative activated ester leaving group with a potentially greater stability under basic conditions. It is shown that TFP SAMs are much more stable to basic pH than their NHS analogs and are also more hydrophobic, which is an advantage in the fabrication of high density spotted arrays. DNA arrays prepared on TFP SAMs at pH 10 have a five-fold greater surface density of DNA molecules, reduced fluorescence background, and smaller spot radii than those prepared on NHS SAM analogs.
Introduction
Multi-component biomolecule arrays have become an essential tool for efficiently screening large numbers of bio affinity interactions in a parallel and multiplexed format. For example, DNA arrays have been used to detect the presence and identity of single nucleotide polymorphisms,1–4 to discover sequence-specific binding proteins,5, 6 and to monitor gene expression on a genome-wide scale.7 Array-based formats, composed of many physically distinct features, have proven compatible with a wide variety of detection modalities including: fluorescence,1 surface plasmon resonance,8–10 electrochemical methods,11 and matrix-assisted laser desorption/ionization mass spectrometry (MALDI-MS).12, 13
The fabrication of an array begins with the selection of a suitable substrate and attachment chemistry. An ideal substrate should provide a stable interface under a variety of reaction conditions, support a variety of chemical functionalities to effectively attach the biomolecules of interest, and be reproducibly fabricated. Glass,1, 14, 15 silicon,16–18 diamond and glassy carbon,19–21 amorphous carbon,22 and gold8, 23–27 have each demonstrated their ability to support the fabrication of biomolecule arrays. Gold surfaces have been of particular interest due to their ability to be readily functionalized with thiol-containing organic molecules through the formation of self-assembled monolayers (SAMs).28 Gold substrates are also currently the only substrate that can be monitored with all four of the detection techniques listed above.
Biomolecules have been attached to gold SAMs through both electrostatic29 and covalent23, 30–32 interactions. A covalent interaction is preferred because it ensures the biomolecules are coupled to the surface and are not desorbed during preparation and analysis. The covalent attachment of oligonucleotides to a SAM requires chemical modification. Typically, the oligonucleotides are modified with either a 3′- or 5′-terminal thiol or primary amine, using a variety of commercially available phosphoramidite reagents.
Amine-terminated SAMs can be reacted with a heterobifunctional linker such as sulfosuccinimidyl 4-(N-maleimidomethyl cyclohexane)-1-carboxylate (SSMCC) to create a maleimide-terminated surface, which readily reacts with free thiol groups.8 A maleimide-terminated SAM for the direct coupling of thiol-containing biomolecules has also been synthesized and evaluated,33 and a thiol-disulfide exchange reaction has been employed to couple thiol-containing biomolecules to a pyridyl disulfide-modified surface.24 For efficient coupling to these surfaces the biomolecules must contain reduced thiol groups. In the case of thiol-terminated oligonucleotides, each oligonucleotide sequence of interest must be reduced with either dithiothreitol (DTT) or tris (2-carboxyethyl) phosphine hydrochloride (TCEP·HCl) and then purified with reverse-phase HPLC. This process is required just prior to the surface-coupling reaction, due to reformation of disulfide bonds over time.
The coupling of amine-containing biomolecules, such as amine-terminated oligonucleotides, provides a simpler means for preparing arrays because deprotection and purification just prior to use is not required. Succinimide ester-terminated SAMs are commonly used for the direct coupling of amine-containing biomolecules to surfaces.31, 32, 34 While this coupling reaction is straightforward, the N-hydroxysuccinimide (NHS) functional group has been shown to be highly prone to base hydrolysis both in solution and on the surface.35, 36 This is an issue as basic conditions are required in the coupling reaction to ensure that the amine groups (pKa ≈ 10 for a primary alkyl amine) are deprotonated and available for reaction. An aldehyde-terminated SAM was prepared by Peelen and has been used in the coupling of amine-containing oligonucleotides,23 proteins, and cells.34 The aldehyde functional group is not susceptible to base hydrolysis, allowing for use at elevated pH conditions. These surfaces, however, require an additional reduction step to form an irreversible secondary amine from the Schiff base (imine) formed between the aldehyde and amine groups. To maximize the conversion of Schiff base to amine the coupling reaction is carried out under dry conditions, producing features with a non-uniform, “coffee ring,” appearance.37
An ideal means for the coupling of amine-containing biomolecules to a surface would combine the one-step amide bond formation of NHS esters and the resistance to base hydrolysis of an aldehyde. Fluorinated phenyl esters provide a chemical functionality that readily reacts with amines, in a one-step reaction, to form amide linkages. These esters have been used as an alternative activating group in solid-phase peptide synthesis.38–40 Kovacs showed that pentafluorophenyl esters ability to readily react with amine groups offer a superior alternative to the traditional, base-labile 9-fluorenylmethylcarbonyl (Fmoc).38 Recently, a tetrafluorophenyl ester-modified dye molecule has demonstrated a lower susceptibility to base hydrolysis than its NHS analog.41, 42
In the present work dithiobis(2,3,5,6 tetrafluorophenyl undecanoate, Figure 1) (henceforth referred to as TFP) was synthesized and evaluated as a reagent for the preparation of an amine reactive SAM surface. The coupling efficiency of amine-modified oligonucleotides was compared, as a function of pH, for aldehyde-, NHS-, and TFP-terminated SAMs. The coupling efficiency of thiol-modified oligonucleotides to a maleimide-terminated SAM was also compared, as a function of pH. While the thiol-maleimide coupling was independent of pH, the aldehyde- and TFP-terminated SAMs showed increasing oligonucleotide density with increasing pH. The NHS surface also generally showed increased oligonucleotide density with increasing pH; however, at high pH (10), the competing base-catalyzed hydrolysis reaction significantly decreases the coupling density (Figure 2). It is shown that the TFP surface is less susceptible to this reaction, exhibiting a 10-fold increase in half-life under pH 10 coupling conditions. In addition, a comparison of the NHS and TFP surfaces shows lower average background fluorescence backgrounds and smaller spot radii for the TFP surface at each pH examined.
Figure 1. Synthesis of dithiobis(2,3,4,5 tetrafluorophenyl undecanoate).
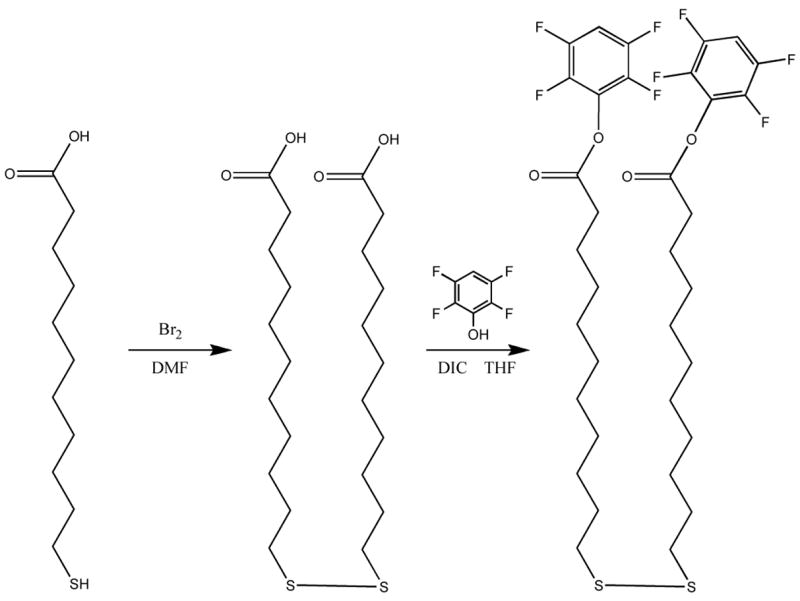
The synthesis of dithiobis(2,3,5,6 tetrafluorophenyl undecanoate) was carried out in two steps: (1) the formation of dithiobis(undecanoic acid) from mercaptoundecanoic acid (97% yield) and (2) the formation of the tetrafluorophenyl ester from the resulting dithiobis(undecanoic acid) (56% yield).
Figure 2. Coupling vs. Hydrolysis.
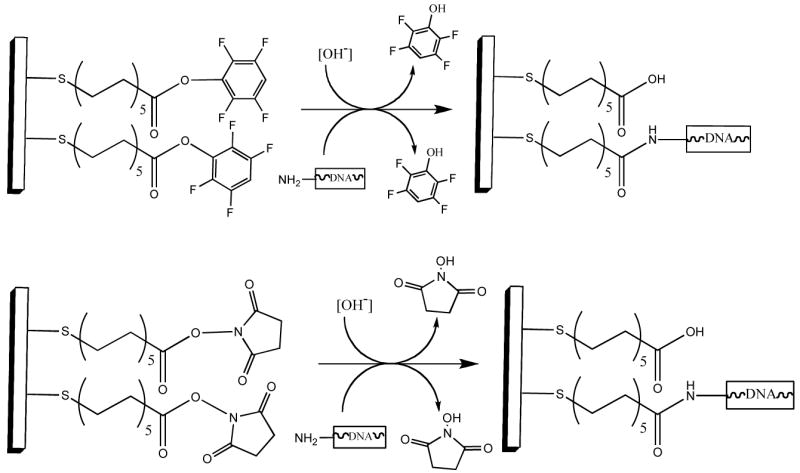
The TFP (top) and NHS (bottom) SAM surfaces react with amine-containing molecules to form amide linkages. The hydrolysis of these esters is a secondary, competing, side reaction whose rate increases with increasing pH.
Experimental Section
Reagents and Materials
Gold-coated, glass slides (20Å Cr, 500Å Au) were purchased from Evaporated Metal Films Co. (Ithaca, NY). All chemical reagents were purchased from Sigma-Aldrich (St. Louis, MO) unless otherwise noted.
Oligonucleotides
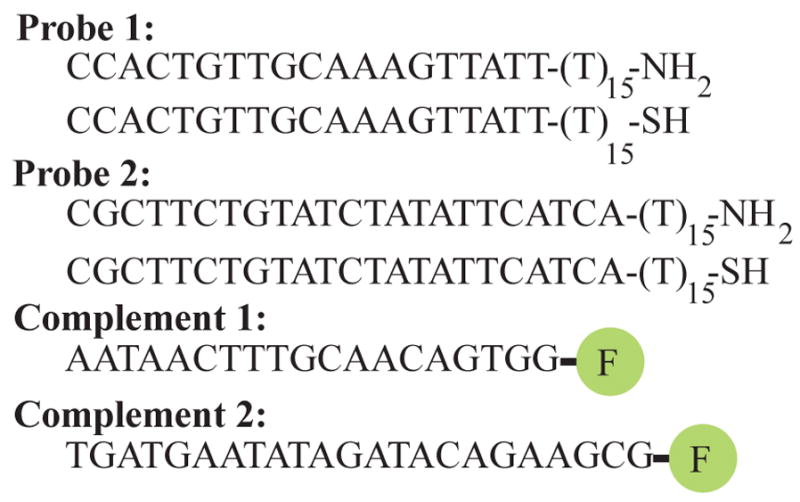
The oligonucleotides used in these experiments (Table 1) were synthesized by Integrated DNA Technologies (Coralville, IA) using standard phosphoramidite chemistries. Surface-bound probe oligonucleotides were modified with either a 3′-thiol (C3 S-S) or 3′-primary amine (3AmM) separated from the oligonucleotide sequence of interest with fifteen thymidine (dT) residues. Thiol modifications allow for the covalent attachment of the probe oligonucleotides to a maleimide-terminated surface while the amino modifications react with aldehyde-, NHS- and TFP-terminated surfaces. The fifteen dT spacer provides sufficient distance between the surface and the oligonucleotide sequence of interest to ensure optimal hybridization.1 Complementary oligonucleotides to probe 1 and probe 2 were synthesized with a 3′ 6-carboxyfluorescein moiety (Table 1).
Table 1. Oligonucleotides.
Oligonucleotides (5′ to 3′) used in this study were synthesized using standard phosphoramidite chemistry. Each probe oligonucleotide was synthesized with either a 3′-thiol or 3′-primary amine group separated from the oligonucleotide sequence of interest by 10 thymidine (dT) residues. Complementary oligonucleotides were modified with a 3′ fluorescein moiety, allowing for fluorescence-based of hybridization detection.
|
All 3′-thiol modified oligonucleotides were deprotected and purified using previously reported methods.8 Each oligonucleotide was deprotected for 30 minutes in 20 μL of 100mM dithiothreitol (DTT) solution (100mM triethanolamine (TEA), pH 7.0) and purified by reverse-phase, binary gradient elution HPLC (SCL-10ADVP Shimadzu; Columbia, MD). Purified oligonucleotides were stored dry, under nitrogen at −20°C until needed. Upon use, each oligonucleotide was reconstituted in the appropriate buffer (see below). Amino-terminated oligonucleotides were also purified with reverse-phase HPLC, reconstituted in the appropriate buffer, and stored at −20°C until needed. All oligonucleotide concentrations were determined by absorption measurements at 260nm (HP8453 UVVIS; Santa Clara, CA).
Synthesis of dithiobis(2,3,5,6 tetrafluorophenyl undecanoate)
The synthesis of dithiobis(2,3,5,6 tetrafluorophenyl undecanoate) was carried out in two steps (Figure 1): (1) the formation of dithiobis(undecanoic acid) from mercaptoundecanoic acid and (2) the formation of the tetrafluorophenyl ester from the dithiobis(undecanoic acid).
First, 1.0g of mercaptoundecanoic acid was placed into 15mL of anhydrous DMF and chilled on ice. A 0.60mol equivalent of bromine (0.14mL) was added drop-wise and the reaction stirred for 3 hours on ice. The formation of the dithiobis(undecanoic acid) was monitored via TLC (9:1 hexanes:ethyl acetate on neutral silica). The solvent was removed and the product washed with a saturated sodium bisulfite solution to remove any unreacted bromine. Upon filtering and drying, 0.97g of a white solid was obtained (97% yield). 1H NMR (CDCl3) δ: 2.56 (t, 2H), 2.32 (t, 2H), 1.54 (m, 4H), 1.41 (m, 2H), 1.40–1.25 (m, 10H).
Next, 0.80g of the dithiobis(undecanoic acid) was dissolved in 15mL of anhydrous DMF under nitrogen, and placed on ice. An excess of 2,3,5,6 tetrafluorophenol (1.1 mole equivalent, 0.66g) was dissolved in anhydrous DMF and added. To the mixture, 1.1 mole equivalents (0.91mL) of the diisopropyl carbodiimide was added drop-wise and allowed to stir on ice for 12hrs. Reaction progress was monitored with TLC (9:1 hexanes:ethyl acetate on neutral silica). Upon completion the reaction was filtered, the solvent removed, and the solid purified via column chromatography using the TLC conditions. Upon drying, 0.73g of dithiobis(2,3,5,6 tetrafluorophenyl undecanoate) was obtained (56 % yield). 1H NMR (CDCl3) δ: 6.46 (m, 1H), 2.56 (t, 2H), 2.33 (t, 2H), 1.54 (m, 4H), 1.41 (m, 2H), 1.40–1.25 (m, 10H). HRMS (ESI) for C34H42F8O4S2 (M+H+) m/z 731.2475, found 731.2478.
Coupling of Amine-Modified Oligonucleotides
Gold-coated slides were modified with SAMs by placing the slides in 1–10mM ethanolic solutions of the molecule of interest for 12 hours. NHS-terminated SAMs were prepared with dithiobis(succinimidyl undecanoate) purchased from Dojindo (Gaithersburg, MD). TFP-terminated SAMs were prepared with newly synthesized dithiobis(2,3,5,6 tetrafluorophenyl undecanoate). Aldehyde-terminated SAMs were prepared with dithiobis(11-undecanal) synthesized following previously reported methods.43
Prior to oligonucleotide coupling, each slide was removed from the SAM solution, rinsed with 10mL of ethanol and 10mL of DI water, and dried under a stream of nitrogen gas. Amine-terminated probe oligonucleotides (probe 1 and probe 2, Table 1) were diluted to 1mM in 100mM buffers of pH 7.0 (NaH2PO4), 8.0 (NaH2PO4), 9.0 (NaH2BO3) or 10.0 (NaHCO3). The buffered oligonucleotides solutions were spotted directly onto the NHS- and TFP-terminated SAM surfaces (0.3μL) and incubated in a humid chamber for 12 hours.
Before spotting (0.3μL) the aldehyde-terminated surfaces, 50mM NaBH3CN was added to the buffered oligonucleotides solutions to convert the Schiff base to a secondary amine. Oligonucleotides were coupled to the aldehyde surface for 12 hours under dry conditions, allowing the reaction to proceed.
After incubation, each surface was washed with DI water and incubated in 1×SSPE (10mM NaH2PO4, 150mM NaCl, 1mM EDTA, pH 7.4) for 30 minutes at 37°C to remove any non-specifically bound oligonucleotides.
Coupling of Thiol Oligonucleotides
Gold-coated slides were modified with an amine-terminated SAM by placing the slides in a 1–10mM ethanolic solution of 11-amino-1-undecanethiol (Dojindo) for 12 hours. The terminal amine groups were then reacted with a heterobifunctional linker, sulfosuccinimidyl 4-(N-maleimidomethyl) cyclohexane-1-carboxylate (SSMCC) (Pierce; Milwaukee, WI), creating a maleimide-terminated surface. Prior to the reaction the surfaces were removed from the SAM reaction and rinsed with 10mL of ethanol and 10mL of DI water. Thiol-terminated probe oligonucleotides (probe 1 and probe 2, Table 1) were reduced and reconstituted to a final concentration of 1mM in 100mM buffers of pH 7.0 (NaH2PO4), 8.0 (NaH2PO4), 9.0 (NaH2BO3) or 10.0 (NaHCO3). The buffered oligonucleotide solutions were spotted onto the maleimide-terminated SAM surfaces (0.3μL) and incubated for 12 hours in a humid chamber. Prior to oligonucleotide coupling, each slide was rinsed with 10mL of ethanol, 10mL of DI water and dried under a stream of nitrogen gas.
After incubation, each surface was washed with DI water and incubated in 1×SSPE (10mM NaH2PO4, 150mM NaCl, 1mM EDTA, pH 7.4) for 30 minutes at 37°C to remove any non-specifically bound oligonucleotides.
Surface Characterization
NHS- and TFP-terminated SAMs were characterized with polarization modulation FTIR reflection absorption spectroscopy (PM-FTIRRAS).44 IR spectra in the 800–4000cm−1 region were collected with a Bruker PMA50 spectrometer with real-time interferogram sampling electronics (GWC Technologies; Madison, WI). A HgCdTe detector was used to probe the 800–2000cm−1 region and an InSb detector was used for the 2000–4000cm−1 range.
Contact angles of carboxylate-, NHS- and TFP-terminated surfaces were obtained with a Ramé-Hart goniometer (model 200-F1) equipped with DropImage Standard software. The advancing and receding contact angles (θsubstrate) were measured using deionized water as the probe liquid. Reported angles are the average of three SAM substrates, with three measurements taken at different locations per substrate.
Hybridization Density
Surfaces modified with single-stranded oligonucleotides, described above, were incubated with 2μM fluorescently labeled complements (complement 1 and complement 2, Table 1) in 1×SSPE buffer for 30 minutes (40μL total volume). The surface was then rinsed with 10mL of 1×SSPE buffer, incubated in 1×SSPE at 37°C for 5 minutes to remove non-specifically bound complement, and the fluorescence intensities of the hybridized oligonucleotides were measured with a GeneTAC UC4X4 scanner (Genomic Solutions; Ann Arbor, MI). Each surface was then placed in 2mL of an 8M urea solution to completely elute the complementary oligonucleotides. The urea solutions were collected, placed in a 96 well plate, and their fluorescence intensities were measured with a BIOTEK Flx 800 fluorescent plate reader. The fluorescence intensities of the eluted DNA molecules were compared to calibration solutions (10−11 to 10−8 M) of the fluorescently labeled complements in 8M urea and used to calculate the number of complementary oligonucleotides hybridized to the surface. The hybridization densities were calculated from these values.
Reaction Kinetics
The hydrolysis of the NHS- and TFP-terminated SAMs was monitored with PM-FTIRRAS. Each surface was incubated in 10mL solutions of pH 7.0 (NaH2PO4), 8.0 (NaH2PO4), or 10.0 (NaHCO3) for 720 minutes. Data points were collected every 20 minutes for 0–180 minutes, and then every 120 minutes for 240–720 minutes. After each incubation period the surfaces were removed from the buffer, rinsed with 10mL of ethanol and 10mL of DI water, and dried under a stream of nitrogen gas. After obtaining an IR spectra, the surfaces were re-incubated and the process repeated. To correct for the hydrolysis occurring from the washing process, NHS- and TFP-terminated SAMs were monitored with PM-FTIRRAS for 15 washing cycles of 10mL of ethanol, 10mL DI water, and drying with nitrogen gas.
Results and Discussion
Surface characterization
NHS- and TFP-terminated surfaces were characterized with PM FTIRRAS measurements and compared to the IR spectra of the bulk molecules. Both the TFP and NHS SAM surfaces exhibited symmetric at (2858 cm−1) and asymmetric (2921 cm−1) methylene stretches, indicating that the monolayers are relatively well ordered.45–47 The most prominent bands in the NHS-terminated SAM arise from the activated ester carbonyl vibration (1750cm−1) and the C-O ester stretch (1214 and 1076 cm−1). Spectra of the TFP-terminated SAMs also showed prominent peaks arising from the activated ester carbonyl (1739cm−1), C-O ester peak (1181cm−1) and the phenyl stretches (1531 and 1489 cm−1) (Figure 3).
Figure 3.

PM-FTIRRAS spectra of NHS- and TFP-terminated SAMs on gold. These surfaces were prepared by placing gold-coated slides in 1–10mM ethanolic solutions of the molecule of interest for 12 hours, rinsing with 10mL of ethanol and 10mL of water, and drying with nitrogen gas.
Contact angles were measured to determine the differences in hydrophobicity of carboxylate- (θCOO = 18.5±1.9°), NHS- (θNHS = 52.5±2.0°), and TFP-terminated (θTFP = 66.8±1.8°) SAMs. As expected, the TFP surface showed a higher degree of hydrophobicity, due to the presence of the four fluorine atoms, than the NHS surface. The small contact angles for the carboxylate-terminated surface show the large decrease in hydrophobicity resulting from the complete hydrolysis of either the NHS or TFP surface.
Generalized SAM Comparison
To determine the density of oligonucleotides coupled to the surface as a function of the reaction pH, fluorescence images of maleimide-, aldehyde-, NHS-, and TFP-terminated surfaces were taken after the coupled probe oligonucleotides were hybridized with their fluorescently labeled complements. To the amine-reactive surfaces, 0.3μL of 1.0mM solutions of amine-terminated probe 1 and probe 2 oligonucleotides (Table 1) in pH 7.0, 8.0, 9.0 and 10.0 buffers were spotted, in triplicate, and allowed to couple to the surface. For comparison, 0.3μL of 1.0mM solutions of thiol-terminated probe 1 and probe 2 oligonucleotides (Table 1) were coupled to a maleimide-terminated surface using the same buffers (see Experimental Section). The maleimide surface was chosen as a reference as it has served as the primary means of coupling oligonucleotides to gold SAMs in our laboratory2, 30, 48, 49, and thiol-maleimide coupling has been shown to be pH-independent.35
The average fluorescence background for each surface was determined by averaging the fluorescence intensities of the areas not containing oligonucleotide features. A ratio of the average feature fluorescence intensity, as a function of coupling pH, to the average background fluorescence for each surface is plotted in Figure 4. While such surface fluorescence measurements are non-linear in nature,30 they do provide a convenient qualitative means for analyzing oligonucleotide coupling.
Figure 4. pH vs. SAM.

Fluorescence intensity of oligonucleotide features on maleimide-, aldehyde-, NHS-, and TFP-terminated SAMs as a function of pH. Surfaces were prepared as described in the Experimental Section, hybridized with 40μL of 0.20μM solutions of the fluorescently labeled complements, and their fluorescence intensities measured. Fluorescence intensities are reported as the ratio of the average feature intensity to the average background intensity. While surface fluorescence is non-linear and is thus not a quantitative measure it does provide a qualitative view of oligonucleotide coupling. The fluorescence results for the maleimide, NHS, and TFP surfaces were confirmed with quantitative hybridization density measurements from wash-off studies.
The thiol-maleimide coupling on the surface is pH-independent, corresponding to the results found in solution.35 The maleimide-terminated surfaces provide a less than ideal chemistry due to the need to reduce and purify the thiol-modified oligonucleotides prior to each coupling. Also, the feature fluorescence intensities obtained from the maleimide-terminated surface are less intense than those obtained for pH 9.0 and 10.0 coupling conditions on the amine-reactive surfaces. The aldehyde-terminated surface demonstrates an increase in oligonucleotide density with increasing coupling pH, corresponding to the results found by Peelen et al.23 However, this method of attachment relies on a reducing agent to form a stable attachment and produces non-uniform features due to the required reaction conditions. The reducing agent (typically NaBH3CN) is needed to reduce the labile Schiff base formed in the amine-aldehyde coupling reaction, to a stable secondary amine. Due to the lability of both the Schiff base and the reducing agent, it is necessary to remove water during the coupling reaction to obtain good coupling yields. This causes features to dry out, producing non-uniformity and the appearance of “coffee-rings.”37
Both the NHS and TFP esters provide a one-step coupling chemistry, due to their ready reaction with amines to form amides. Also, the coupling reactions can be carried out in a humid chamber ensuring feature uniformity due to the non-drying conditions. A drawback to using such activated esters, however, is the possible side-reaction resulting from base hydrolysis. As Figure 4 demonstrates, coupling reactions carried out at pH 10 result in a decreased density of oligonucleotides coupled to the NHS surface. In contrast, the fluorescence intensity of coupled oligonucleotides on the TFP surface increases over the entire pH range (7–10) demonstrating that it is less susceptible to the hydrolysis side-reaction. For both the NHS and TFP surfaces, the largest increase in fluorescence is between pH 8 and 9.
As a control experiment, the thiol-terminated probe oligonucleotides (Table 1) were spotted onto both the NHS and TFP surfaces. Upon hybridization with the fluorescently labeled complements only the background fluorescence was observed in each of the features.50
NHS and TFP Comparison
To further compare the activated ester SAMs the average fluorescence background signal, average spot radius, and average hybridization density of oligonucleotide features as a function of coupling pH were determined for the NHS and TFP surfaces (Table 2).
Table 2. NHS/TFP Comparison.
Comparison of the average fluorescence background signal, average feature fluorescence signal, average spot radius, and average hybridization density for NHS- and TFP-terminated SAMs as a function of pH. The surfaces were prepared, in triplicate, as described in the Experimental Section with 3 features of oligonucleotide 1 (Table 1) on each surface. The average background fluorescence signal was determined after the surfaces were hybridized with their fluorescently labeled complements and is the average signal obtained from areas not containing oligonucleotide features. The average feature fluorescence signal and average feature radius were obtained after hybridization with their fluorescently labeled complements. The hybridization densities were obtained by collecting the hybridized complements and comparing their fluorescence intensities to those from a calibration curve.
| pH 7 | pH 8 | pH 9 | pH 10 | |||||
|---|---|---|---|---|---|---|---|---|
| NHS | TFP | NHS | TFP | NHS | TFP | NHS | TFP | |
| Average Background (RFU) | 741 ± 53 | 482 ± 68 | 523 ± 113 | 509 ± 13 | 581 ± 97 | 458 ±72 | 702 ± 21 | 574 ± 91 |
| Average Signal (RFU) | 4850 ± 290 | 2024 ± 145 | 4840 ± 132 | 3665 ± 110 | 6972 ± 181 | 6045 ± 117 | 4212 ± 98 | 9471 ± 110 |
| Average Spot Size (μm) | 1580 ± 40 | 1380 ± 75 | 1630 ± 102 | 1340 ± 43 | 1720 ± 103 | 1360 ± 115 | 1680 ± 120 | 1360 ± 85 |
| Average Hybridization Density (1012 molecules/cm2) | 2.10 ± 0.11 | 1.98 ± .51 | 2.19 ± 0.89 | 2.02 ± 0.48 | 2.87 ± 0.67 | 2.67 ± 0.21 | 1.75 ± 0.49 | 4.12 ± 0.38 |
High background fluorescence in an array-based assay is often caused by non-specific interactions between the surface chemistry and the fluorescently labeled molecule of interest. The ability to prevent such unwanted interactions can lead to a overall higher sensitivity. For each coupling pH, the background fluorescence (after hybridization of the coupled oligonucleotide features with their fluorescently labeled complements) of the TFP surface was lower than its NHS analog: 35% decrease in fluorescence at pH=7, 3% at pH=8, 21% at pH=9, and 18% at pH=10. This decrease in background fluorescence is attributed to the more hydrophobic nature of the fluorinated phenols, demonstrated by the 15.5° increase in contact angle between θTFP and θNHS.
At pH 7 the average spot radii for the NHS and TFP surfaces were 790 and 690μm, respectively. The smaller spot size is also attributed to the hydrophobic nature of the TFP surface, which is constant over the coupling reaction pH range as observed from the similar spot radii (690, 670, 680, and 680μm radii at pH 7.0, 8.0, 9.0, and 10.0). Hydrolysis on the NHS surface becomes apparent with increasing coupling pH as the radii increase from 790μm at pH 7.0 to 840μm at pH 10.0. The smaller spot radii on the TFP surface enable the fabrication of somewhat higher density arrays. For example, comparing the spot radii at pH 7 for 0.3μL spots, a 1.0cm2 NHS surface could contain a maximum of 50 spots while a 1.0cm2 TFP surface could contain 66 spots (a 132% increase in density).51
To more accurately quantify the number of probes coupled to the surface as a function of coupling pH, hybridization densities were obtained. Each surface was hybridized with fluorescently labeled complement, dehybridized in 8M urea, the wash-off collected, the fluorescence intensities determined and compared to a calibration curve constructed from known concentrations of the fluorescently labeled complementary oligonucleotides in 8M urea solutions. Once the number of oligonucleotides was obtained, the hybridization density was determined by:
The average hybridization density for the maleimide-terminated surfaces (4.0(±0.2)×1012 molecules/cm2) was independent of the coupling pH. The hybridization density for the NHS and TFP surfaces at pH 10.0 (2.10×10¹² molecules/cm2 for NHS, 4.12×10¹² moelcules/cm2 for TFP) indicates that the rate of hydrolysis of the NHS surface is faster than the coupling of the amine-terminated oligonucleotides. The hybridization densities shown in Table 2 correspond to the fluorescence intensities obtained in Figure 4.
Stability
To compare the stabilities of the individual SAMs, oligonucleotide arrays were fabricated on maleimide-, NHS- and TFP-terminated surfaces (See Experimental Section). The fluorescence signal of the hybridized oligonucleotides was monitored through a series of 10 hybridization/dehybridization cycles. The fluorescence intensity for each hybridization cycle was normalized to the fluorescence intensity obtained from the first hybridization. For each of the three surfaces, no significant loss in signal was observed (data not shown), indicating a high degree of surface stability under then conditions examined.
Rates of Hydrolysis
Tournier et al. have shown that the hydrolysis of NHS esters, in solution, increases with pH.35, 52 The rate of hydrolysis of NHS-terminated SAMs, analogous to the NHS molecule used in the current work, has been determined at pH 12 to have a rate constant of 4.5×10⁻² M−1s−1.36 In the present work hydrolysis for the NHS and TFP surfaces was monitored under conditions that are more compatible with the preparation and usage of biomolecule arrays. A series of both the NHS and TFP SAM surfaces were prepared and their hydrolysis over an 8 hour period of exposure to pH 7.0, 8.0, and 10.0 solutions was monitored using PM-FTIRRAS.
To determine the rate of hydrolysis for the NHS and TFP surfaces, decreases in the activated ester carbonyl stretch (1750cm−1 for NHS, 1739 cm−1 for TFP) were monitored over time. To ensure that the rates of hydrolysis were not compromised by loss of the SAM from the gold surface, the symmetric and asymmetric methylene stretches of the alkyl chain (present in both the TFP and NHS SAMs) were monitored throughout the process. The overall variation in methylene stretches for both surfaces were less than 8%, indicating that the SAM was not substantially desorbed from the surface.
The rate of hydrolysis for both the TFP and NHS esters correspond to a first-order process (Figure 5), in accordance with the results obtained by Dordi.36 The reaction can be described using a pseudo first order reaction rate constant in which [OH−] ≈ constant, thus . To determine the rate constants for the hydrolysis of the NHS and TFP esters, ln(1−x) (where x is the fraction hydrolyzed) reacted) was plotted as a function of time (Figure 5). The half-reaction time was determined using: . Table 3 summarizes the reaction rate and half-reaction time for each surface at each pH.
Figure 5.

Hydrolysis of the NHS and TFP molecules as a function of time was monitored with PM-FTIRRAS by comparing the C=O stretch to the CH2 stretch. (a) C=O stretch of the TFP molecule as a function of time at pH 10. Plots of ln(1−x) (x = fraction hydrolyzed) as a function of time for the hydrolysis of NHS- and TFP-terminated SAMs in (b) pH 7.0 NaH2PO4 buffer, (c) pH 8.0 NaH2PO4 buffer and (d) pH 10.0 NaHCO3 buffer. For each surface and pH a least-squares regression (solid line) was used to determine the rate constant and half-life.
Table 3. Kinetics information.
Rate constants (k′) and half-reaction times (t1/2) for NHS- and TFP-terminated SAMs at room temperature and pH 7.0, 8.0, and 10.0 conditions. Rate constants were determined from the linear regressions of the ln(1-x) vs. time plots in Figure 5. Half-reaction times were calculated using t1/2= ln 2/k′.
| pH 7 | pH 8 | pH 10 | ||||
|---|---|---|---|---|---|---|
| k′ (1/min) | t1/2 (min) | k′ (1/min) | t1/2 (min) | k′ (1/min) | t1/2 (min) | |
| NHS | 0.0017 | 407 | 0.0039 | 178 | 0.0182 | 39 |
| TFP | 0.0009 | 770 | 0.0013 | 533 | 0.0021 | 330 |
These studies demonstrate that the rate of hydrolysis increases, for both NHS and TFP surfaces, with increasing pH. The NHS surfaces exhibit a greater rate of hydrolysis than the TFP surfaces for the pH 7.0, 8.0 and 10.0 conditions (Table 3). The rapid hydrolysis of the NHS surface at pH 10 (39 minutes) accounts for the decreased probe density seen at this pH (Table 2). The TFP surface exhibits an almost 10-fold longer half-life at pH 10. Decreasing the pH leads to a corresponding decrease in the half-life difference between the NHS and TFP surfaces (8.5× difference, pH 10; 3.0× difference, pH 8; 1.9× difference, pH7).
Conclusion
Dithiobis(2,3,5,6 tetrafluoro undecanoate) molecules were synthesized and used to form TFP-terminated SAMs on gold. This SAM readily reacts with amine-containing oligonucleotides for DNA array fabrication. Oligonucleotide arrays were fabricated on maleimide-, aldehyde-, NHS- and TFP-terminated SAMs and compared. When compared to the NHS SAMs, the TFP analog demonstrates decreased hydrolysis rates under basic conditions, permitting increased oligonucleotide coupling efficiency. The TFP surface also demonstrates comparable stability, reduced fluorescence background, and reduced feature sizes for the creation of higher density arrays.
Acknowledgments
We would like to thank Professor Robert Hamers for the use of the PM-FTIRRAS instrument, Dr. Paula Colavita for her assistance with this instrument, Professor David Beebe for the use of his goniometer, and Dr. Michael Shortreed for his time and input into this project. This work was funded by NIH grants R01HG02298 and R01EB00269 and the University of Wisconsin Technology Interface Fund.
References
- 1.Guo Z, Guilfoyle RA, Thiel AJ, Wang RF, Smith LM. Nucleic Acids Research. 1994;22(24):5456–5465. doi: 10.1093/nar/22.24.5456. [DOI] [PMC free article] [PubMed] [Google Scholar]
- 2.Chen Y, Shortreed MR, Olivier M, Smith LM. Analytical Chemistry. 2005;77(8):2400–2405. doi: 10.1021/ac0483825. [DOI] [PubMed] [Google Scholar]
- 3.Hinds DA, Stuve LL, Nilsen GB, Halperin E, Eskin E, Ballinger DG, Frazer KA, Cox DR. Science. 2005;307(5712):1072–1079. doi: 10.1126/science.1105436. [DOI] [PubMed] [Google Scholar]
- 4.Burton PR, Clayton DG, Cardon LR, Craddock N, Deloukas P, Duncanson A, Kwiatkowski DP, McCarthy MI, Ouwehand WH, Samani NJ, Todd JA, Donnelly P, Barrett JC, Burton PR, Davison D, Donnelly P, Easton D, Evans D, Leung HT, Marchini JL. Nature. 2007;447(7145):661–678. doi: 10.1038/nature05911. [DOI] [PMC free article] [PubMed] [Google Scholar]
- 5.Buck MJ, Lieb JD. Genomics. 2004;83(3):349–360. doi: 10.1016/j.ygeno.2003.11.004. [DOI] [PubMed] [Google Scholar]
- 6.Warren CL, Kratochvil NC, Hauschild KE, Foister S, Brezinski ML, Dervan PB, Phillips GN, Ansari AZ. Proceedings of the National Academy of Sciences of the United States of America. 2006;103(4):867–872. doi: 10.1073/pnas.0509843102. [DOI] [PMC free article] [PubMed] [Google Scholar]
- 7.Schena M, Shalon D, Davis RW, Brown PO. Science. 1995;270(5235):467–470. doi: 10.1126/science.270.5235.467. [DOI] [PubMed] [Google Scholar]
- 8.Brockman JM, Frutos AG, Corn RM. Journal of the American Chemical Society. 1999;121(35):8044–8051. [Google Scholar]
- 9.Salisbury CM, Maly DJ, Ellman JA. Journal of the American Chemical Society. 2002;124(50):14868–14870. doi: 10.1021/ja027477q. [DOI] [PubMed] [Google Scholar]
- 10.Smith EA, Thomas WD, Kiessling LL, Corn RM. Journal of the American Chemical Society. 2003;125(20):6140–6148. doi: 10.1021/ja034165u. [DOI] [PubMed] [Google Scholar]
- 11.Drummond TG, Hill MG, Barton JK. Nature Biotechnology. 2003;21(10):1192–1199. doi: 10.1038/nbt873. [DOI] [PubMed] [Google Scholar]
- 12.Mouradian S, Nelson CM, Smith LM. Journal of the American Chemical Society. 1996;118(36):8639–8645. [Google Scholar]
- 13.Su J, Mrksich M. Angewandte Chemie-International Edition. 2002;41(24):4715–4718. doi: 10.1002/anie.200290026. [DOI] [PubMed] [Google Scholar]
- 14.Rogers YH, Jiang-Baucom P, Huang ZJ, Bogdanov V, Anderson S, Boyce-Jacino MT. Analytical Biochemistry. 1999;266(1):23–30. doi: 10.1006/abio.1998.2857. [DOI] [PubMed] [Google Scholar]
- 15.Singh-Gasson S, Green RD, Yue YJ, Nelson C, Blattner F, Sussman MR, Cerrina F. Nature Biotechnology. 1999;17(10):974–978. doi: 10.1038/13664. [DOI] [PubMed] [Google Scholar]
- 16.Strother T, Hamers RJ, Smith LM. Nucleic Acids Research. 2000;28(18):3535–3541. doi: 10.1093/nar/28.18.3535. [DOI] [PMC free article] [PubMed] [Google Scholar]
- 17.Strother T, Cai W, Zhao XS, Hamers RJ, Smith LM. Journal of the American Chemical Society. 2000;122(6):1205–1209. [Google Scholar]
- 18.Tengvall P, Jansson E, Askendal A, Thomsen P, Gretzer C. Colloids and Surfaces B-Biointerfaces. 2003;28(4):261–272. [Google Scholar]
- 19.Strother T, Knickerbocker T, Russell JN, Butler JE, Smith LM, Hamers RJ. Langmuir. 2002;18(4):968–971. [Google Scholar]
- 20.Yang WS, Auciello O, Butler JE, Cai W, Carlisle JA, Gerbi J, Gruen DM, Knickerbocker T, Lasseter TL, Russell JN, Smith LM, Hamers RJ. Nature Materials. 2003;2(1):63–63. doi: 10.1038/nmat779. [DOI] [PubMed] [Google Scholar]
- 21.Knickerbocker T, Strother T, Schwartz MP, Russell JN, Butler J, Smith LM, Hamers RJ. Langmuir. 2003;19(6):1938–1942. [Google Scholar]
- 22.Sun B, Colavita PE, Kim H, Lockett M, Marcus MS, Smith LM, Hamers RJ. Langmuir. 2006;22(23):9598–9605. doi: 10.1021/la061749b. [DOI] [PubMed] [Google Scholar]
- 23.Peelen D, Smith LM. Langmuir. 2005;21(1):266–271. doi: 10.1021/la048166r. [DOI] [PubMed] [Google Scholar]
- 24.Smith EA, Wanat MJ, Cheng YF, Barreira SVP, Frutos AG, Corn RM. Langmuir. 2001;17(8):2502–2507. [Google Scholar]
- 25.Huang E, Zhou FM, Deng L. Langmuir. 2000;16(7):3272–3280. [Google Scholar]
- 26.Chapman RG, Ostuni E, Yan L, Whitesides GM. Langmuir. 2000;16(17):6927–6936. [Google Scholar]
- 27.Herne TM, Tarlov MJ. Journal of the American Chemical Society. 1997;119(38):8916–8920. [Google Scholar]
- 28.Bain CD, Troughton EB, Tao YT, Evall J, Whitesides GM, Nuzzo RG. Journal of the American Chemical Society. 1989;111(1):321–335. [Google Scholar]
- 29.Jordan CE, Frey BL, Kornguth S, Corn RM. Langmuir. 1994;10(10):3642–3648. [Google Scholar]
- 30.Lu MC, Hall JG, Shortreed MR, Wang LM, Berggren WT, Stevens PW, Kelso DM, Lyamichev V, Neri B, Skinner JL, Smith LM. Journal of the American Chemical Society. 2002;124(27):7924–7931. doi: 10.1021/ja012082c. [DOI] [PubMed] [Google Scholar]
- 31.Frey BL, Corn RM. Analytical Chemistry. 1996;68(18):3187–3193. [Google Scholar]
- 32.Zheng T, Peelen D, Smith LM. Journal of the American Chemical Society. 2005;127(28):9982–9983. doi: 10.1021/ja0505550. [DOI] [PubMed] [Google Scholar]
- 33.Houseman BT, Gawalt ES, Mrksich M. Langmuir. 2003;19(5):1522–1531. [Google Scholar]
- 34.Peelen D, Kodoyianni V, Lee J, Zheng T, Shortreed MR, Smith LM. Journal of Proteome Research. 2006;5(7):1580–1585. doi: 10.1021/pr050467e. [DOI] [PMC free article] [PubMed] [Google Scholar]
- 35.Tournier EJM, Wallach J, Blond P. Analytica Chimica Acta. 1998;361(1–2):33–44. [Google Scholar]
- 36.Dordi B, Schonherr H, Vancso GJ. Langmuir. 2003;19(14):5780–5786. [Google Scholar]
- 37.Smalyukh II, Zribi OV, Butler JC, Lavrentovich OD, Wong GCL. Physical Review Letters. 2006;96(17) doi: 10.1103/PhysRevLett.96.177801. [DOI] [PubMed] [Google Scholar]
- 38.Penke B, Balaspiri L, Pallai P, Kovacs K. Acta Physica Et Chemica. 1974;20(4):471–476. [Google Scholar]
- 39.Kisfalud L, Roberts JE, Johnson RH, Mayers GL, Kovacs J. Journal of Organic Chemistry. 1970;35(10):3563. doi: 10.1021/jo00835a086. [DOI] [PubMed] [Google Scholar]
- 40.Kovacs J, Kisfalud L, Ceprini MQ. Journal of the American Chemical Society. 1967;89(1):183. doi: 10.1021/ja00977a059. [DOI] [PubMed] [Google Scholar]
- 41.Ohrt T, Merkle D, Birkenfeld K, Echeverri CJ, Schwille P. Nucleic Acids Research. 2006;34(5):1369–1380. doi: 10.1093/nar/gkl001. [DOI] [PMC free article] [PubMed] [Google Scholar]
- 42.Wang DY, Visser NV, Veenhuis M, van der Klei IJ. Journal of Biological Chemistry. 2003;278(44):43340–43345. doi: 10.1074/jbc.M307789200. [DOI] [PubMed] [Google Scholar]
- 43.Lee J, Didier DN, Lockett MR, Scalf M, Greene AS, Olivier M, Smith LM. Analytical Biochemistry. 2007;369(2):241–247. doi: 10.1016/j.ab.2007.06.010. [DOI] [PMC free article] [PubMed] [Google Scholar]
- 44.Barner BJ, Green MJ, Saez EI, Corn RM. Analytical Chemistry. 1991;63:55–60. [Google Scholar]
- 45.Frey BL, Corn RM, Weibel SC. Sampling Techniques. Vol. 2 J. Wiley and Sons; New York: 2002. [Google Scholar]
- 46.Lee S, Shon YS, Colorado R, Guenard RL, Lee TR, Perry SS. Langmuir. 2000;16(5):2220–2224. [Google Scholar]
- 47.Shon YS, Colorado R, Williams CT, Bain CD, Lee TR. Langmuir. 2000;16(2):541–548. [Google Scholar]
- 48.Lu MC, Shortreed MR, Hall JG, Wang LM, Berggren T, Stevens PW, Kelso DM, Lyamichev V, Neri B, Smith LM. Human Mutation. 2002;19(4):416–422. doi: 10.1002/humu.10071. [DOI] [PubMed] [Google Scholar]
- 49.Lockett MR, Shortreed MR, Smith LM. Analytical Chemistry. 2007;79(15):6031–6036. doi: 10.1021/ac070424c. [DOI] [PubMed] [Google Scholar]
- 50.Data Not Shown
- 51.These calculations were made assuming there is a 10mm spacing between each feature.
- 52.Tournier EJM, Wallach J, Blond P. Analytica Chimica Acta. 1998;361:33. [Google Scholar]