

Abstract
Various mechanisms have been proposed for the initial O2 attack in intradiol dioxygenases based on different electronic descriptions of the enzyme-substrate (ES) complex. We have examined the geometric and electronic structure of the high spin ferric ES complex of protocatechuate 3,4-dioxygenase (3,4-PCD) with UV/Visible absorption, circular dichroism (CD), magnetic CD (MCD), and variable-temperature variable-field (VTVH) MCD spectroscopies. The experimental data were coupled with DFT and INDO/S-CI calculations and an experimentally-calibrated bonding description was obtained. The broad absorption spectrum for the ES complex in the 6000 – 31000 cm−1 region was resolved into at least 5 individual transitions assigned as LMCT from the PCA (protocatechuate) substrate and Tyr408. From our DFT calculations, all five LMCT transitions originate from the PCA and Tyr πop orbitals to the ferric dπ orbitals. The strong π covalent donor interactions dominate the bonding in the ES complex. Using hypothetical Ga3+-catecholate/semiquinone complexes as references, 3,4-PCD-PCA was found to be best described as a highly covalent Fe3+-catecholate complex. The covalency is distributed unevenly among the four PCA valence orbitals with the strongest interaction between the πop-sym and Fe dxz orbitals. This strong π interaction, as reflected in the lowest energy PCA to Fe3+ LMCT transition, is responsible for substrate activation for the O2 reaction of intradiol dioxygenases. This involves a multi-electron transfer (one β and two α) mechanism with Fe3+ acting as a buffer for the spin-forbidden two-electron redox process between PCA and O2 in the formation of the peroxy- bridged ESO2 intermediate. The Fe ligand field overcomes the spin-forbidden nature of the triplet O2 reaction and potentially results in an intermediate spin state (S = 3/2) on the Fe3+ center which is stabilized by a change in coordination along the reaction coordinate.
1. Introduction
Like heme-containing enzymes, mononuclear non-heme iron-containing enzymes perform a wide range of important biological functions1–5, but their reaction mechanisms are generally less well understood. This is true in part because the non-heme enzymes lack the convenient spectroscopic probe provided by the intense porphyrin π→ π* absorption features of heme enzymes. In recent years, significant progress has been made in understanding the geometric and electronic structures of the active sites of mononuclear non-heme iron enzymes and their contributions to molecular mechanisms.4–6 A good example of this is found in the non-heme oxygenase family which uses the active site metal to activate O2 for reaction with organic substrates. Although the uncatalyzed reactions of triplet O2 with singlet organic substrates are thermodynamically favorable, they are very slow because they are spin forbidden. Activation of O2 via reduction is also slow due to the low one-electron reduction potential of O2. Most non-heme oxygenases catalyze O2 activation using a high spin Fe2+ site through a redox process that also involves the substrate or an additional cofactor to provide the required number electrons. These include extradiol dioxygenases, pterin-dependent hydroxylases, α-ketoglutarate-dependent enzymes and Rieske dioxygenases. In contrast, a small group of the non-heme iron-containing enzymes employ a high spin Fe3+ site to activate substrate for direct attack by O2. The primary examples of this type of enzyme are the lipoxygenases and intradiol dioxygenases, which is the enzyme class of interest in this paper.
Intradiol dioxygenases belong to a large class of enzymes called catecholic dioxygenases.3 These widely distributed enzymes catalyze the cleavage of molecular oxygen accompanied by insertion of both oxygen atoms into the aromatic ring of the substrate, resulting in ring cleavage. The bacterial catecholic dioxygenases are important in the aerobic biodegradation of aromatic compounds, including the recalcitrant pollutant polychlorinated biphenyls (PCBs).7–10 The catecholic dioxygenases fall into two structurally and mechanistically distinct classes termed extradiol and intradiol. While extradiol dioxygenases utilize an Fe2+ (and occasionally Mn2+)11–13 center to cleave the ring on either the distal or proximal side of the vicinal hydroxyl groups of the substrate, intradiol dioxygenases employ an Fe3+ center to catalyze the cleavage of the aromatic ring between the hydroxylated carbon atoms.3–5,14,15
Protocatechuate 3,4-dioxygenase (3,4-PCD, EC 1.13.11.3) is one of the most extensively studied intradiol dioxygenases. It catalyzes the ring cleavage of protocatechuate (PCA: 3,4-dihydroxybenzoate) to form β-carboxy-cis,cis-muconate with the incorporation of both oxygen atoms from molecular oxygen.16 (Scheme 1) X-ray crystal structures are available for the resting form and various mutants, as well as in a number of ligand complexes with substrate, substrate analogs, inhibitors and oxygen analogues of 3,4-PCD isolated from Pseudomonas aeruginosa (now reclassified as putida), and Acinetobacter calcoaceticus ADP1.17–22 The enzyme has also been isolated and spectroscopically characterized from Brevibacterium fuscum23 which has the most highly resolved spectroscopic features of any intradiol dioxygenase. Crystallographic and X-ray absorption (XAS)24,25 data show that the resting state of 3,4-PCD contains a high spin ferric center in a distorted trigonal bipyramidal geometry, with Tyr447 and His462 as the axial ligands and Tyr408, His460 and a hydroxide ligand defining the equatorial plane (residue numbering from the P. putida enzyme). Upon anaerobic substrate binding, the active site shifts to a square pyramidal geometry, the axial Tyr447 and equatorial OH− are displaced by the substrate which binds bidentate in its doubly-deprotonated form.26 The open coordination position is trans to His460 and the substrate binds asymmetric to the Fe3+ center with the longer bond trans to the equatorial Tyr408.20
Scheme 1.
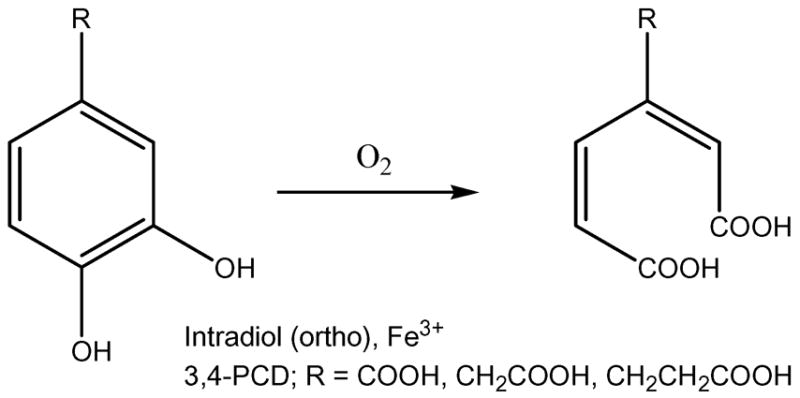
Intradiol cleavage of PCA by 3,4-PCD
The catalytic reaction mechanism of 3,4-PCD shows a sequential order, with PCA binding before dioxygen. Based on a series of experimental data on the substrate- and inhibitor-bound 3,4-PCD complexes as well as the intermediates observed during the substrate and inhibitor binding step,19,20,27,28 it has been proposed that PCA initially binds monodentate with the deprotonated 4-OH of PCA. Through ligand rearrangement, PCAO4 shifts to the axial position trans to His462, displaces Tyr447 which assists in the deprotonation of the 3-OH and allows PCAO3 to bind to the Fe3+ site in the equatorial plane trans to Tyr408. (Scheme 2)
Scheme 2.

Proposed mechanism for 3,4-PCD
Based on different electronic descriptions of the enzyme-substrate (ES) complex, various mechanisms have been proposed for the substrate activation step of the initial O2 attack in the enzymatic reaction: 1) Fe2+-semiquinone with O2 attacking the iron site, 2) Fe2+-semiquinone with O2 attacking the substrate through radical coupling, 3) Fe3+-catecholate with strong ketonized-character promoted by lengthening the Fe-PCAO bond from the trans effect from Tyr408 and the O2 interacts directly with the substrate through electrophilic attack.29–35 (Scheme 2) No matter which mechanism is adopted, the net result of the O2 attack is thought to be the formation of a peroxy-adduct between the iron site and one of the hydroxylated carbons accompanied by a spin-forbidden 2-electron transfer from the electron pair of the substrate to the triplet O2 molecule. Since the differences among the mechanistic proposals lie in the electronic structure description of the enzyme-substrate (ES), it is important to determine the nature of this ES complex, particularly its degree of radical character. This would allow elucidation of the mechanism of substrate activation and define how the intradiol dioxygenases overcome the spin forbiddeness of the O2 ring-opening reaction.
Some insight into the electronic structure of the ES complex has been derived from previous spectroscopic studies. All EPR and Mössbauer studies have shown that that 3,4-PCD remains high spin ferric upon substrate binding.23,25,36 Substrate-free 3,4-PCD has an intensive absorption feature at 460 nm characteristic of a tyrosine to Fe3+ charge transfer (CT) transition.16 This has been studied in detail in Ref 37. Upon anaerobic substrate binding, a new broad low energy feature appears at ~ 600 nm and Raman excitation into this new band indicates that it arises from catecholate to Fe3+ CT.17,38 This low energy catecholate to Fe3+ CT suggests covalency in the ES complex can be key to the substrate activation mechanism. The presence of two non-innocent ligands (Tyr408 and substrate) in the ES complex results in a broad absorption envelope with a series of overlapping LMCT transitions. In this study, we employ UV/Visible absorption (UV/VIS Abs), circular dichroism (CD), low-temperature magnetic CD (MCD) along with variable-temperature variable-field MCD (VTVH MCD) to resolve individual bands in the broad absorption spectrum. The experimental data were coupled with density functional theory (DFT) and INDO/S-CI calculations to determine the electronic structure of the ES complex of 3,4-PCD and to correlate it with the geometric structure. The frontier molecular orbitals involved in substrate activation in intradiol dioxygenases were identified and provide insight into the 2-electron spin-forbidden reaction between O2 and the catecholic substrate.
2. Experimental Section
2.1 Sample preparation
All commercial reagents were of highest grade available and used without further purification unless otherwise specified. Protocatechuate 3,4-dioxygenase from Brevibacterium fuscum was purified as previously reported, stored at −80°C and thawed immediately prior to use.23,39 The Abs and CD spectra and other selected comparisons of 3,4-PCD isolated from P. putida and B. fuscum were identical in both the oxidized and the reduced forms.24,40 Therefore, it is reasonable to compare the spectroscopic results on B. fuscum 3,4-PCD (which exhibits the most well-resolved features) to the crystal structures of P. putida 3,4-PCD. The 100 mM MOPS buffer (3-[N-morpholino]propane-sulfonic acid, Sigma) was prepared with deionized water and adjusted to pH 7.0 with NaOH (Sigma). Protocatechuic acid (PCA, 3,4-dihydroxybenzoic acid, Aldrich) and homoprotocatechuic acid (HPCA, 3,4-dihydroxyphenylacetic acid, Aldrich) were purified by sublimation, with the samples being heated under vacuum in a flask equipped with a coldfinger cooled by dry ice. Once purified, these were stored under N2 in the dark.
All samples were prepared under an inert atmosphere in an Mbraun Labmaster 100 glovebox maintained at less than 1 ppm O2. The protein was rigorously degassed at 4°C in a Teflon-stoppered glass vial by evacuating and back-filling 20 times with Ar that had been passed over a copper catalyst (BASF) to remove residual O2. Buffers were degassed under vacuum by freeze/pump/thaw/heat procedures. The catecholic substrates were weighed in small glass vials, transferred to the glovebox, and dissolved in MOPS buffer. Enzyme-substrate samples were prepared by adding a small aliquot of substrate solution anaerobically to the protein to give 15-fold excess substrate and incubated for 15 minutes. For the MCD experiments, 50% (v/v) glycerol, degassed under vacuum by freeze/pump/thaw/heat procedures, was added as a glassing agent. CD and Abs spectra were taken with and without glycerol present to ensure that the protein was unaffected by the glassing agent. MOPS buffer was prepared in D2O (99.9 atom % D; Cambridge Isotope Laboratories) and adjusted to a pD of 6.6. NaOD (Sigma) and glycerol-d3 (98 atom % D; Cambridge Isotope Laboratories) were used to eliminate the hydroxide overtones that dominate the IR absorption spectrum above 1600 nm.
2.2 Spectroscopic Studies
UV/VIS Abs spectra were recorded on an HP8452A diode array spectrometer at room temperature and on a Cary 17 spectrometer equipped with a Janis Research Super Vari-temp helium cryogenic Dewar mounted in the light path at 5K. CD and MCD data were collected on CD spectropolarimeters with modified sample compartments to accommodate magnetocryostats. The near IR-data were collected on a Jasco J-200D with liquid N2-cooled InSb detector coupled to an Oxford Instruments SM4000-7T magnetocryostat. The UV/VIS data were collected either on a Jasco J-500C coupled to an Oxford Instruments SM4-7T magnetocryostat or a Jasco J-810 coupled to an Oxford Instruments SM4000-8T magnetocryostat. Both UV/VIS spectropolarimeters are equipped with extended S-20/S-1 photomultiplier tubes (Hamamatsu).
Room temperature Abs and CD samples were prepared in a 0.5 cm path length quartz anaerobic cuvette and kept at 4°C at all times with a circulating cooling bath attached to the sample holder. Buffer and cell baselines were subtracted from the raw protein Abs and CD spectra. Low temperature (1.6 – 50.2 K) Abs and MCD spectra were obtained in a copper MCD sample cell with two Infrasil quartz disks sandwiching a 3 mm thick neoprene O-ring spacer into which the sample was injected. The samples were frozen in liquid N2 immediately after preparation. The depolarization of the frozen sample was checked by measuring the CD spectrum of a nickel (+)-tartrate solution placed before and after the sample and was less than 5%.41
The MCD spectra were corrected for the natural CD and zero-field baseline effects caused by glass strain by subtracting the 0 T scans from each of the field scans at a given temperature. The Abs, CD, and MCD spectra were iteratively fit to Gaussian band shapes by using a modified Levenberg-Marquardt constrained least-squares fitting routine. For VTVH MCD spectroscopy, a calibrated Cernox resistor (Lakeshore Cryotronics, calibrated 1.5 – 300 K) inserted in the sample cell was used to accurately measure the temperature of the sample. VTVH data were normalized to the maximum observed intensity and were analyzed using the theory and associated fitting program developed in Ref 42.
2.3 Electronic Structure Calculations
A. Active Site Geometry
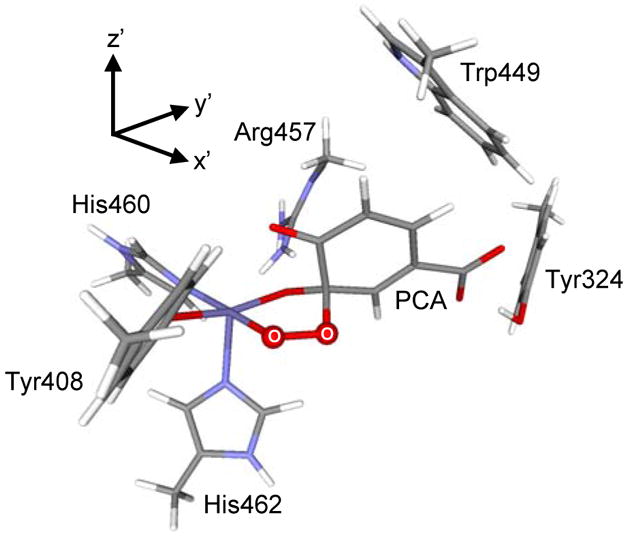
The active site geometric structures of 3,4-PCD-PCA and 3,4-PCD-HPCA were obtained from the averaged crystallographic coordinates of P. putida 3,4-PCD complexed with PCA (PDB ID: 3PCA) and HPCA (PDB ID: 3PCN), respectively.17,20 Hydrogen atoms were placed at standard bond lengths and angles. DFT calculations were performed on a model of 3,4-PCD-PCA with two Me-imidazoles to model His460 and His462, 4-Me-phenolate to model Tyr408 and a bidentate PCA in the fully deprotonated state. 2nd sphere residues which interact with the substrate, Arg457, Tyr324, and Trp449, were also modeled in as methyl-guanidium ion, 4-Me-phenolate and 3-Me-indole respectively. Semiempirical calculations were performed on the 3,4-PCD-HPCA complex with a simpler model: two imidazoles to model the two histidines, phenolate to model the tyrosine residue and a dianionic HPCA.
B. DFT Calculations
Spin unrestricted DFT calculations were performed using Gaussian 0343 to geometry optimize the 102-atom active model described above. The double-ζ LanL2DZ basis set was used in all geometry optimizations with two commonly-used functionals: Becke’s 1988 exchange functional with the correlation function of Perdew (BP86)44,45 as well as Becke’s three-parameter hybrid functional with the correlation function of Lee, Yang, and Parr (B3LYP)46–48. The 102-atom model was partially optimized with the coordinates of the β-carbon of the backbone and all heavy atoms in the 2nd sphere residues held constant to simulate the protein pocket. Frequencies and thermodynamic parameters were calculated and all frequencies were found to be real except where constraints were imposed. The charges were calculated using Natural Population Analysis (NPA).49 Solvation effects were included using the Polarized Continuum Model (PCM)50 with a dielectric constant ε = 4.0 to model the protein environment. In all calculations, convergence was reached when the relative change in the density matrix between subsequent iterations was less than 1 × 10⁻⁸.
To correlate calculations to experimental excited-state data, time-dependent (TD) DFT calculations51–53 were carried out for the geometry-optimized model in Gaussian 03. The two 2nd sphere residues which interact with the tail of the substrate were removed to minimize computational time. In order to cover the entire energy range of interest, 150 excitations were calculated. Excitation energies for the same model were also calculated with the Slater transition method54,55 in the Amsterdam density functional (ADF 2004) program developed by Baerends et al.56–58 The local density approximation (LDA) of Vosko and co-workers59 was used along with gradient corrections of Becke for the exchange and of Perdew for the correlation (BP86). The calculations were spin-polarized and the basis set used for all atoms was an uncontracted triple-ζ basis set (TZP) with a single polarization function without any frozen core approximation. This program does not provide an option to generate hybrid functionals. Hence, in order to experimentally evaluate the calculations, spin-unrestricted single point calculations for the model optimized in Gaussian 03 were performed using the ADF package and the nuclear charge on Fe (ZFe) was varied from 26 to 25.8. The ground state wave functions were used as initial guesses to obtain excited state wave functions, where half an electron was transferred from an occupied to an unoccupied orbital. Excitation energies were calculated as differences between the two partially-occupied orbitals. Calculations were accepted as converged when the relative change in the density matrix between subsequent iterations was less than 10−5. Solvent effects were included using the Conductor like Screening Model (COSMO)60–62 and the protein environment was modeled using a dielectric constant ε = 4.0. Spin densities obtained from the experimentally-calibrated calculation in ADF were then matched in Gaussian 03 with various amounts of Hartree-Fock (HF) exchange mixing into the BP86 functional. Molecular orbitals obtained from both Gaussian 03 and ADF calculations were analyzed using the AOMix program63,64 and the graphical output of the computational results was generated with Molden (Gaussian) and gOpenMol (ADF).
3. Results and Analysis
3.1 Absorption, CD and Low-Temperature MCD Spectroscopy
Abs, CD, and low-temperature MCD spectra for 3,4-PCD-HPCA and 3,4-PCD-PCA are shown in Figures 1 and 2. CD spectra taken with and without the glassing agent glycerol present were found to be unchanged. The Gaussian resolution obtained by simultaneously fitting the Abs, CD, and MCD data of 3,4-PCD-HPCA indicate the presence of at least five transitions in the 6000 – 31000 cm−1 region (Figure 1). All the observed transitions are assigned as LMCT as all d → d transitions are spin-forbidden in this high spin d5 system. The energies, Abs ε, and MCD Δε are given in Table 1. VTVH data were collected for bands 1–5. It is important to note the presence of both positive and negative bands in the MCD spectrum as this is an indication of pseudo A-term behavior. Similar to 3,4-PCD-HPCA, the Gaussian resolution of Abs, CD, and MCD data of 3,4-PCD-PCA indicate the presence of at least five transitions in the 6000 – 31000 cm−1 region (Figure 2). The energies, Abs ε, and MCD Δε are also shown in Table 1. VTVH data were collected for bands 1, 3, 4, and 5. No VTVH data were collected for negative band 2 due to its low intensity which can be attributed to partial cancellation effect from two adjacent overlapping intense positive bands. Again, MCD signals of alternating signs are observed, indicating pseudo A-term behavior among the LMCT transitions. While there are slight shifts in band energies and signal intensities, the spectroscopic data for 3,4-PCD-HPCA and 3,4-PCD-PCA look extremely similar. This indicates that the presence of an extra carbon in the carboxylate tail of the substrate induces only a minimal effect on the Fe center.
Figure 1.
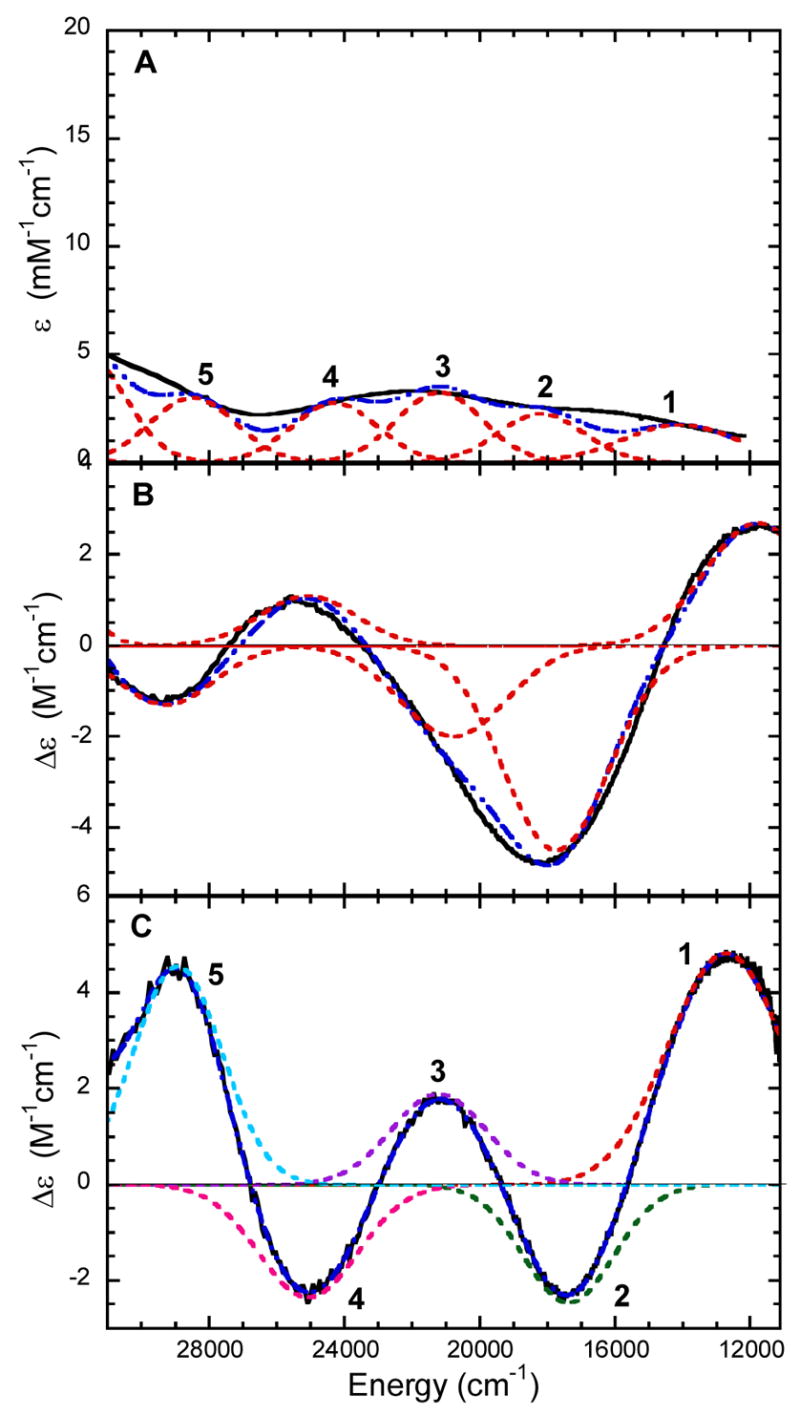
Gaussian resolution (----) of spectra (—) of 3,4-PCD-HPCA. (A) Abs at 4°C, (B) CD at 4°C, and MCD at 5K and 1T.
Figure 2.
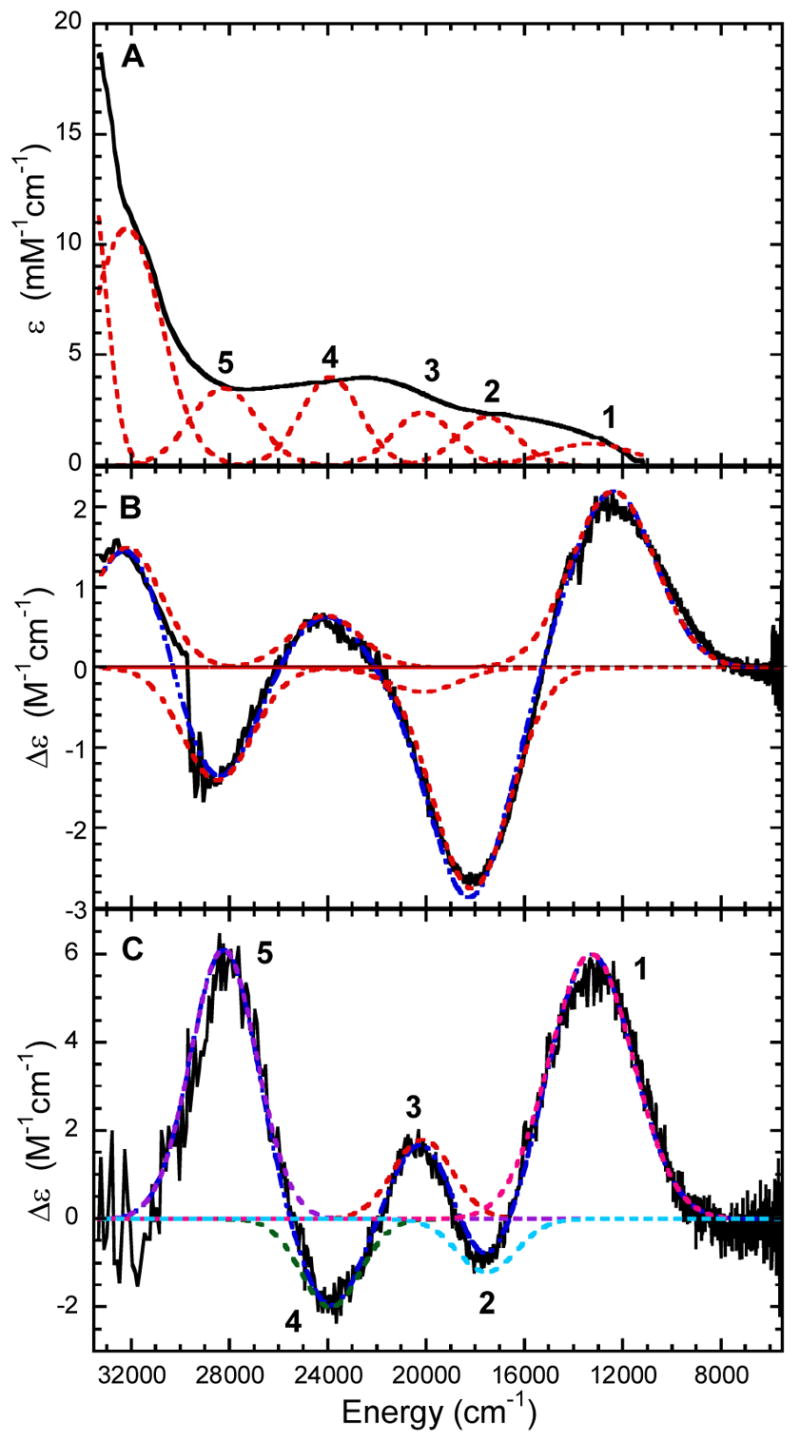
Gaussian resolution (----) of spectra (—) of 3,4-PCD-PCA. (A) Abs at 4°C, (B) CD at 4°C, and MCD at 5K and 1T.
Table 1.
Gaussian resolution and experimental parameters for the observed transitions of 3,4-PCD-HPCA and 3,4-PCD-PCA
| Band | Abs Energy (cm−1) | ε (mM−1cm−1) | MCD Energy (cm−1) | Δε (M−1cm−1) | |
|---|---|---|---|---|---|
| 3,4-PCD-HPCA | 1 | 14100 | 1.8 | 12700 | 4.83 |
| 2 | 18200 | 2.3 | 17400 | −2.46 | |
| 3 | 21200 | 3.3 | 21200 | 1.89 | |
| 4 | 24300 | 2.8 | 25100 | −2.34 | |
| 5 | 28500 | 3.0 | 28900 | 4.56 | |
|
| |||||
| 3,4-PCD-PCA | 1 | 13300 | 1.0 | 13400 | 5.97 |
| 2 | 17550 | 2.2 | 17600 | −1.20 | |
| 3 | 20150 | 2.4 | 20200 | 1.78 | |
| 4 | 23900 | 4.0 | 24000 | −1.94 | |
| 5 | 28250 | 3.5 | 28300 | 6.10 | |
3.2 VTVH MCD Spectroscopy and Orientation of the D-Tensor
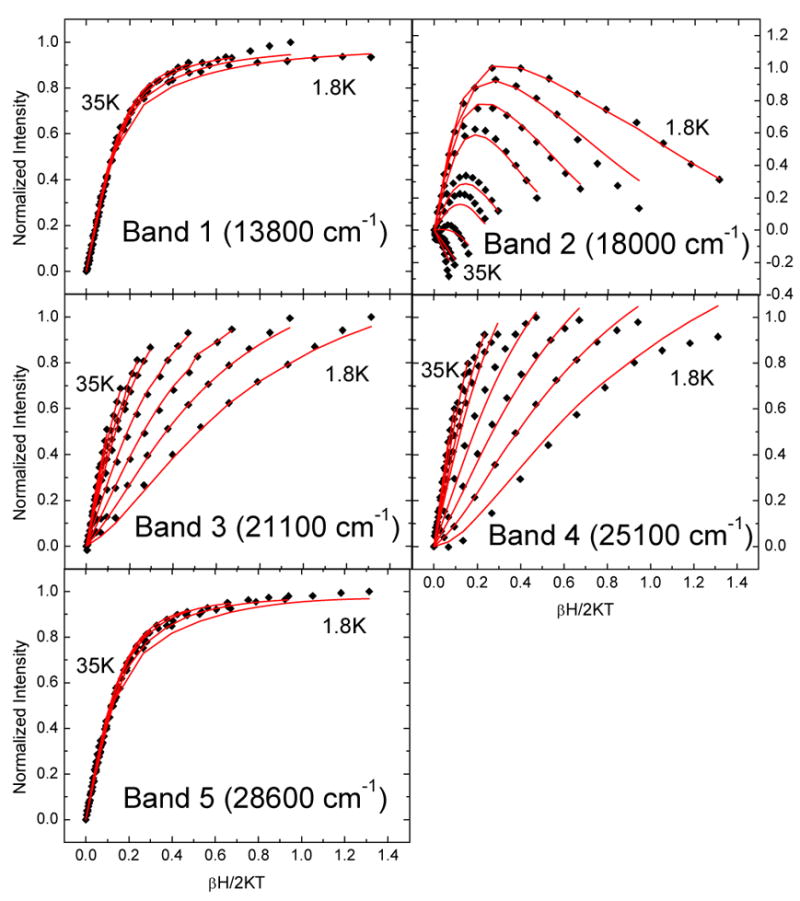
MCD data were collected at various temperatures and fields for four of the LMCT transitions of 3,4-PCD-PCA and five of the LMCT transitions of 3,4-PCD-HPCA. The data were collected at or near the maxima of the Gaussian-resolved bands so as to minimize contributions from overlapping bands. The data were normalized and plotted as a function of βH/2kBT (Figures 3 and 4) where β is the Bohr magneton and kB is the Boltzmann constant. The nesting (i.e. spread) observed for the different isotherms is expected for a Kramers system with zero-field splitting (ZFS) and the features are identified by their temperature dependence as MCD C-terms. Two types of saturation magnetization behavior are observed in the four sets of VTVH MCD data collected on 3,4-PCD-PCA. Bands 1 and 5 have very similar saturation magnetization behavior; the MCD signals saturate quickly and the isotherms have very limited nesting. The saturation magnetization behaviors of bands 3 and 4 are also very similar, the MCD signals do not saturate at 7 T and the isotherms are more nested than those of bands 1 and 5. For 3,4-PCD-HPCA, three types of saturation magnetization behavior are observed in the five sets of VTVH MCD data collected. Bands 1 and 5 have very similar saturation magnetization behavior; MCD signals saturate quickly and the isotherms have very limited nesting. For band 2, each isotherm passes through a maximum with variation in βH/2kBT and significant nesting behavior is observed. For bands 3 and 4, the MCD signals do not saturate at 7 T and the isotherms are more nested than those in bands 1 and 5. It is important to note that the two types of saturation magnetization behavior noted in 3,4-PCD-PCA, namely that of bands 1 and 5, and bands 3 and 4, are very similar to those of the corresponding bands in 3,4-PCD-HPCA.
Figure 3.
VTVH MCD data for 3,4-PCD-HPCA. The fits are shown in red.
Figure 4.
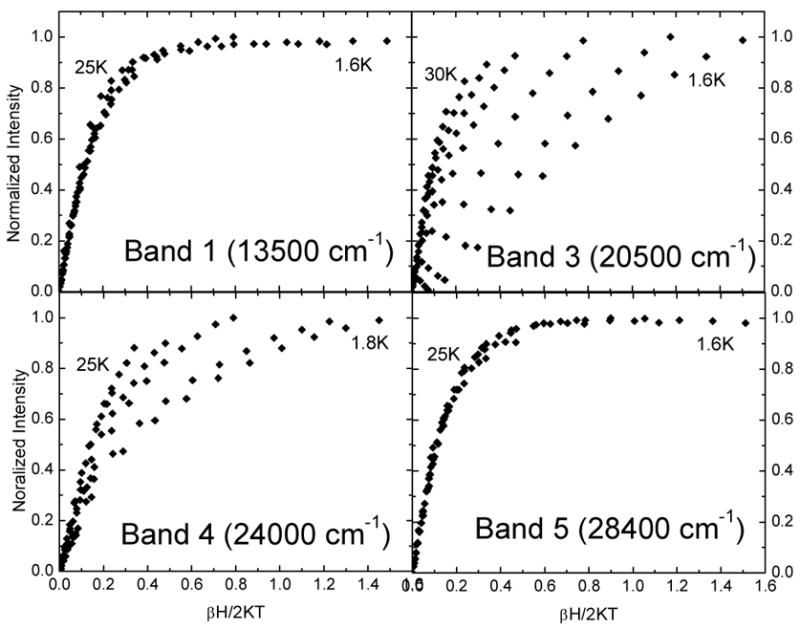
VTVH MCD data for 3,4-PCD-PCA.
VTVH MCD data can be fitted by using a theoretical approach based upon the spin Hamiltonian.42 The model relates the non-linear MCD behavior to both transition polarization and the spin expectation values of the different ZFS sublevels for S ≥ ½ in low-symmetry molecular environments as given below:
| (1) |
where x, y and z refer to the principal axes of the ZFS tensor; θ and φ are the polar angles between the incident light and the molecular z axis; lx, ly and lz are the direction cosines for the magnetic field relative to the molecular coordinate system; are the products of the polarizations of the electronic transitions and γ is a collection of constants. Eqn 1 is also dependent on Ni the Boltzmann population, and 〈Sp〉i, the spin expectation value in the p direction, for the spin sublevels i of the ground state. Two perpendicular transition moments i and j are required for MCD intensity. In a low symmetry protein site, a transition is uni-directional, so is accomplished by spin-orbit mixing with another excited state that has a perpendicularly polarized transition moment. By obtaining the spin-Hamiltonian parameters D, E/D and gp from EPR data (which give the energy and 〈Sp〉 of the different sublevels), the effective transition moment products can be determined from Eqn 1. Using these effective transition moment products, the percent polarization along the ZFS tensor axes for each transition can then be determined with Eqn 2 (with cyclic permutations of indices for the remaining two directions).
| (2) |
Previous EPR studies showed that 3,4-PCD-PCA is composed of a mixture of species with E/D values ranging from the axial limit (0) to the rhombic limit (0.33).23,36 The heterogeneity in ground states complicates spectral analysis as the amount of each species with a specific E/D would be required to fit the VTVH MCD data. EPR studies were also performed on 3,4-PCD-HPCA and the data showed only one dominant species (90%) with E/D = 0.33 and |D| = 1.8 cm−1.65 Due to the clean ground state electronic configuration, VTVH MCD analysis was feasible. As mentioned above, spectral data and saturation magnetization behavior for all CT bands in 3,4-PCD-PCA are qualitatively very similar to that in 3,4-PCD-HPCA. Thus the spectral assignments are expected to be the same for these two complexes.
To analyze the VTVH MCD data for 3,4-PCD-HPCA, the sign of D and E are important for determining polarizations as shown in our previous study in 3,4-PCD.37 In the rhombic limit for a S = 5/2, the effective g-values for the first and third Kramers doublets, g(1)x,y,z and g(3)x,y,z are pairwise identical but with their order interchanged with opposite signs of D. For high spin ferric complexes, the true g-values are isotropic, the g-matrix and D-tensor are collinear and hence, a change in the order of the effective g-values (i.e. the sign of D) leads to an interchange of two of the polarization directions.
INDO/S-CI calculations were performed to determine the sign of the D and E values for 3,4-PCD-HPCA. The D-tensor was mapped onto the coordinates of the 3,4-PCD-HPCA active site by calculating the second-order spin-orbit coupling of the 6A1 ground state over the entire excited-state manifold of 4T1 and 6T1 states as described in Ref 66. By diagonalizing the D-tensor, the principal values Dxx, Dyy, Dzz are determined and the spin-Hamiltonian parameters (D = Dzz − 1/2 (Dxx+Dyy), E = 1/2(Dxx −Dyy)) are calculated. Two structures (A and B) were determined in the 2.4 Å resolution crystallographic studies which differ only in the orientation of the substrate HPCA.17 INDO/S-CI calculations were performed on both structures and the orientation of the D-tensors were found to be similar, with the x-direction oriented along the shorter OHPCA-iron bond, the y-direction along the tyrosinate-iron bond and the z-direction oriented closest to one of the histidine-iron bonds (Figure 5). The spin-Hamiltonian parameters showed only minor differences, with D and E values being positive for both structures (D = + 4.64 cm−1, E/D = +0.32 for Structure A and D = + 2.76 cm−1, E/D = + 0.26 for Structure B).
Figure 5.
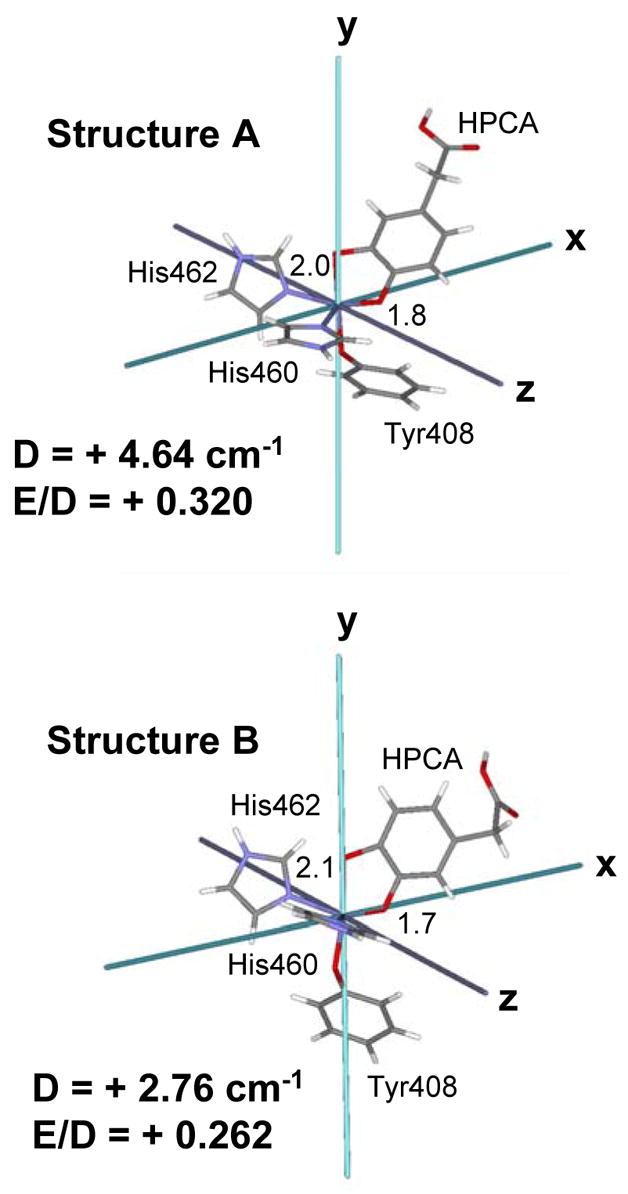
ZFS Tensor for 3,4-PCD-HPCA (Structures A and B). Asymmetric Fe-OHPCA bondlengths in Å are included.
Using the values for |D|, E/D and g determined from EPR and the signs of D and E determined from INDO/S-CI calculations, the values were obtained with Eqn 1 and the percent x, y, and z polarizations, as defined by the principal directions of the D-tensor (Figure 5), of the CT transitions of 3,4-PCD-HPCA were calculated with Eqn 2. The results are given in Table 2. Consistent with the qualitative analysis, bands 1 and 5 have the same polarization, namely 67% and 56% x-polarized respectively. VTVH fitting reveals that band 2 is also x-polarized (72%) and both bands 3 and 4 are y-polarized (93% and 96% respectively). CT transitions are polarized along the associated ligand-metal bond. By mapping the directions of the D-tensor obtained from the INDO/S-CI calculations onto the molecular coordinate frame, polarization information obtained from VTVH MCD analysis can be interpreted in terms of a specific ligand-metal bond. With the OHPCA-iron bond oriented along the x-direction and tyrosinate-iron bond along the y-direction, bands 1, 2 and 5 are assigned as OHPCA-iron LMCT and bands 3 and 4 are assigned as tyrosinate-iron LMCT. This assignment is consistent with previous resonance Raman data17 which showed that band 2 arises from HPCA and band 3 is assigned with the tyrosinate ligand. Due to the similarity of the spectroscopic data between 3,4-PCD-PCA and 3,4-PCD-HPCA, the same assignment can be applied to 3,4-PCD-PCA complex and hence, bands 1, 2 and 5 are assigned as OPCA-iron LMCT and bands 3 and 4 are tyrosinate-iron LMCT transitions.67
Table 2.
Effective transition moments and percent polarization from the VTVH MCD data of 3,4-PCD-HPCA
| Band | Mxy | Mxz | Myz | % x | % y | % z |
|---|---|---|---|---|---|---|
| 1 | 0.54 | 1.06 | 0.33 | 66.5 | 6.6 | 26.9 |
| 2 | −4.94 | 1.75 | 1.04 | 71.6 | 25.3 | 3.2 |
| 3 | 0.68 | −0.18 | 2.01 | 0.7 | 92.8 | 6.5 |
| 4 | −2.09 | 0.25 | −1.48 | 2.9 | 95.7 | 1.4 |
| 5 | 0.47 | 0.97 | 0.37 | 56.1 | 8.3 | 35.6 |
3.3 Electronic Structure Calculations
DFT calculations were performed on the active site of 3,4-PCD-PCA to gain insight into the electronic structure of this ES complex. The results were correlated to the spectroscopic data and the origin of the derivative-shaped sign-changes throughout the MCD spectrum (pseudo-A terms) was investigated.
A. Geometry Optimization of the 3,4-PCD-PCA Complex
The crystal structure of 3,4-PCD-PCA was truncated to the 102-atom model which consists of both 1st and 2nd coordination-sphere residues of the active site. Attempts in geometry optimizing the ES complex by including only the 1st coordination-sphere residues failed to reproduce the unique substrate geometry as observed in the crystal structure. The 2nd sphere residues included interact with the substrate through either hydrogen-bonding or steric interactions, which are very likely to affect the geometry of the substrate. This model was geometry optimized with BP86 and B3LYP using LanL2DZ as the basis set and the results along with existing crystallographic20 data were summarized in Table 3. Good agreement with the crystal structure was found with both functionals, except that the Fe-O3PCA bond lengths were underestimated in both cases. The 2.2 Å resolution crystallographic data showed clear evidence of inequivalent Fe-OPCA bonds with PCA in a non-planar conformation. While both functionals reproduced the folded geometry of PCA, significant inequivalence in the Fe-OPCA bonds was only found in the calculation with BP86 (0.15Å in BP86 vs 0.03Å in B3LYP).68 Hence, further investigation on the electronic structure of the ES complex was performed on the geometry optimized with the BP86 functional. (Figure 6)
Table 3.
Experimental and calculated geometric parameters of the 3,4-PCD-PCA complex
| Parameters | xtal structure | BP86 | B3LYP |
|---|---|---|---|
| Fe-O3PCA (Å) | 2.49 | 2.15 | 2.13 |
| Fe-O4PCA (Å) | 2.04 | 2.00 | 2.10 |
| Fe-OTyr408 (Å) | 1.94 | 1.90 | 1.90 |
| Fe-NHis462 (Å) | 2.19 | 2.16 | 2.17 |
| Fe-NHis460 (Å) | 2.21 | 2.11 | 2.14 |
| O3-C3PCA (Å) | 1.36 | 1.40 | 1.36 |
| O4-C4PCA (Å) | 1.39 | 1.36 | 1.33 |
Figure 6.
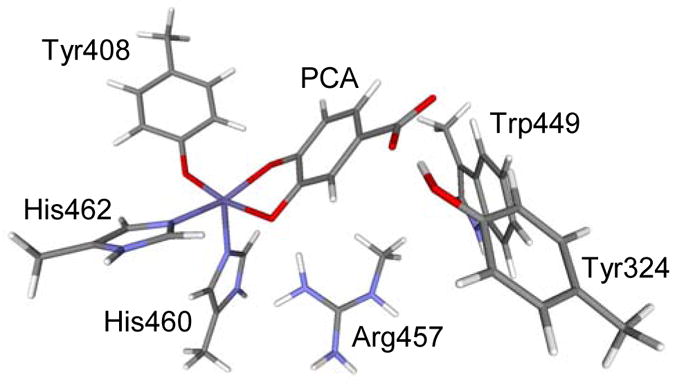
Geometry optimized model of the 3,4-PCD-PCA active site obtained with Gaussian BP86 and LanL2DZ as basis set.
B. Electronic Structure of ES Complex
The ground-state orbital energies and one electron wave functions obtained with the experimentally-calibrated DFT protocol (ADF: BP86/TZP with Fe ZFe = 25.8 and ε = 4.0, vide infra) on the model optimized with BP86 and LanL2DZ in Gaussian were summarized in Table 4.69 The D-tensor principal axes obtained from INDO/S-CI calculations are chosen as the coordinate system for all DFT calculations, with the x-direction oriented along the shorter OHPCA-iron bond, the y-direction along the tyrosinate-iron bond, and the z-direction oriented closest to one of the histidine-iron bonds which is approximately along the axial direction of the square pyramidal structure.
Table 4.
Compositions of the spin-down MOs for the ground state wave function of the ES Complex. Geometry optimized with BP86/LanL2DZ in Gaussian and wave function obtained with ADF BP86 with ZFe = 25.8 and ε = 4.0 (COSMO)
| MO # | Energy (eV) | Label | % Fe d | % Tyr
|
% PCA
|
||||||
|---|---|---|---|---|---|---|---|---|---|---|---|
| πop | πip | total | πop-sym | πop-asym | πip-sym | πip-asym | total | ||||
| 147 | −1.66 | x2−y2 | 71.4 | - | 3.52 | 7.5 | - | - | - | 8.1 | 12.8 |
| 146 | −2.58 | z2 | 78.7 | - | - | 1.8 | 1.1 | - | 3.1 | - | 5.6 |
| 145 | −3.06 | Xy | 79.9 | 3.4 | 5.2 | 9.7 | 4.5 | - | 2.5 | - | 7.9 |
| 144 | −3.24 | Yz | 74.5 | 9.8 | - | 11.6 | 6.0 | - | - | - | 7.5 |
| 143 | −3.42 | Xz | 77.0 | 1.9 | - | 1.9 | 8.1 | 4.9 | - | - | 14.4 |
| 142 | −4.22 | PCA πop-sym | 10.2 | - | - | 1.4 | 31.5 | 7.4 | 2.7 | - | 87.1 |
| 141 | −4.45 | PCA πop-sym | 6.3 | 2.4 | - | 3.2 | 34.3 | 2.8 | - | - | 88.9 |
| 139 | −4.87 | Tyr πop | 11.9 | 70. 4 | - | 80.6 | - | 2.1 | - | - | 5.6 |
| 137 | −5.25 | PCA πop-asym | 1.9 | - | - | 1.2 | 1.7 | 47.4 | - | 1.8 | 95.8 |
| 134 | −6.06 | PCA πip-asym | 1.9 | - | 35.1 | 43.2 | - | - | 19.4 | 20.3 | 49.9 |
| 132 | −6.23 | PCA πip-sym | 4.6 | - | 1.1 | 1.6 | - | - | 30.3 | 25.5 | 66.7 |
| 131 | −6.48 | Tyr πip | 11.8 | - | 36.8 | 41.8 | - | - | 14.9 | 10.2 | 30.3 |
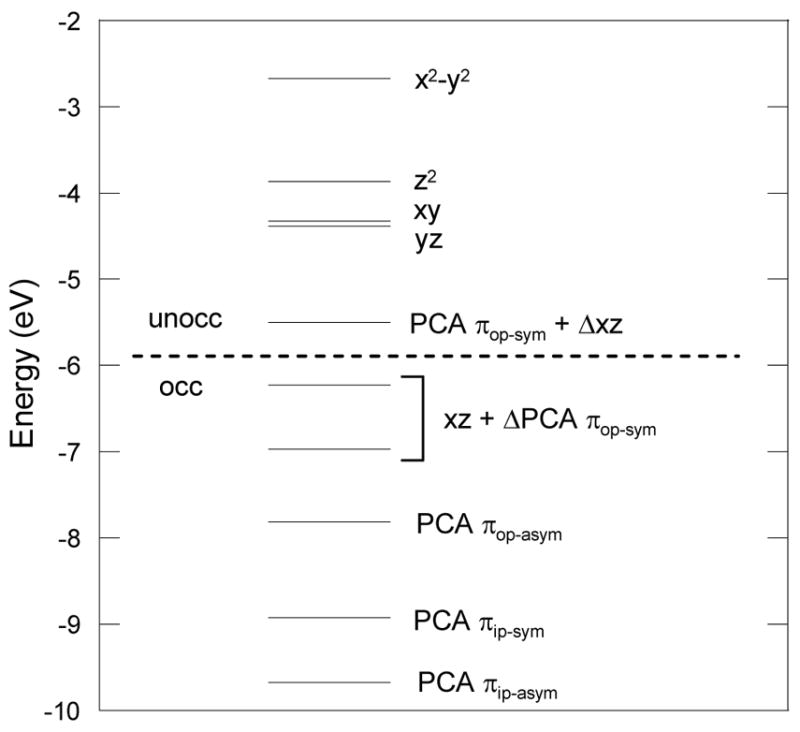
The energy level diagram and MOs for the optimized structure are shown in Figures 7 and 8 respectively. The five lowest-energy unoccupied MOs in the β spin manifold display predominantly iron 3d character with the LUMO having substantial mixing with the catecholate ligand. Because of spin polarization, their five occupied counterparts in the α manifold are greatly stabilized in energy by ~ 4eV. This suggests the active site consists of a high spin ferric center with strong covalent interactions with the catecholate ligand. The splitting pattern of the d orbitals of 3,4-PCD-PCA is consistent with the square pyramidal geometry observed in crystal and geometry optimized structures, with dxy < dyy < dxy < dz2 < dx2−y2. The presence of the Fe-OTyr π bond as well as the longer Fe-OPCA bond along the y-direction makes the dyz orbital slightly less stable than the dxz orbital.
Figure 7.
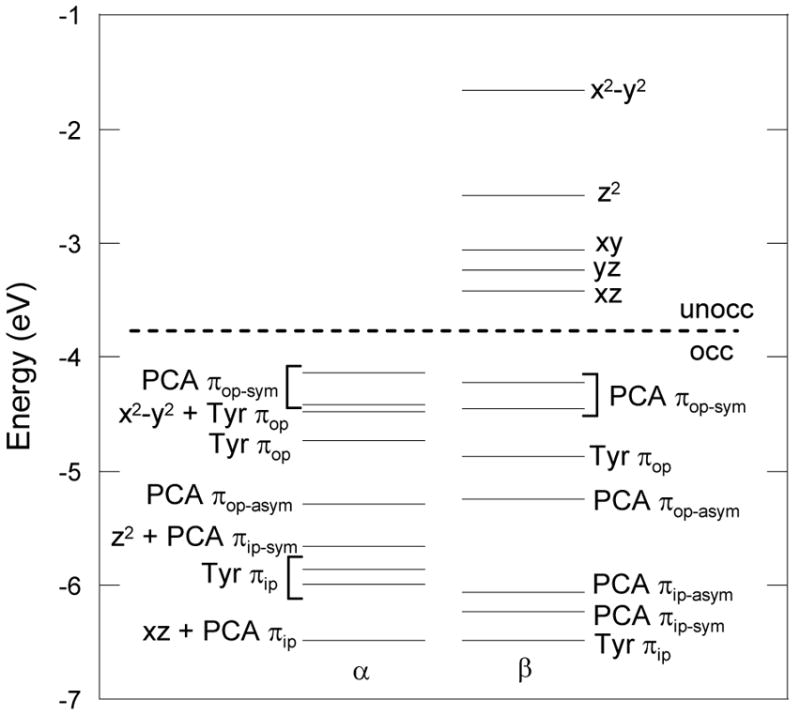
Energy level diagram of the 3,4-PCD-PCA complex. Geometry optimized with BP86/LanL2DZ in Gaussian and wave function obtained with ADF BP86 with ZFe = 25.8 and ε= 4.0 (COSMO). Only three of the occupied α Fe d orbitals are shown, the remaining two are at lower energy below the range shown in this figure.
Figure 8.
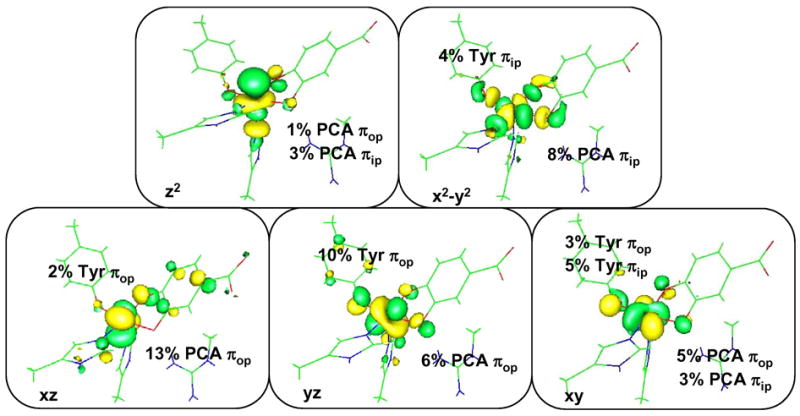
Contours for the 5 unoccupied Fe d orbitals of 3,4-PCD-PCA complex. Geometry optimized with BP86/LanL2DZ in Gaussian and wave function obtained with ADF BP86 with ZFe = 25.8 and ε= 4.0 (COSMO).
The high-lying occupied ligand orbitals which dominate the bonding interactions with the iron d orbitals are the valence orbitals from the tyrosinate and catecholate ligands (Figure 9). Free phenolate and catecholate ligands have three filled 2p orbitals on each oxygen atom. While the oxygen 2p orbital directed along the C-O bond is involved in σ bonding to the carbon atom, the remaining two oxygen 2p orbitals have significant contributions in the πip and πop molecular orbitals where πip lies in the plane of the aromatic ring and πop lies perpendicular to the aromatic ring. Depending on the ∠Fe-O-C and the Fe-O-C-C dihedral angle, these two π orbitals can interaction with the iron d orbitals through σ or π bonding as discussed in detail in our previous study on the resting 3,4-PCD site.37 For the catecholate ligand, the πip orbitals on the two oxygen atoms can be either in-phase (symmetric/sym) or out-of-phase (anti-symmetric/asym) and similarly for the πop orbitals, resulting in 4 different MOs on the catecholate. For a free catecholate ligand, the energy ordering of these four donor orbitals are πop-asym < πip-asym < πip-sym < πop-sym and they can participate in either σ or π interactions with the iron d orbitals depending on the fold angle between the O-Fe-O plane and the plane of the catechol ligand.
Figure 9.
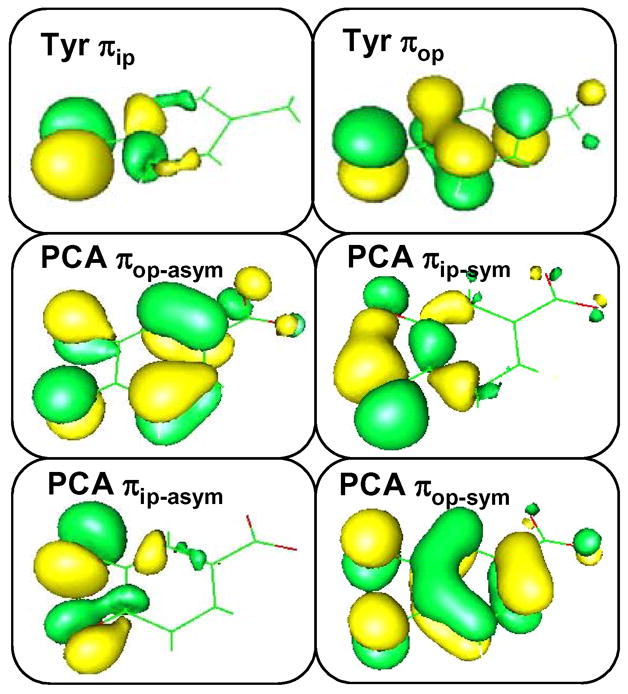
Valence ligand orbitals participate in bonding interactions with Fe.
Table 4 summarizes the orbital contributions of the valence metal-based orbitals as well as the relevant high-lying ligand orbitals from the tyrosine and catecholate. Here, we focus on the unoccupied β MOs to evaluate the bonding contributions. They are antibonding with respect to the Fe-L interaction and reflect the uncompensated occupied counterparts which give the major contribution to bonding. Both σ and π bonding interactions with the tyrosinate and catecholate ligands are observed in the ES complex, with dxz and dyz having π antibonding interactions with the tyrosine and catechol πop orbitals, and dxy and dx2−y2 having σ antibonding interactions with the tyrosine and catechol πip orbitals. The σ interactions provide the greater stabilization of the πip orbitals of both catechol and tyrosinate relative to their πop counterparts. The total πop tyrosinate and catecholate characters in both of the dxz and dyz orbitals are much higher than the total πip characters of the same two ligands in the dxy and dx2−y2 orbitals, hence the bonding interaction in the ES complex is dominated by the strong π covalent donor bonds between tyrosine/catechol πop orbitals and the iron dxz and dyz orbitals.70
C. Time-Dependent DFT and Slater Transition Calculations: Comparison to Spectroscopic Data
All the experimentally observed transitions are expected to be spin-allowed LMCT in the β manifold. From the energy level diagram, we would expect the lower energy transitions observed experimentally to arise from the πop orbitals of the catecholate and tyrosinate ligands while transitions from the πip orbitals will be at much higher energy. TD-DFT calculation with BP86 in Gaussian on the Fe active site with Arg included as a 2nd sphere residue showed that the lower energy transitions are indeed all due to the πop orbitals of these two ligands; with the lowest CT from the πop-sym catecholate donor, the next from the πop tyrosinate donor, and the higher energy CT from the πop-asym catecholate donor orbital (Figure 10). The energy pattern of these calculated CT transitions is consistent with the experimental spectral assignment, which predicts the two lowest energy LMCTs (bands 1 and 2) to arise from catecholate, followed by two LMCTs (bands 3 and 4) from tyrosinate, and with the last LMCT (band 5) arising from catecholate which we now assigned as the πop-asym CT. However, the magnitude of the calculated transition energies is ~7000 cm−1 lower than the experimental values (Figure 10A). Slater transition state calculations performed with ADF on the same truncated model show similar results, with the energy ordering of the calculated CT being consistent with experiment but the predicted magnitude shifted ~7000 cm−1 to lower energy (Figure 10B, upper). This suggests that the pure functional BP86 is too covalent to describe the ES complex. The observation that pure functionals are often too covalent in describing the metal-ligand bonds in transition metal complexes has also been made in our previous DFT studies on CuCl4− and S=3/2 {FeNO}7 complex.71,72 This leads to too much spin densities on the ligand and LMCT transition energies which are too low. To reduce the amount of mixing between the Fe and ligands, ZFe has decreased from 26 to 25.8. A significant improvement in the calculated values was obtained, with the predicted LMCT now being ~3500 cm−1 lower in energy relative to experiment. By taking into account the effects of solvent (ε = 4.0), the calculated LMCT fall in the experimental region (within 1500 cm−1). (Figure 10B, lower)
Figure 10.
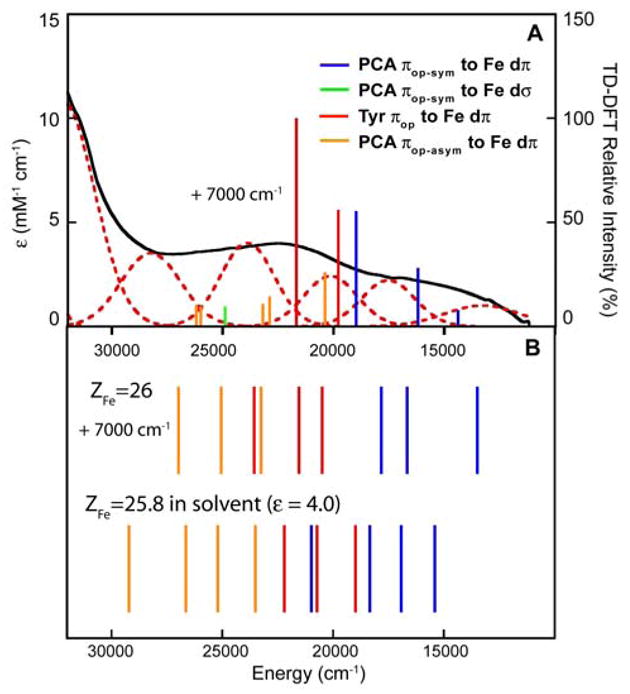
Comparison of the Abs spectrum with calculated transition energies of the 3,4-PCD-PCA complex. (A) Predicted transition energies and intensities by Gaussian TD-DFT. The intensities are indicated by the height of the vertical lines (y-axis, right). (B) Predicated transition energies by Slater transitions with ADF. (Upper: ZFe=26 in vacuum, lower: ZFe=25.8 in solvent). Although the calculated energies are 7000 cm−1 too low for the TD-DFT and ZFe=26 Slater transition calculations, the energy ordering of the LMCT agrees with the experimental data.
To obtain the same experimentally-calibrated electronic description of the ES complex in Gaussian, ionic Hartree-Fock (HF) character was mixed into the covalent DFT wave function to destabilize the Fe d-manifold and improve the ground state description. Since spin density gives a measurement of covalency and thus the bonding description, spin densities obtained from the spectroscopically-calibrated calculation in ADF were compared with those obtained in Gaussian with various amounts of HF exchange mixing in the density functional. A bonding description consistent with experiments is obtained when the spin densities obtained from Gaussian match those obtained from ADF with ZFe = 25.8. The results are summarized in Table 5. Significant difference in spin densities is observed between the Gaussian BP86/LanL2DZ and ADF BP86/TZP calculations. By replacing the effective core potential basis set with TZP, an all electron basis set, a single point energy calculation with BP86 in Gaussian now shows comparable spin densities as those obtained using the same functional in ADF. Spin densities obtained with BP86/TZP and various amount of HF exchange (0–20%) in Gaussian were compared with the experimentally-calibrated value obtained from ADF with ZFe = 25.8 both in vacuum and in the presence of solvent. The best agreement was found with 10% HF exchange. Geometry optimization with BP86 + 10% HF exchange with TZP results in a structure comparable to that obtained from BP86 and LanL2DZ (Figure S2); thus the choice of functional and basis set has a stronger impact on the bonding description than on the geometry of the ES complex. This establishes the BP86 with 10% HF exchange and TZP basis set as an experimentally-calibrated DFT protocol for further studies on the O2 reaction of the ES complex. However, TZP is too large a basis set to use for geometry optimization along each step of the reaction coordinate on a practical time scale. Hence, a mixed basis set was introduced for the optimization of the ES complex, where the Fe3+ center and residues in the 1st coordination sphere are described by an all-electron double-ζ basis set 6-31G* and the residues in the 2nd coordination sphere by the all electron double-ζ basis set 3-21G*. The resulting optimized structure is comparable to the structure optimized with BP86 and LanL2DZ (Figure S2) except that the asymmetry in Fe-OPCA bondlength is less pronounced and the Tyr residue directly coordinated to the Fe3+ is rotated by ~ 45° relative to the crystal structure. Rotation of the Tyr residue is found to only cost 3 kcal/mol and these structural differences do not have a significant effect on the calculated spin densities. Hence the experimentally-calibrated DFT protocol for further geometry optimization calculations with the ES complex is the hybrid BP86 + 10% HF exchange with a mixed 6-31G*/3-21G* basis set.
Table 5.
Spin densities of Fe, Tyr and PCA with Gaussian and ADF on a fixed geometry optimized with BP86/LanL2DZ in Gaussian. Various amounts of HF exchange (HFX) were mixed into the pure density functional BP86 in the Gaussian calculation.
| Fe | Tyr | PCA | ||
|---|---|---|---|---|
| Gaussian | BP86/LanL2DZ | 3.71 | 0.33 | 0.86 |
| BP86/TZP | 3.83 | 0.29 | 0.81 | |
| BP86/TZP/solv | 3.95 | 0.34 | 0.60 | |
| BP86 +10% HFX/TZP | 3.90 | 0.24 | 0.81 | |
| BP86+10% HFX/TZP/solv | 4.04 | 0.30 | 0.55 | |
| BP86+20% HFX/TZP | 3.94 | 0.18 | 0.84 | |
|
| ||||
| ADF | Z=26/TZP | 3.83 | 0.29 | 0.80 |
| Z=25.8/TZP | 4.05 | 0.25 | 0.65 | |
| Z=25.8/TZP/solv | 4.20 | 0.27 | 0.42 | |
The spin densities on the PCA substrate in the experimentally-calibrated calculations (0.65 in ADF with ZFe=25.8 and 0.81 in Gaussian with 10% HF exchange) appear to suggest that the ES complex has significant Fe2+-semiquinone character. However, covalent interactions with a highly paramagnetic center can also contribute to ligand spin density. The PCA π*op-sym orbital character is evaluated in Section 3.5A by comparing to catecholate and semiquinone bound to non-paramagnetic Ga3+ sites.
3.4 Spin-Orbit Coupling Mechanism for MCD Pseudo-A term Behavior
MCD intensity is described by A-, B- and C-terms.73–76 For paramagnetic systems, the C-term (=C0/kT) dominates the MCD intensity at low temperature. C0 for a spin-allowed transition from a spatially non-degenerate doublet ground state |A> to an excited state |J> is given by
| (3) |
where gw is the effective g-value of the doublet in the w-direction, and are the spin-orbit coupling (SOC) matrix elements in the w-directions, and is the component of the transition dipole moment between |A〉 and |J〉 in the u-direction (equivalent definitions for , and ).42
Two mechanisms allow for a non-zero C0 value in systems with less than C3 symmetry: 1) SOC between two nearby excited states |J> and |K> to which orthogonal transitions are made from a single ground state |A> and 2) SOC between the ground state |A> and a low-lying excited state |K> from which two orthogonal transitions can be made to a single excited state |J>. For the first mechanism, J and K are interchangeable, hence resulting in the following relationship:
| (4) |
This implies that the two orthogonal transitions |A> → |J> and |A> → |K> will give rise to oppositely signed C-terms with equal intensities, and this pair of C-terms is the “pseudo-A term” which obeys the MCD sum rule (i.e. the total MCD intensity summed over all MCD-active excited states is zero).77 For the second mechanism, at low temperature where the low-lying excited state |K> is not populated, only the |A> → |J> transition is observed where the |K> → |J> transition serves as a virtual orthogonal transition required for MCD activity. This does not obey the MCD sum rule and is not consistent with the spectrum of the 3,4-PCD-PCA complex in Figure 2.
The sign changes for the LMCT in the MCD spectra for both 3,4-PCD-PCA and 3,4-PCD-HPCA reflect pseudo-A term behavior which follows the first mechanism for C-term intensity, i.e. SOC between the LMCT excited states. The mechanism of pseudo-A term behavior between two perpendicularly polarized CT transitions involves SOC along the 3rd mutually orthogonal direction. As shown in our VTVH MCD analysis, all of the observed LMCT are either x polarized and originating from PCA or y polarized and originating from Tyr. For MCD activity, these x- and y-polarized transitions require a SOC matrix element in the z-direction, Lz and the C0-parameter in Eqn 3 can be rewritten as:
| (5) |
Since the SOC is effectively a localized, one-center, one electron operator, the center involved in SOC using Lz must be simultaneously present in two orthogonal CT transitions, with the two CT excited states differing only in the occupancy of one orbital. Hence for 3,4-PCD-PCA, the SOC must be centered on the Fe resulting in a metal-based SOC mechanism. Since the donors of these two orthogonal transitions are different, the acceptor Fe d orbital has to be common between the two transitions for pseudo-A term behavior.
From our excited-state calculations, we have found that the experimentally observed LMCT originate from the PCA and Tyr πop orbitals to the Fe dπ orbitals. Due to the strong covalent interactions between the dxz and the πop PCA orbitals (sym and asym) and between the dyz and the Tyr πop orbital, significant metal characters ( dxz and dyz) are observed in the corresponding ligand-based donor MO’s (Figure 11). Hence, although the donor CT states are mostly ligand-centered, the metal-based SOC would be operative through the metal contribution in the ligand-based orbitals, i.e. LzSz can operate between dxz and dyz on Fe in two different CT states, and this serves as the orbital origin of the excited state SOC in the 3,4-PCD-PCA complex. To determine which pair of Tyr and PCA to Fe3+ CT gives rise to the sign changes observed in the MCD data, we evaluated the sign of the C0-parameter for each LMCT pair. The procedure involves determining the signs of the transition dipole moment (Dx and Dy) as well as the SOC matrix element Lz, and applying these in Eqn 5. This has been developed in Ref 42 and thoroughly presented in Ref 78. Application to the DFT calculated results for the 3,4-PCD-PCA complex gives the following 3 pairs of LMCT as possibilities for the alternating sign changes observed in the MCD data: 1) PCA πop-sym to dxz (+C0) and Tyr πop to dxz (−C0) 2) PCA πop-sym to dyz (−C0) and Tyr πop to dyz (+C0) 3) Tyr πop to dxz (−C0) and PCA πop-asym to dxz (+C0). These are diagramed in Figure S3 of the supplementary material and lead to the specific assignments of bands 1 – 5 as PCA πop-sym to dxz, PCA πop-sym to dyz, Tyr πop to dyz, Tyr πop to dxz, and PCA πop-asym to dxz respectively.79 The important part of these assignments is that the lowest energy CT transition is from PCA πop to Fe dπ which relates to the reactivity of the substrate as developed below.
Figure 11.
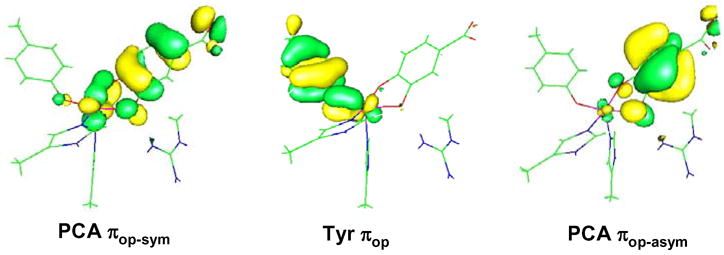
Ligand-based MOs involved in SOC mechanism for MCD Pseudo-A terms. Note the significant metal characters in these orbitals.
3.5 Electronic Structure Contributions to Substrate Activation
The main difference among various proposed mechanisms of substrate activation lies in whether the high spin ferric ES complex has Fe2+-semiquinone or Fe3+-catecholate character. Although the calculated spin densities of the ES complex (Table 5) suggest significant Fe2+-semiquinone character, spin densities can be induced in the PCA unit through spin delocalization from the high spin Fe3+. Hence in order to evaluate the effect of spin delocalization through direct bonding interactions, we compared our experimentally-calibrated electronic structure of the ES complex with hypothetical Ga3+ substituted catecholate and semiquinone complexes in a similar ligand environment as in the enzyme active site. Ga3+ has a similar ionic radius to Fe3+ (0.62 vs 0.645 Å respectively)30 and is diamagnetic. This allows us to evaluate catecholate and semiquinone ligand-metal bonds in the absence of covalent spin delocalization from the metal. The effect of the Tyr408 ligand on substrate activation is also investigated by comparing the electronic structure of the ES complex with a hypothetical model where Tyr408 is replaced by a weak donor ligand.
A. Catecholate versus Semiquinone Character in the ES Complex
Hypothetical Ga3+-catecholate and Ga3+-semiquinone complexes were formed by replacing the Fe3+, Tyr and PCA on the ES complex with Ga3+, OH− and catecholate while keeping hydrogen-bonding 2nd sphere Arg residue (modeled as methyl-guanidium ion). The Ga3+ complexes were geometry optimized using our experimentally-calibrated DFT protocol and the ligand contributions in the MOs were analyzed (Table 6). For the free ligands, oxidation of catecholate to semiquinone eliminates one electron from the HOMO πop-sym orbital (Figure 9). In the Ga3+ complex, the πop-sym β orbital changes from being 88.2% occupied in the Ga3+-catecholate complex to being 7.7% occupied in the Ga3+-semiquinone complex. Occupation differences in the other 3 donor orbitals are insignificant. Hence, upon oxidation of catecholate to semiquinone in the Ga3+ complexes, 0.81 e− is lost from the πop-sym orbital with the remaining 0.19 e− distributed over other ligand orbitals due to binding. Applying this as a reference to the ferric complex, we were able to quantify the amount of catecholate and semiquinone character present in the ES complex (Table 6). Significant changes in the % occupancy relative to the Ga3+-catecholate complex are observed in all four of the valence donor orbitals of PCA in the ES complex but the degree of difference varies among the orbitals. The πop-sym orbital is 61.5% occupied, thus only 0.27 e− is lost from the πop-sym orbital relative to the Ga3+-catecholate complex. Including the other 3 valence orbitals, the net electron loss of PCA upon binding to the Fe3+ center is 0.36 e−. This net electron loss is much smaller than that observed on the oxidation of the catecholate ligand in the Ga3+ complex to semiquinone. In additional, in contrast to the Ga3+ complexes where the electron loss is localized on one orbital (πop-sym), the net electron loss in the ES complex is distributed unequally among the 4 valence orbitals. Thus, the ES complex is best described as a Fe3+-catecholate complex with very strong covalent interactions and the covalency is distributed among the four valence donor orbitals.
Table 6.
Comparison of % occupancy of valence PCA orbitals (spin-down) of Ga3+ catecholate/semiquinone complexes and Tyr 408–NH3 complex with the 3,4-PCD-PCA complex
| Model | % Occupancy
|
|||
|---|---|---|---|---|
| πop-sym | πop-asym | πip-sym | πip-asym | |
|
| ||||
| Ga3+-catecholate | 88.23 | 95.87 | 83.2 | 92.62 |
| Ga3+-semiquinone | 7.66 | 94.95 | 84.58 | 95.22 |
| Fe3+-PCA | 61.47 | 89.58 | 86.16 | 86.63 |
| Fe3+-PCA (Tyr408-NH3) | 47.32 | 79.04 | 89.41 | 85.45 |
B. The Role of Tyr408 in Substrate Activation
Recent studies on Tyr408 mutants showed that Tyr408 is critical for the dissociation of Tyr447, which allows for the bidentate-binding of PCA and facilitates the initial O2 attack.22 To evaluate the electronic effect of Tyr408 on substrate activation in the ES complex, a hypothetical model was formed by replacing the 4-Me-phenolate which models Tyr408 by a weaker donor ligand (NH3). This hypothetical complex (Tyr408-NH3) was geometry optimized and the ligand contributions in the Mos were analyzed (Table 6 and Figure 12). The πop-sym orbital changes from being 61.5% occupied in the ES complex to being 47.3% occupied in the Tyr408-NH3 complex, and the πop-asym orbital changes from being 89.6% occupied in the ES complex to being 79.0% occupied in the Tyr408-NH3 complex. Insignificant changes were noted in the two PCA πip orbitals. Applying the reference developed in the previous section, the net electron loss of PCA upon binding to the Fe3+ in this Tyr408-NH3 complex is 0.59 e−. This is much greater than the 0.36 e− in the ES complex, implying that the Tyr408-NH3 computational model has more Fe2+-semiquinone character than the ES complex. This is consistent with the difference in ligand donor strength between NH3 and phenolate. The phenolate imposes a stronger trans effect on the PCA ligand, hence reduces the amount of charge donation from the substrate to the Fe3+ center. Thus Tyr408 appears to play a role in stabilizing the Fe3+ center in the active site. When Tyr is not present, the β HOMO shifts from the PCA πop-sym orbital to the Fe dxz orbital. (Figure 12) The effect of a more reduced Fe center on the 2-electron transfer from the singlet PCA to the triplet O2 will be discussed below.
Figure 12.
Energy level diagram (spin down) of the Tyr408-NH3 complex. Geometry optimized with BP86 + 10% HF exchange with basis set 6-31G*/3-21G* in Gaussian. Note that Δ represents substantial (~25%) mixing of PCA πop-sym and dxz orbitals into the HOMO and LUMO respectively.
C. Frontier Molecular Orbitals and Electrophilic Attack of O2 on the Substrate
A peroxy adduct bridging between the Fe center and one of the hydroxyl carbons on the catecholic substrate has been proposed to form in the initial step of the O2 reaction for intradiol dioxygenases.20 A 2-electron transfer between the ES complex and O2 must accompany the formation of this peroxy intermediate. As shown in the energy level diagram, the doubly occupied PCA πop-sym orbital is the HOMO in the ES complex, with the α orbital being slightly less stable than its β counterpart (Figure 7). This suggests that the high-lying πop-sym orbital can readily donate electrons into the O2 π* orbitals (π*σ and π*v where σ is oriented along the O-CPCA bond and v is oriented perpendicular (vertical) to this O-CPCA bond), resulting in an electrophilic attack of O2 on the substrate. However, since the ground state of O2 is 3Σg−, the interaction between O2 and the PCA is spin-forbidden. Only one electron from the doubly-occupied πop-sym orbital can be donated directly to the O2 π*σ orbital to form the CPCA-O Σ bond. The second electron required to reduce O2 to O22− has to be donated either from another valence PCA orbital or an occupied d orbital of the Fe3+ center, which can interact with the π*v orbital of O2 (perpendicular to the O-CPCA direction). NPA charges on the two hydroxyl carbons are both positive, with C3PCA being slightly less positive than C4PCA (C3: 0.21, C4: 0.26). This suggests that C3 (along the y-axis of the D-tensor described in Section 3.2) is the more favorable site for electrophilic attack.
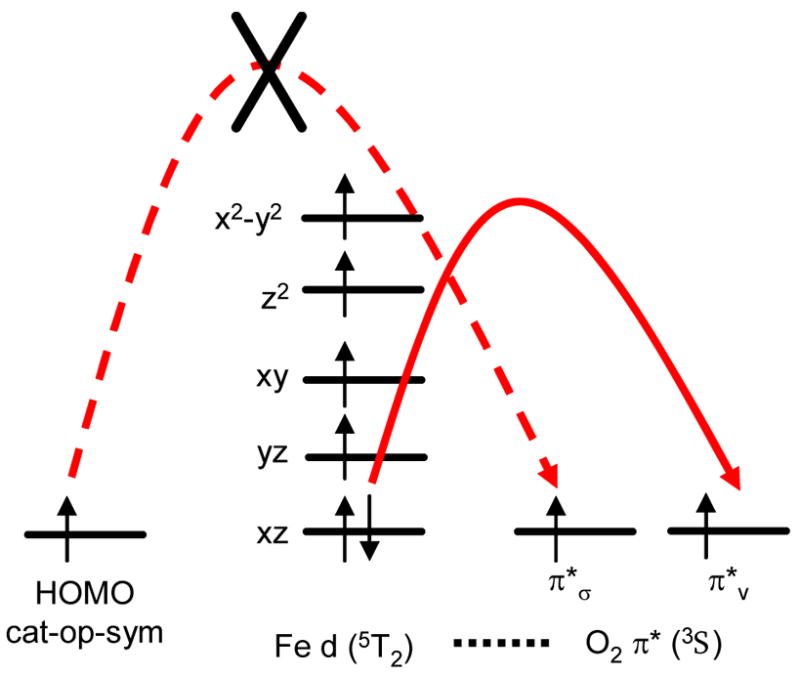
To determine which frontier molecular orbitals participate in the initial interaction with O2, we inspected the four valence PCA orbitals as well as the five iron d orbitals in both the alpha and beta manifolds. The strong covalent interaction between the PCA πop-sym and dxz orbitals in the beta manifold, reflected by the low energy LMCT transition observed in our spectroscopic data (Band 1, Figure 2), shows significant transfer of the β electron from the occupied PCA πop-sym orbital to the unoccupied dxz orbital. This leaves the higher energy α electron of PCA πop-sym orbital more vulnerable for electrophilic attack by the O2 π*σ orbital and puts the triplet O2 in an anti-ferromagnetic state relative to the high spin Fe3+ center. This anti-ferromagnetic coupling between O2 and the high spin Fe3+ center would facilitate the transfer of an α electron from the iron to complete the two electron redox process between the ES complex and O2. The iron d orbital which participates in the second electron transfer has to have good overlap with the singly-occupied O2 π*v. Among the five d orbitals, the dxz orbital is capable of forming a good π interaction with the O2 π*v orbital. Hence, the transfer of these 3 electrons (one β and two α) as O2 binds to the ES complex (Figure 13) demonstrates that the iron center acts as a buffer to transfer an electron pair from the PCA πop-sym orbital to the triplet O2 in this formally spin-forbidden reaction which would leave an intermediate spin state (S = 3/2) on the Fe3+ center.
Figure 13.

Schematics and the frontier molecular orbitals which participate in the 3-electron transfer process upon O2 binding.
In the Tyr408-NH3 complex, the absence of the phenolate ligand leads to strong donation of the PCA πop-sym into the Fe dxz orbital and results in an iron center with more Fe2+ character. The PCA πop-sym orbital becomes singly-occupied with the electron residing in the α orbital and the dxz orbital becomes the HOMO in the β manifold. (Figure 12) With the β dxz orbital being the HOMO and of much higher energy than its α counterpart, electrophilic attack of the O2 π*v orbital on the β dxz would become facile. This would stabilize the triplet O2 in a ferromagnetic configuration relative to the high spin Fe3+ center and restrict the transfer of the α electron from the PCA πop-sym to the O2 π*σ for completing the 2 electron redox process between PCA and O2. (Figure 14) This is different from the anti-ferromagntic arrangement between O2 and the high spin Fe3+ center in the ES complex. Hence, the presence of Tyr408 helps to stabilize the Fe3+ center which is essential in directing the electrophilic O2 to attack the PCA πop-sym HOMO and align the triplet O2 to the correct spin to allow for the 2nd electron transfer between PCA and O2.
Figure 14.
Schematics of electron transfer with Fe2+-semiquinone as the initial electronic description for the ES complex.
4. Discussion
A combination of spectroscopic techniques (Abs, CD, MCD and VTVH MCD) and DFT calculations were used here to develop an understanding of the substrate interaction with the Fe3+ site in the intradiol dioxygenases. A broad Abs spectrum is present for 3,4-PCD-PCA in the 6000 – 31000 cm−1 region which we were able to resolve into at least 5 individual transitions with VTVH MCD. The orbital origin of these LMCT transitions were then investigated by comparing the experimental transition energies and the signs of the MCD signal with wave functions and predicted transition dipole moments of the 3,4-PCD-PCA complex obtained from DFT calculations. This showed that all five LMCT transitions originate from charge transfer from the PCA and Tyr πop orbitals to the ferric dπ (xz and yz) orbitals. These strong π covalent donor bonds between tyrosine/catechol πop orbitals and the iron dxz and dyz orbitals dominate the bonding interaction in the ES complex and are the origins of the pseudo-A terms observed in our MCD data.
By modeling the three 2nd sphere residues (Arg457, Tyr324, and Trp449) which either impose steric or hydrogen bonding interactions to the PCA substrate in our DFT calculations, we were able to reproduce the folded asymmetric binding of PCA to the Fe3+ center in the active site of 3,4-PCD. Failure to reproduce the unique geometry of the substrate in the calculations which only included the 1st coordination sphere residues suggests that the trans effect from Tyr408 alone is not enough to induce the asymmetric binding of the catecholate which has previously been suggested to assist ketonization of the substrate for O2 attack.20 By replacing Tyr408 with NH3, we found that Tyr408 is essential in stabilizing the Fe3+ center in the ES complex for the reaction of O2 with the HOMO PCA πop-sym orbital to allow for facile electron transfer.
Comparing the electronic structure of 3,4-PCD-PCA with that of the hypothetical Ga3+-catecholate and Ga3+-semiquinone complexes, we found that 3,4-PCD-PCA is best described as a highly covalent Fe3+-catecholate complex where the covalency is distributed unevenly among the four PCA valence orbitals with the strongest interaction present between the πop-sym and Fe dxz orbitals. This strong π interaction, as reflected in the lowest energy PCA to Fe3+ LMCT transition (Band 1, Figure 2), serves as the origin of substrate activation in the O2 reaction of intradiol dioxygenases. The transfer of the β electron from the occupied PCA πop-sym orbital to the unoccupied dxz orbital leaves the higher energy α electron of PCA πop-sym orbital more vulnerable to electrophilic attack by the O2 π*σ orbital. This arranges the triplet O2 in an anti-ferromagnetic configuration relative to the high spin Fe3+ center and allows for the interaction between the O2 π*v and Fe dxz orbitals to complete the two electron redox process between PCA and O2 in forming the peroxy-bridged adduct. The transfer of these 3 electrons (one β and twoα) to bind O2 as peroxide to the ES complex (Figure 13) demonstrates that the iron center can act as a buffer in the transfer of an electron pair from singlet PCA to triplet O2. We have found that the ligand field of Fe is key in overcoming the spin-forbidden nature of the O2 reaction by stabilizing the interchange of an electron from the PCA πop-sym orbital to the appropriate spin for the second electron reduction of O2, leaving an intermediate spin state (S = 3/2) on the Fe3+ center.
Instead of forming a six coordinate peroxo-bridged intermediate, preliminary geometry optimization of the S = 3/2 ESO2 complex results in two different five coordinate species in which PCA binds monodentate to the iron with the peroxide bridging between the iron center and either the C3 or C4 position of the PCA ligand. Due to the slight charge preference for an electrophilic attack at C3 (Section 3.5C), its optimized peroxide bridged structure is presented in Figure 15. In the optimized geometry, O4PCA has come off from the metal center and results in a square pyramidal ligand field with the open position trans to His462. This open coordination site is defined as the z-axis of the ESO2 complex. The strong ligand interactions in the xy-plane, particularly the short Operoxide-Fe bond, raise the energy of the dx2-y2 orbital in the square pyramidal ligand field, and hence stabilize the intermediate spin on the Fe center and facilitate the multi-electron transfer mechanism developed above.
Figure 15.
Geometry optimized the peroxy adduct ESO2 with Stot=3/2 and its coordinate system.
A final interesting point is that the location of the open coordination site in the ESO2 complex coincides with the position of Tyr477 coordination before it dissociated from the Fe3+ center upon substrate binding. This suggests that upon O2 binding, the active site is readily accessible for the re-coordination of Tyr447 to the Fe3+ center. We are currently studying this O2 reaction coordinate to determine factors leading to a bridging peroxide at C3PCA instead of C4PCA, at what step along the reaction coordinate Tyr447 rebinds to the Fe3+ center, how this affects the spin state of the Fe3+ center, and to evaluate factors governing intradiol cleavage.
Supplementary Material
Cartesian coordinates of the geometry optimized model of the 3,4-PCD-PCA active site with Gaussian BP86 and LanL2DZ (Table S1); Gaussian resolution and abs spectra of 3,4-PCD and 3,4-PCD-PCA (Fig S1); Overlay of the optimized 3,4-PCD-PCA structures with BP86 (LanL2DZ), BP86 + 10%HF exchange (TZVP) and BP86 + 10%HF exchange (6-31G*/3-21G*) (Fig S2); Graphical prediction of the signs of the C0-parameters of the Tyr and PCA → Fe3+ CT transitions (Fig S3); Complete reference for the Gaussian 03 package. This material is available free of charge via the Internet at http://pubs.acs.org.
Acknowledgments
This research was supported by NIH Grant GM40392 (E.I.S.) and NIH Grant GM24689 (J.D.L.). M.Y.M.P. thanks the Natural Sciences and Engineering Research Council of Canada for a postgraduate scholarship.
References
- 1.Feig AL, Lippard SJ. Chem Rev. 1994;94:759–805. [Google Scholar]
- 2.Hegg EL, Que L., Jr Eur J Biochem. 1997;250:625–629. doi: 10.1111/j.1432-1033.1997.t01-1-00625.x. [DOI] [PubMed] [Google Scholar]
- 3.Lipscomb JD, Orville AM. Metal Ions in Biological Systems. 1992;28:243–298. [Google Scholar]
- 4.Que L, Jr, Ho RYN. Chem Rev. 1996;96:2607–2624. doi: 10.1021/cr960039f. [DOI] [PubMed] [Google Scholar]
- 5.Solomon EI, Brunold TC, Davis MI, Kemsley JN, Lee SK, Lehnert N, Neese F, Skulan AJ, Yang YS, Zhou J. Chem Rev. 2000;100:235–349. doi: 10.1021/cr9900275. [DOI] [PubMed] [Google Scholar]
- 6.Neidig ML, Solomon EI. Chem Commun. 2005:5843–5863. doi: 10.1039/b510233m. [DOI] [PubMed] [Google Scholar]
- 7.Dagley S. In: The Bacteria. Sokatch JR, Ornston LN, editors. Vol. 10. Academic Press, Inc; Orlando: 1986. pp. 527–555. chapter 10. [Google Scholar]
- 8.Levin MA, Gealt MA. In: Biotreatment of Industrial and Hazardous Waste. Levin MA, Gealt MA, editors. McGraw-Hill, Inc; New York: 1993. pp. 5–7. [Google Scholar]
- 9.Glick BR, Pasternak JJ. Molecular Biotechnology: Principles and Applications of Recombinant DNA. 2. American Society for Microbiology; Washington DC: 1998. [Google Scholar]
- 10.Hrywna Y, Tsoi TV, Maltseva OV, Quensen JF, III, Tiedje JM. Appl Environ Microbiol. 1999;65:2163–2169. doi: 10.1128/aem.65.5.2163-2169.1999. [DOI] [PMC free article] [PubMed] [Google Scholar]
- 11.Boldt YR, Sadowsky MJ, Ellis LBM, Que L, Jr, Wackett LP. J Bacteriol. 1995;177:1225–1232. doi: 10.1128/jb.177.5.1225-1232.1995. [DOI] [PMC free article] [PubMed] [Google Scholar]
- 12.Que L, Jr, Widom J, Crawford RL. J Biol Chem. 1981;256:10941–10944. [PubMed] [Google Scholar]
- 13.Whiting AK, Boldt YR, Hendrich MP, Wackett LP, Que L., Jr Biochemistry. 1996;35:160–170. doi: 10.1021/bi951979h. [DOI] [PubMed] [Google Scholar]
- 14.Bugg TDH, Winfield CJ. Nat Prod Rep. 1998:513–530. [Google Scholar]
- 15.Bugg TDH, Lin G. Chem Commun. 2001:941–952. [Google Scholar]
- 16.Fujisawa H, Hayaishi O. J Biol Chem. 1968;243:2673–2681. [PubMed] [Google Scholar]
- 17.Elgren TE, Orville AM, Kelly KA, Lipscomb JD, Ohlendorf DH, Que L., Jr Biochemistry. 1997;36:11504–11513. doi: 10.1021/bi970691k. [DOI] [PubMed] [Google Scholar]
- 18.Frazee RW, Orville AM, Dolbeare KB, Yu H, Ohlendorf DH, Lipscomb JD. Biochemistry. 1998;37:2131–2144. doi: 10.1021/bi972047b. [DOI] [PubMed] [Google Scholar]
- 19.Orville AM, Elango N, Lipscomb JD, Ohlendorf DH. Biochemistry. 1997;36:10039–10051. doi: 10.1021/bi970468n. [DOI] [PubMed] [Google Scholar]
- 20.Orville AM, Lipscomb JD, Ohlendorf DH. Biochemistry. 1997;36:10052–10066. doi: 10.1021/bi970469f. [DOI] [PubMed] [Google Scholar]
- 21.Vetting MW, D’Argenio DA, Ornston LN, Ohlendorf DH. Biochemistry. 2000;39:7943–7955. doi: 10.1021/bi000151e. [DOI] [PubMed] [Google Scholar]
- 22.Valley MP, Brown CK, Burk DL, Vetting MW, Ohlendorf DH, Lipscomb JD. Biochemistry. 2005;44:11024–11039. doi: 10.1021/bi050902i. [DOI] [PubMed] [Google Scholar]
- 23.Whittaker JW, Lipscomb JD, Kent TA, Münck E. J Biol Chem. 1984;259:4466–4475. [PubMed] [Google Scholar]
- 24.Davis MI, Wasinger EC, Westre TE, Zaleski JM, Orville AM, Lipscomb JD, Hedman B, Hodgson KO, Solomon EI. Inorg Chem. 1999;38:3676–3683. doi: 10.1021/ic981464p. [DOI] [PubMed] [Google Scholar]
- 25.True AE, Orville AM, Pearce LL, Lipscomb JD, Que L., Jr Biochemistry. 1990;29:10847–10854. doi: 10.1021/bi00500a019. [DOI] [PubMed] [Google Scholar]
- 26.Horsman GP, Jirasek A, Vaillancourt FH, Barbosa CJ, Jarzecki AA, Xu CL, Mekmouche Y, Spiro TG, Lipscomb JD, Blades MW, Turner RFB, Eltis LD. J Am Chem Soc. 2005;127:16882–16891. doi: 10.1021/ja053800o. [DOI] [PMC free article] [PubMed] [Google Scholar]
- 27.Bull C, Ballou DP, Otsuka S. J Biol Chem. 1981;256:12681–12686. [PubMed] [Google Scholar]
- 28.Whittaker JW, Lipscomb JD. J Biol Chem. 1984;259:4476–4486. [PubMed] [Google Scholar]
- 29.Que L, Jr, Lipscomb JD, Munck E, Wood JM. Biochim et Biophys Acta. 1977;485:60–74. doi: 10.1016/0005-2744(77)90193-0. [DOI] [PubMed] [Google Scholar]
- 30.Cox DD, Que L., Jr J Am Chem Soc. 1988;110:8085–8092. [Google Scholar]
- 31.Jang HG, Cox DD, Que L., Jr J Am Chem Soc. 1991;113:9200–9204. [Google Scholar]
- 32.Lipscomb JD, Orville AM, Frazee RW, Dolbeare KB, Elango N, Ohlendorf DH. In: Spectroscopic Methods in Bioinorganic Chemistry. Solomon EI, Hodgson KO, editors. American Chemical Society; Washington, DC: 1998. pp. 387–402. [Google Scholar]
- 33.Funabiki T, Yamazaki T. J Mol Catal A: Chem. 1999;150:37–47. [Google Scholar]
- 34.Funabiki T, Konishi T, Kobayashi S, Mizoguchi A, Takano M, Yoshida S. Chem Lett. 1987:719–722. [Google Scholar]
- 35.Hitomi Y, Yoshida M, Higuchi M, Minami H, Tanaka T, Funabiki T. J Inorg Biochem. 2005;99:755–763. doi: 10.1016/j.jinorgbio.2004.12.004. [DOI] [PubMed] [Google Scholar]
- 36.Que L, Jr, Lipscomb JD, Zimmerman R, Münck E, Orme-Johnson NR, Orme-Johnson WH. Biochim Biophys Acta. 1976;452:320–334. doi: 10.1016/0005-2744(76)90182-0. [DOI] [PubMed] [Google Scholar]
- 37.Davis MI, Orville AM, Neese F, Zaleski JM, Lipscomb JD, Solomon EI. J Am Chem Soc. 2002;124:602–614. doi: 10.1021/ja011945z. [DOI] [PubMed] [Google Scholar]
- 38.Fujisawa H, Hiromi K, Uyeda M, Okuno S, Nozaki M, Hayaishi O. J Biol Chem. 1972;247:4422–4428. [PubMed] [Google Scholar]
- 39.Whittaker JW, Orville AM, Lipscomb JD. Methods in Enzymology. 1990;188:82–88. doi: 10.1016/0076-6879(90)88016-4. [DOI] [PubMed] [Google Scholar]
- 40.Orville AM, Lipscomb JD. Biochemistry. 1997;36:14044–14055. doi: 10.1021/bi970609l. [DOI] [PubMed] [Google Scholar]
- 41.Browett WR, Fucaloro AF, Morgan TV, Stephens PJ. J Am Chem Soc. 1983;105:1868–1872. [Google Scholar]
- 42.Neese F, Solomon EI. Inorg Chem. 1999;38:1847–1865. doi: 10.1021/ic981264d. [DOI] [PubMed] [Google Scholar]
- 43.Frisch MJ, et al. Gaussian 03, Revision C.02. 2004 http://www.gaussian.com, Wallingford CT.
- 44.Becke Axel D. Phys Rev A: Gen Phys. 1988;38:3098–3100. doi: 10.1103/physreva.38.3098. [DOI] [PubMed] [Google Scholar]
- 45.Perdew JP. Phys Rev B: Cond Mater. 1986;33:8822–8824. doi: 10.1103/physrevb.33.8822. [DOI] [PubMed] [Google Scholar]
- 46.Lee C, Yang W, Parr RG. Phys Rev B: Condens Matter. 1988;37:785–789. doi: 10.1103/physrevb.37.785. [DOI] [PubMed] [Google Scholar]
- 47.Miehlich B, Savin A, Stoll H, Preuss H. Chem Phys Lett. 1989;157:200–206. [Google Scholar]
- 48.Becke AD. J Chem Phys. 1993;98:5648–5652. [Google Scholar]
- 49.Reed Alan E, Curtiss Larry A, Weinhold Frank. Chem Rev. 1988;88:899–926. [Google Scholar]
- 50.Cramer CJ, Truhlar DG. Chem Rev. 1999;99:2161–2200. doi: 10.1021/cr960149m. [DOI] [PubMed] [Google Scholar]
- 51.Casida ME. In: Recent Advances in Density Functional Theory. Chong DP, editor. Vol. 1. World Scientific; Singapore: 1995. p. 155. [Google Scholar]
- 52.Gross EUK. In: Density Functional Theory. Nalewajski RF, editor. Springer; Heidelberg: 1996. [Google Scholar]
- 53.Stratmann RE, Scuseria GE, Frish MJ. J Chem Phys. 1998;109:8218–8224. [Google Scholar]
- 54.Slater JC. The Self-Consistent Field for Molecules and Solids: Quantum Theory of Molecules and Solids. McGraw Hill; New York: 1974. [Google Scholar]
- 55.Slater JC. The Calculation of Molecular Orbitals. John Wiley & Sons; New York: 1979. [Google Scholar]
- 56.Baerends EJ, Ellis DE, Ros P. Chem Phys. 1973;2:41–51. [Google Scholar]
- 57.Versluis Louis, Ziegler Tom. J Chem Phys. 1988;88:322–328. [Google Scholar]
- 58.Te Velde G, Baerends EJ. J Comput Phys. 1992;99:84–98. [Google Scholar]
- 59.Vosko SH, Wilk L, Nusair M. Can J Phys. 1980;58:1200–1211. [Google Scholar]
- 60.Klamt A, Schuurmann G. J Chem Soc, Perkin Trans. 2;1993:799–805. [Google Scholar]
- 61.Klamt A. J Chem Phys. 1995;99:2224–2235. [Google Scholar]
- 62.Klamt A, Jonas V. J Chem Phys. 1996;105:9972–9981. [Google Scholar]
- 63.Gorelsky SI. AOMix: Program for Molecular Orbital Analysis. York University; Toronto, Canada: 1997. http://www.sg-chem.net/ [Google Scholar]
- 64.Gorelsky SI, Lever ABP. J Organomet Chem. 2001;635:187–196. [Google Scholar]
- 65.Orville AM, Lipscomb JD. J Biol Chem. 1989;264:8791–8801. [PubMed] [Google Scholar]
- 66.Neese F, Solomon EI. Inorg Chem. 1998;37:6568–6582. doi: 10.1021/ic980948i. [DOI] [PubMed] [Google Scholar]
- 67.Among the seven LMCT transitions observed in the UV/VIS Abs spectrum of resting 3,4-PCD, three have been assigned as Tyr408 –> Fe3+ LMCTs. Only two Tyr408 –> Fe3+ LMCTs are observed in the ES complex and the energies are different from those in the resting enzyme. (Figure S1) This can be attributed to changes in 1) the ligand system (Tyr447 and OH− vs catecholate) and 2) active site geometry from trigonal bipyramidal to square pyramidal.
- 68.Both are more symmetric than the 0.45Å difference observed in crystal structure. Our optimizations were done with fixed 2nd sphere residues and in vacuum. Removing the constraints on Arg increases the inequivalence to 0.27Å (BP86/LanL2DZ). If the Fe-OPCA bondlengths are fixed to 2.04Å and 2.49Å as in the crystal structure while the rest of the molecule is allowed to geometry optimize, the final geometric and electronic structures are essentially the same as those in our more symmetric model and the energy cost for this asymmetry is only 2.5 kcal/mol.
- 69.The wave function and electronic description obtained with BP86/LanL2DZ in Gaussian is qualitatively very similar to that obtained with the spectroscopically-calibrated protocol. Hence, we only present the calibrated results in here.
- 70.Although the Fe 4s orbital can overlap with the πip orbitals of PCA and Tyr to contribute in the bonding interactions, the energy difference between the 4s and ligand orbitals is large (~ 8 eV) and this restricts the amount of mixing (~2%).
- 71.Szilagyi RK, Metz M, Solomon EI. J Phys Chem A. 2002;106:2994–3007. [Google Scholar]
- 72.Schenk G, Pau MYM, Solomon EI. J Am Chem Soc. 2004;126:505–515. doi: 10.1021/ja036715u. [DOI] [PubMed] [Google Scholar]
- 73.Stephens PJ. J Chem Phys. 1970;52:3489–3516. [Google Scholar]
- 74.Stephens PJ. In: Eyring H, editor. Palo Alto, CA, USA: Annual Reviews; 1974. pp. 201–232. [Google Scholar]
- 75.Osborne GA, Stephens PJ. J Chem Phys. 1972;56:609–618. [Google Scholar]
- 76.Piepho SB, Schatz PN. Group Theory in Spectroscopy with Applications to Magnetic Circular Dichroism. John Wiley & Sons; New York: 1983. [Google Scholar]
- 77.Gerstman BS, Brill AS. J Chem Phys. 1985;82:1212–1230. [Google Scholar]
- 78.Yoon J, Solomon EI. Coord Chem Rev. 2006 (in press, available online) [Google Scholar]
- 79.Note the change in energy ordering of the acceptor orbitals in the Tyr πop to Fe3+ LMCT. This is due to excited state electronic relaxation and is observed in the TD-DFT calculations.
Associated Data
This section collects any data citations, data availability statements, or supplementary materials included in this article.
Supplementary Materials
Cartesian coordinates of the geometry optimized model of the 3,4-PCD-PCA active site with Gaussian BP86 and LanL2DZ (Table S1); Gaussian resolution and abs spectra of 3,4-PCD and 3,4-PCD-PCA (Fig S1); Overlay of the optimized 3,4-PCD-PCA structures with BP86 (LanL2DZ), BP86 + 10%HF exchange (TZVP) and BP86 + 10%HF exchange (6-31G*/3-21G*) (Fig S2); Graphical prediction of the signs of the C0-parameters of the Tyr and PCA → Fe3+ CT transitions (Fig S3); Complete reference for the Gaussian 03 package. This material is available free of charge via the Internet at http://pubs.acs.org.