

Abstract
Recent evidence indicates that agonist ligands of G protein coupled receptors (GPCR) can activate different signaling systems. Such “agonist-directed” signaling also occurs with opioid receptors. Previous work from our laboratory showed that chronic morphine, but not DAMGO, up-regulates the expression of Gα12 and that both morphine and DAMGO decreased Gαi3 expression in CHO cells expressing the cloned human mu opioid receptor. In this study, we tested the hypothesis that chronic opioid regulation of G protein expression is agonist-directed. Following a 20 h treatment of CHO cells expressing the cloned human mu (hMOR-CHO), delta (hDOR-CHO) or kappa (hKOR-CHO) opioid receptors with various opioid agonists, we determined the expression level of Gα12 and Gαi3 by Western blots. Among five mu agonists (morphine, etorphine, DADLE, DAMGO, herkinorin) tested with hMOR-CHO cells, only chronic morphine and etorphine up-regulated Gα12 expression. All five mu agonists decreased Gαi3 expression. Among six delta agonists (SNC80, DPDPE, deltorphin-1, morphine, DADLE, etorphine) tested with hDOR-CHO cells, all six agonists down-regulated Gαi3 expression or moderately up-regulated Gα12 expression. Among five kappa agonists, ((−)-ethylketocyclazocine, salvinorin A, U69,593, etorphine, (−)-U50,488) tested with hKOR-CHO cells, only chronic (−)-U50,488 and (−)-EKC up-regulated Gα12 expression. All kappa agonists decreased Gαi3 expression. These data demonstrate that chronic opioid agonist regulation of G protein expression depends not only on the agonist tested, but also on the type of opioid receptor expressed in a common cellular host, providing additional evidence for agonist-directed signaling
Keywords: Opioid, biased agonism, G protein, opioid receptor
Introduction
As postulated by Kenakin (Kenakin, 2003; Kenakin, 2005), all seven transmembrane receptors, such as β2-adrenergic receptors (Drake et al., 2008), are likely capable of adopting a range of distinct conformations, each of which can lead to the activation of distinct intracellular signaling pathways. The adoption of these distinct conformations can, in turn, be modulated by the presence of ligand. This ligand-related behavior has been termed “agonist-directed trafficking”, “stimulus trafficking”, “functional selectivity” and “biased agonism” (Clarke, 2005; Urban et al., 2007). Ligand-directed signaling to different cellular effector pathways extends drug effects from ligand-selective receptor conformations to the relationships between those conformations, cellular function, and ultimately therapeutics. Thus, it is possible to develop response-selective drugs that maximize therapeutic efficacy and minimize unwanted effects.
A growing body of evidence indicates that opioid receptor ligands demonstrate biased agonism. For example, Allouche et al. (Allouche et al., 1999) showed that δpeptide agonists and the non-peptide ligand, etorphine, activate different G protein subunits. Photolabeling of Gα-subunits with azidoanilido-[α-32P]GTP showed that constitutively active μ opioid receptors activate individual G proteins differently than those stimulated by DAMGO (Tyr-D-Ala-Gly-N-Me-Phe-Gly-ol) (Liu et al., 2001) and that peptide and non-peptide μ agonists induce different patterns of μ receptor phosphorylation (Chakrabarti et al., 1998). Moreover, opioid agonists differ in their ability to induce receptor internalization of μ (Koch et al., 2005), δ (Lecoq et al., 2004) and κ (Liu-Chen, 2004) opioid receptors. In this regard, recent studies showed that herkinorin (HERK) ((2S,4aR,6aR,7R,9S,10aS,10bR)-9-(benzoyloxy)-2-(3-furanyl)dodecahydro-6a,10b-dimethyl-4,10-dioxo-2H-naphtho-[2,1-c]pyran-7-carboxylic acid methyl ester) is a non-nitrogenous neoclerodane diterpene fully efficacious μ agonist (Harding et al., 2005), that, unlike DAMGO, does not promote β-arrestin recruitment and μ receptor internalization, even in cells that over express β-arrestin and the GPCR kinase, GRK2, (Groer et al., 2007). Other data indicated that although morphine does not promote β-arrestin recruitment and μ receptor internalization in CHO cells, it does promote μ receptor internalization in cells that over express β-arrestin and the GRK2 (Whistler and von Zastrow, 1998).
We previously reported that chronic treatment of CHO cells expressing the cloned human μ opioid receptor (hMOR-CHO) with morphine decreased the expression of Gαi2 (64%) and Gαi3 (60%), had no effect on Gαo expression, and, unexpectedly, increased Gα12 expression (66%). These changes did not occur in cells expressing a mutant μ opioid receptor (T394A-CHO) that do not develop morphine tolerance and dependence, indicating that morphine-induced changes in the expression of these G protein subunits are related to the development of tolerance and dependence (Xu et al., 2005).
With interest focused on Gαi3 and Gα12, more recent work supported the occurrence of biased agonism in hMOR-CHO cells treated chronically with different μ agonists (Xu et al., 2007). Of direct relevance to the present study, we demonstrated that after chronic (20 h) treatment of hMOR-CHO cells with DAMGO, morphine or HERK, only chronic morphine increased the expression level of Gα12 (Xu et al., 2005), a G protein that regulates downstream cytoskeletal proteins via its control of RhoA (Coughlin, 2000; Vogt et al., 2003). Numerous studies have documented that the small GTPase RhoA is involved in the regulation of various cellular functions such as remodeling of the actin cytoskeleton and induction of transcriptional activity. Gα12/Gα13 are the major upstream regulators of RhoA activity. The thrombin receptor 5 PAR-1 has been shown to couple to all three G protein families (Gα12/Gα13, Gαq and Gαi) and to regulate a substantial network of signaling pathways (Coughlin, 2000).
The ability of chronic morphine, but not chronic HERK or DAMGO, to upregulate Gα12 expression in hMOR-CHO cells, is an example of biased agonism. Thus, in the present study we further tested the hypothesis that chronic opioid-agonist regulation of G protein expression is agonist-directed using CHO cells that express the cloned human μ, δ or κ opioid receptors. Following a 20 h treatment of cells with chemically distinct opioid agonists, our data demonstrate that chronic opioid agonist regulation of G protein expression depends on the agonist tested, providing additional evidence for biased agonism.
Methods
Cell culture and crude membrane preparation
The recombinant CHO cells (hMOR-CHO hDOR-CHO, hKOR-CHO) were produced by stable transfection with the human opioid receptor cDNA, and provided by Dr. L. Toll (Toll et al., 1998). The cells were grown on plastic flasks in DMEM/F-12 (50%/50%) medium (hMOR-CHO) or in DMEM medium (hDOR-CHO and hKOR-CHO) containing 10% FBS, 100 units/ml penicillin, 100 μg/ml streptomycin and G-418 (0.20–0.25 mg/ml) under 95% air/5% CO2 at 37° C. We used a modified cell culture medium for experiments involving western blots for Gα12. Cells were grown in serum-free medium [DMEM/F-12 (50%/50%)], containing 10% FETALCLONE II (HyClone, SH30066.03), 100 units/ml penicillin, 100 μg/ml streptomycin and G-418 (0.20–0.25 mg/ml) under 95% air/5% CO2 at 37° C. Cell monolayers were harvested and homogenized by sonication in 50 mM Tris-HCl, pH 7.4, containing 4 μg/mL leupeptin, 2 μg/mL chymostatin, 10 μg/mL bestatin and 100 μg/mL bacitracin, The homogenate was centrifuged at 30,000 × g for 10 min at 4° C, and the supernatant discarded. The membrane pellets were resuspended in GTP-γ-S binding buffer (see below) and used for [35S]GTP-γ-S binding assays. For drug pretreatment experiments, the medium was changed, and then cells were incubated with various test drugs for 20 h in fresh medium. The drug concentrations used (~100–150 times the corresponding EC50 values determined with the [35S]-GTP-γ-S binding assay) were chosen to fully saturate the opioid receptors. Cells were washed three times with phosphate-buffered saline (PBS, pH 7.4) and harvested, and processed for various assays. This treatment produces tolerance to opioid drugs (Xu et al., 2003). Thus, in these experiments, we are reporting the effects of chronic drug exposure immediately after the withdrawal of the drug. Future experiments will be needed to determine the effect of the 20 h drug exposure at various time points after the withdrawal of the agonist.
[35S]-GTP-γ-S binding assays
[35S]-GTP-γ-S binding was determined as described previously (Xu et al., 2001). Briefly, test tubes received the following additions: 50 μl GTP-γ-S binding buffer (50 mM Tris-HCl, pH 7.4, containing 100 mM NaCl, 10 mM MgCl2, 1 mM EDTA), 50 μl GDP in binding buffer (final concentration = 50 μM), 50 μl drug in binding buffer/0.1% BSA (bovine serum albumin), 50 μl [35S]-GTP-γ-S in binding buffer (final concentration = 50 pM), and 300 μl of cell membranes (50 μg of protein) in buffer B (50 mM Tris-HCl, pH 7.4, containing 100 mM NaCl, 10 mM MgCl2, 1 mM EDTA, 1.67 mM DTT, 0.15% BSA). The final concentrations of reagents in the [35S]-GTP-γ-S binding assays were: 50 mM Tris-HCl, pH 7.4, containing 100 mM NaCl, 10 mM MgCl2, 1 mM EDTA, 1 mM DTT and 0.1 % BSA. Incubations proceeded for 2–3 h at 25° C (steady state). Nonspecific binding was determined using 40 μM GTP-γ-S. Bound and free [35S]-GTP-γ-S were separated by vacuum filtration with a Brandel Cell Harvester over Whatman GF/B filters. The filters were washed twice with ice-cold 10 mM Tris-HCl, pH 7.4, punched into the wells of 24-well plates to which was added 0.6 ml LSC-cocktail (CytoScint), and counted in a Trilux liquid scintillation counter at 60 % efficiency.
Cyclic AMP assays
Functional coupling of the cloned opioid receptor to adenylate cyclase was determined by measuring changes in the levels of cellular cAMP. The assay procedures followed the protocol provided in the CatchPoint Cyclic–AMP Fluorecent Assay Kit (a horseradish-peroxidase based competitive immunoassay kit, Molecular Devices). Briefly, cells were grown to 80% confluence in 96 well black-walled, clear bottom plates (Corning Incorporated, Corning, NY #3603) that had been treated with poly-L-lysine (50 μg/ml). After treatment with medium or drug for 20 h, cells were rinsed three times with 300 μl/well Krebs-Ringer Bicarbonate Buffer with glucose (KRBG, pH 7.4). KRBG containing 0.75 mM 3-isobutyl-1-methylxanthine and 1 mg/ml bovine serum albumin (KIB) and appropriate agonists was added to each well (90 μl). After a 30 min incubation at 37°C, 100 μM forskolin in KIB was added to each well in a volume of 10 μl. Cyclic AMP production was terminated 40 min later by the addition of 50 μl of a cell lysing solution (Molecular Devices Corporation, Sunnyvale, CA). This assay was sensitive between 0.1 and 10 pmoles cAMP in a 40 μl sample volume. A FlexStation II (Molecular Devices) was used to read and quantitate fluorescence intensity of the plate. Data from three experiments were analyzed using the program Prizm version 4 (GraphPad Software, San Diego, CA). Results are presented as the mean ± S.E.M.
Western blotting of G-protein α-subunits
For Western blot analysis of the G protein α-subunits, cell monolayers were harvested and homogenized by sonication in RIPA lysis buffer (1% Igepal CA-630, 0.5% sodium deoxycholate, 0.1% SDS, 1 mM PMSF, 10 mg/ml aprotinin, 1 mM sodium orthovanadate in PBS buffer, pH 7.4). Protein concentration was determined using the Pierce BCA Protein Assay Reagent Kit (Rockford, IL). Homogenates were diluted to a desired protein concentration with 2 × SDS-PAGE loading buffer (Invitrogen, Carlsbad, CA). Samples were boiled for 6 min and loaded into 8–16% polyacrylamide minigels (Invitrogen) for gel electrophoresis at 30 μg/lane. Since uniform amounts of protein were loaded into each lane, we did not routinely probe gels for housekeeping proteins such as α-actin. We conducted control experiments where a single sample was run on all 9 lanes of a single gel and assayed for the α-actinin protein expression. The results showed very low intra-assay variation in the immunoreactivity values (data not shown). Proteins from gel were transferred to Immobilon-PVDF membranes (Millipore Corp., Bedford, MA) using a semi-dry apparatus (Bio-Rad, Hercules, CA). Nonspecific binding to membranes was prevented by blocking for 60 min at room temperature with PBS/T (1 × PBS, 0.05% Tween 20) solution containing 5% nonfat dry milk. Membranes were then probed by overnight incubation (4° C) with 1:1000 dilution of rabbit polyclonal anti-G protein α-subunit antibodies (Calbiochem, La jolla, CA) with PBS/T solution containing 5% nonfat dry milk. Membranes were washed three times (15 min × 3 in PBS/T solution) and incubated with 1:5000 dilution of horseradish peroxidase conjugate secondary antibody in PBS/T solution, containing 0.25% nonfat dry milk, for 60 min at room temperature. After washing three more times, antibody complex was visualized by chemiluminescence using a kit from Pierce Biotechnology (Rockford, IL). Western blots were digitized and quantified using densitometric analysis (NIH Image software). Results from at least 3 experiments were analyzed using the program Prism Version 4 (GraphPad Software, San Diego, CA). Data are presented as mean ± SEM (n=3). Statistical significances were determined using the Student’s t-test.
Data Analysis and Statistics
As previously described (Xu et al., 2004), the percent stimulation of [35S]-GTP-γ-S binding was calculated according to the following formula: (S − B)/B × 100, where B is the basal level of [35S]-GTP-γ-S binding and S is the stimulated level of [35S]-GTP-γ-S binding. EC50 values (the concentration that produces fifty percent maximal stimulation of [35S]-GTP-γ-S binding) and Emax (% of maximal stimulation of [35S]-GTP-γ-S binding) were determined using the program MLAB-PC (Civilized Software, Bethesda, MD). The maximal stimulation was defined as the stimulation produced by 10,000 nM DAMGO (hMOR-CHO cells), 2,000 nM SNC80 (hDOR-CHO cells) and 10,000 nM (−)-U50,488 (hKOR-CHO cells). The results are mean ± SD from 3 experiments, with triplicate determinations in each experiment. The amount of cAMP in the samples was quantitated against a cAMP standard curve. Forskolin (100 μM)-stimulated cAMP formation in the absence of agonist was defined as 100%. The EC50 (the concentration of agonist that produces fifty percent inhibition of forskolin-stimulated cAMP formation) and Emax (% of maximal inhibition of forskolin-stimulated cAMP) were calculated using program Prizm Version 4 (GraphPad Software, San Diego, CA). Data are presented as mean ± SEM (n=3). Statistical significances were determined using the Student’s t-test.
Sources
[35S]GTP-γ-S (SA = 1,250 Ci/mmol) was obtained from DuPont NEN (Boston, MA). Various opioid peptides were provided by Multiple Peptide System via the Research Technology Branch, NIDA. HERK was synthesized as described previously (Harding et al., 2005). GTP-γ-S, GDP, forskolin and cAMP were obtained from Sigma Chemical Co. (St. Louis, MO), and CatchPoint Cyclic-AMP Fluorescent Assay Kits (catalog number R8088) were obtained from Molecular Devices (Sunnyvale, CA). For Western blots, antibody directed against Gi3 α-subunits [Gαi3 (catalog number 371729)] was purchased from Calbiochem (La Jolla, CA), and antibody directed against G12 α-subunit was purchased either from Calbiochem [Gα12 (catalog number 371778)] or from Santa Cruz (catalog number sc-409). Horseradish peroxidase-labeled secondary antibody was purchased either from Amersham Corp (catalog number RPN1004) (Arlington Heights, IL) or from Cell Signaling (catalog number 7074) (Danvers, MA). The sources of other agents are published (Xu et al., 2004).
Results
Initial experiments
The initial set of experiments was designed to determine the EC50 values of the test agents in the functional [35S]-GTP-γ-S binding assay (Table 1). In subsequent experiments, cells were then treated for 20 h with drug concentrations approximately 100–150 times the corresponding EC50 values in the [35S]-GTP-γ-S binding assay. The next series of experiments was conducted to further verify that the conditions of the chronic drug treatment used in this study produced opioid tolerance, as assessed by the forskolin-stimulated cAMP assay. As reported in Fig. 1 and Table 2, chronic DAMGO produced a 10-fold shift to the right in the DAMGO-dose response curve in hMOR-CHO cells. In the hDOR-CHO and hKOR-CHO cells, chronic agonist treatment almost eliminated the ability of SNC80 and (−)-U50,488 to inhibit forskolin-stimulated cAMP accumulation. From a pharmacological perspective, this flat curve induced by drug treatment represents the development of “complete” tolerance. This was probably due to a marked decrease in the magnitude of forskolin-stimulated cAMP accumulation following chronic SNC80 or (−)-U50,488 treatment (data not shown), reflecting the generation of constitutively active opioid receptors (Sadee et al., 2005; Xu et al., 2007). These initial experiments collectively show that the chronic agonist treatment used in this study produces a high degree of tolerance at all three types of opioid receptors.
Table 1.
Stimulation of [35S]GTP-γ-S Binding in the hMOR-CHO, hDOR-CHO and hKOR-CHO Cells: Agonist Potencies and Efficacies
| Compound | EC50 (nM ± SD) | EMAX (% of Maximal Stimulation ± SD) |
|---|---|---|
| HMOR-CHO cell | ||
| DAMGO | 12.8 ± 1.3 | 100 ± 2 |
| Morphine | 37 ± 6 | 86 ± 3 |
| Herkinorin | 92.5 ± 16.1 | 112 ± 4 |
| Etorphine | 0.92 ± 0.14 | 115 ± 4 |
| DADLE | 66 ± 13 | 96 ± 4 |
| hDOR-CHO cell | ||
| SNC80 | 1.92 ± 0.26 | 100 ± 2 |
| DPDPE | 3.50 ± 0.61 | 100 ± 2 |
| DELT-1 | 3.33 ± 0.51 | 105 ± 2 |
| Morphine | 851 ± 103 | 57 ± 2 |
| DADLE | 13.7 ± 2.40 | 80 ± 2 |
| Etorphine | 8.08 ± 1.38 | 60 ± 2 |
| hKOR-CHO cell | ||
| (−)-EKC | 1.03 ± 0.13 | 107 ± 18 |
| Salvinorin A | 3.72 ± 0.42 | 103 ± 0.2 |
| U69,593 | 22.0 ± 5.8 | 101 ± 0.2 |
| Etorphine | 0.82 ± 0.08 | 98 ± 0.2 |
| (−)-U50,488 | 8.76 ± 0.74 | 100 ± 0.2 |
[35S]-GTP-γ-S binding assays were conducted as described in Methods. Each value is the mean ± SD (n=3).
Figure 1.
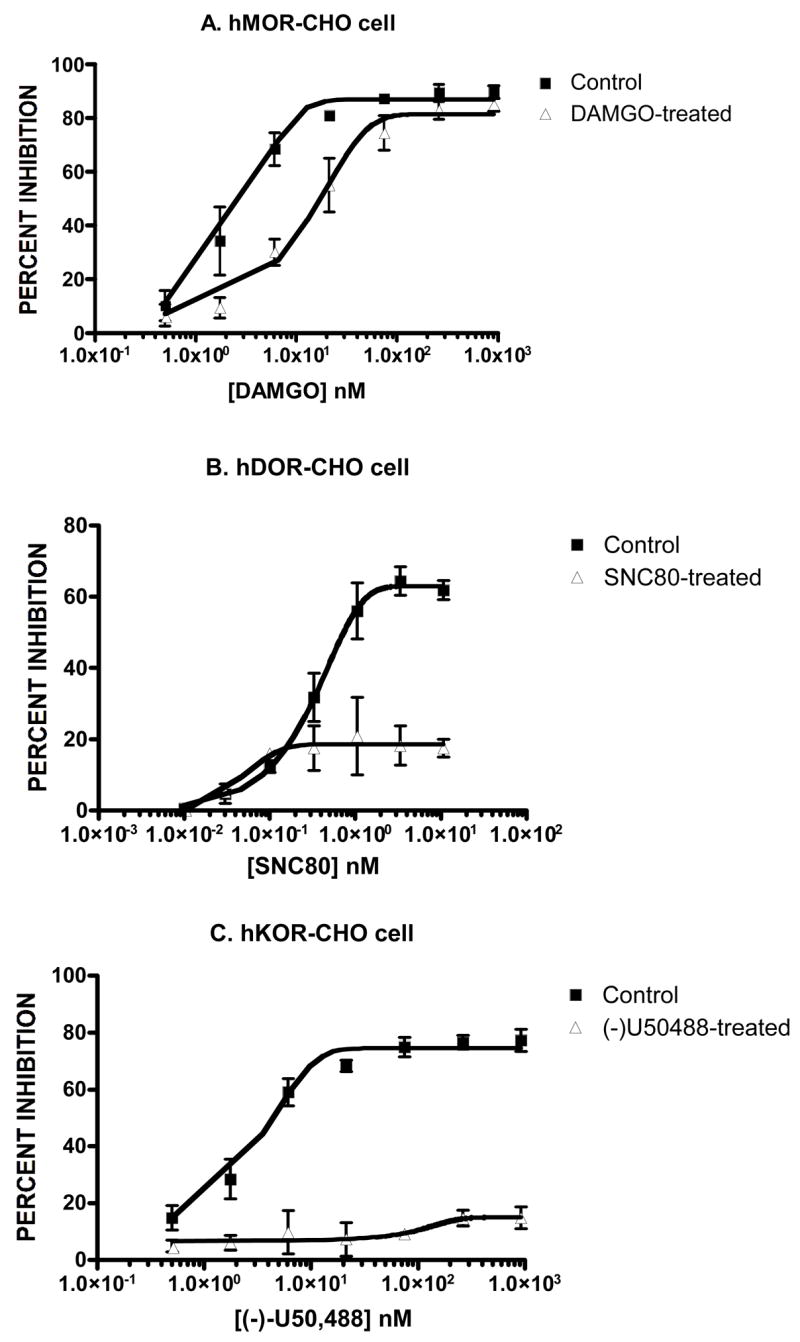
Development of opioid tolerance. hMOR-CHO cells (Panel A), hDOR-CHO cells (Panel B) and hKOR-CHO cells (Panel C) were treated for 20 h with DAMGO (1 μM), SNC80 (0.5 μM) and (−)-U50,488 (1.7 μM), respectively. The ability of opioid agonists to inhibit forskolin-stimulated cAMP accumulation was assessed as described in Methods. The resulting analysis (mean ± SEM) of these dose-response curves is reported in Table 2.
Table 2.
Effect of Chronic Agonist Treatment on Agonist-Inmduced Inhibition of Forskolin-stimulated cAMP Accumulation
| Pretreatment | EC50 (nM) | Emax (% max inhibition) |
|---|---|---|
| hMOR-CHO Cells | ||
| Control | 1.92±0.66 | 90±1 |
| DAMGO | 19.3±11* | 88±12 |
| hDOR-CHO cells | ||
| Control | 0.51±0.19 | 69±2 |
| SNC80 | flat | flat |
| hKOR-CHO Cells | ||
| Control | 2.48±0.39 | 76±3 |
| (−)-U50,488 | flat | flat |
Each value is the mean ± SEM (n=3).
p < 0.05, when compared with control (two-tailed Student’s t-test).
Experiments with hMOR-CHO cells
Previous data showed that exposure to μ opioid agonists (DAMGO, morphine or HERK) produced cellular changes associated with development of opioid tolerance (Xu et al., 2005; Xu et al., 2007). For this study, we chose five μ agonists of diverse structure, including two peptide ligands (DAMGO, DADLE), and three non-peptide ligands (morphine, HERK and etorphine). As reported in Table 1, all five agonists stimulated [35S]-GTP-γ-S binding with EMAX values that ranged from 86% to 115%. hMOR-CHO cells were treated for 20 h with five μ agonists and Western blots were performed as described in Methods. As reported in Fig. 2A, all five agonists down-regulated Gαi3 expression to a similar extent. Of the five agonists tested, only chronic morphine and etorphine up-regulated Gα12 expression; the other three μ agonists did not alter Gα12 expression (Fig. 2B). As shown in Fig. 2C, the Gα12 antibody we used is selective for a band with the appropriate MW (~ 42 kD), so it does indeed detect Gα12 under our assay conditions.
Figure 2.

Effect of chronic agonist treatment of hMOR-CHO cells on the expression of Gαi3 (panel A) or Gα12 (panel B). Results are expressed as mean ± SEM (n=3). Representative Western blots for Gαi3 and Gα12 are shown. *p < 0.05 when compared with control (two-tailed Students t-test). We used the following drug concentrations for chronic treatment: DAMGO (1 μM), morphine (10 μM), HERK (10 μM), etorphine (100 nM), DADLE (10 μM). Panel C demonstrates the specificity of the Gα12 antibody for detecting Gα12 in the control-, morphine- or etorphine-treated hMOR-CHO cells. The antibody is selective for a band with the appropriate MW (about 42 kD).
Experiments with hDOR-CHO cells
We chose six δ agonists of diverse structure for this experiment, including three peptide ligands (DADLE, DPDPE [H-Tyr-D-Pen-Gly-Phe-D-Pen-OH], DELT-1 [Tyr-D-Ala-Phe-Asp-Val-Val-Gly-NH2]), and three non-peptide ligands (morphine, SNC80 and etorphine). DADLE, morphine and etorphine, which were also tested in the hMOR-CHO cells, had lower efficacy in the hDOR-CHO cells than the other δ agonists: 80%, 57% and 60%, respectively (Table 1). hDOR-CHO cells were treated for 20 h with six αagonists and Western blots were performed as described in Methods. All six agonists down-regulated Gαi3 expression to similar extents (Fig. 3A) and all agonists except etorphine produced moderate increases in Gα12 expression (Fig. 3B).
Figure 3.
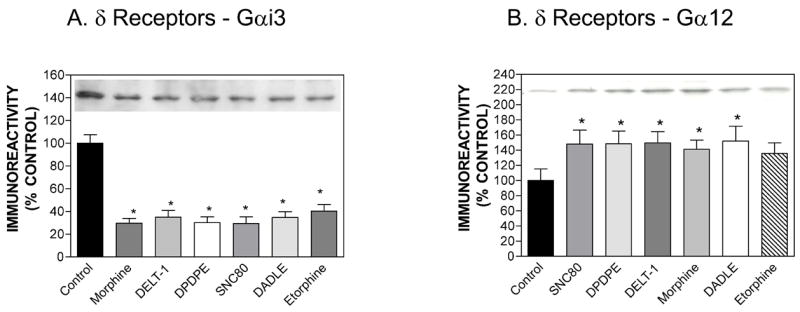
Effect of chronic agonist treatment of hDOR-CHO cells on the expression of Gαi3 (panel A) or Gα12 (panel B). Results are expressed as mean ± SEM (n=3). Representative Western blots for Gαi3 and Gα12 are shown. *p < 0.05 when compared with control (two-tailed Student’s t-test). We used the following drug concentrations for chronic treatment: SNC80 (0.31 μM), DPDPE (1 μM), DELT-1 (0.23 μM), morphine (50 μM), DADLE (1 μM) and etorphine (0.6 μM).
Experiments with hKOR-CHO cells
We chose five κ agonists of diverse structure for these experiments: (−)-EKC, Salvinorin A, U69,593, (−)-U50,488 and etorphine. As reported in Table 1, these agonists stimulated [35S]-GTP-γ-S binding with EMAX values of ~100%. hKOR-CHO cells were treated for 20 h with five κ agonists and Western blots were performed as described in Methods. As reported in Fig. 4A, all agonists down-regulated Gαi3 (Fig. 4A), and only chronic (−)-U50,488 and (−)-EKC up-regulated Gα12 (Fig. 4B).
Figure 4.
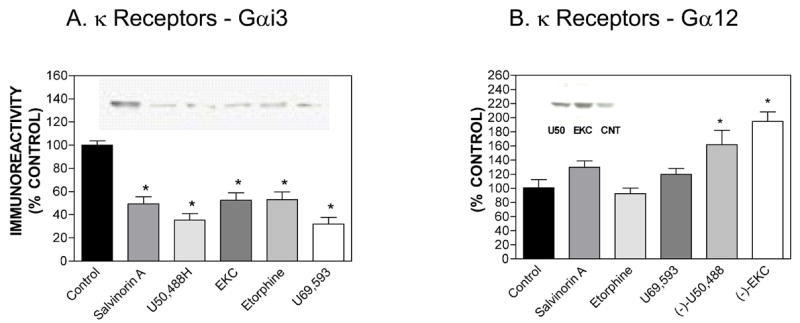
Effect of chronic agonist treatment of hKOR-CHO cells on the expression of Gαi3 (panel A) or Gα12 (panel B). Results are expressed as mean ± SEM (n=3). Representative Western blots for Gαi3 and Gα12 are shown. *p < 0.05 when compared with control (two-tailed Student’s t-test). We used the following drug concentrations for chronic treatment: (−)-EKC (0.25 μM), Salvinorin A (0.5 μM), U69,593 (3.7 μM), etorphine (0.1 μM) and (−)-U50,488 (1.7 μM).
Discussion
The occurrence of biased agonism is well established for many GPCRs (Clarke, 2005; Kenakin, 2003). However, the mechanisms and functional consequences of agonist-directed signaling remain to be clarified. Because of the role that receptor internalization plays in opioid receptor desensitization and opioid tolerance, studies of biased agonism, with the end-point of receptor internalization, is a subject of contemporary interest. Opioid agonists, for example, differ in their ability to induce receptor internalization of μ (Koch et al., 2005), δ (Lecoq et al., 2004) and κ (Liu-Chen, 2004) opioid receptors. A striking example of this is the recently described μ agonist HERK which, unlike DAMGO and other internalizing μ opioid agonists, does not recruit β-arrestin and promote μ receptor internalization, even in cells that over express β-arrestin and the GPCR kinase, GRK2, (Groer et al., 2007).
We recently reported that chronic morphine treatment of hMOR-CHO cells decreased the expression of Gαi2 (64%) and Gαi3 (60%), had no effect of Gαo and, unexpectedly, increased Gα12 (66%) expression in hMOR-CHO cells, but not in cells expressing a mutant μ opioid receptor (T394A-CHO) that does not develop morphine tolerance and dependence. This was a surprising finding, since opioid receptors do not signal via Gα12 under normal conditions. Numerous studies have documented that the small GTPase RhoA is involved in the regulation of various cellular functions such as remodeling of the actin cytoskeleton and induction of transcriptional activity. Gα12 and Gα13 are the major upstream regulators of RhoA activity (Coughlin, 2000). Consistent with these known activities of RhoA, our data demonstrated that chronic morphine increased the expression of Gα12 and the structural protein α-actinin in hMOR-CHO cells. Importantly, we also showed that chronic morphine increased expression of Gα12 and α-actinin in mouse brain (Xu et al., 2005). In light of data showing that repeated exposure to drugs of abuse, including morphine, caused persistent structural changes in brain (Robinson and Kolb, 2004), our data suggested, but did not prove, that chronic morphine-induced up-regulation of Gα12 might be an important mechanism contributing to the long-term effects of morphine on brain function and structure.
In a subsequent study (Xu et al., 2007), we were surprised to observe that chronic treatment of hMOR-CHO cells with the μ agonists, DAMGO and HERK, did not alter expression of Gα12, an observation suggestive of biased agonism, where the endpoint is the expression level of Gα12. Thus, in the present study we further tested the hypothesis that chronic opioid-agonist regulation of G protein expression is agonist-directed, focusing on the expression level of G protein subunits (Gα12 and Gαi3).
Our data show that the ability to regulate expression of Gα12 by chronic opioids treatment depends not only on the agonist used, but also on which opioid receptor is expressed in the CHO cell. For example, numerous studies document that etorphine is a potent and wide spectrum opioid agonist. As reported in Table 1, the EC50 values of etorphine in hMOR-CHO, hDOR-CHO and hKOR-CHO cells are 0.92, 8.08 and 0.82 nM, respectively. Chronic etorphine had no significant effect on Gα12 expression in hDOR-CHO and hKOR-CHO cells, but increased Gα12 expression in hMOR-CHO cells. In hMOR-CHO cells, only chronic etorphine and morphine altered Gα12 expression, and in hKOR-CHO cells, only (−)-U50,488 and (−)-EKC increased Gα12 expression.
The ability of a μ agonist to up-regulate Gα12 expression in hMOR-CHO cells is not related to the ability of the agonist to recruit β-arrestin and internalize the μ receptor, since DAMGO, an internalizing agonist, and HERK, a non-internalizing agonist, fail to alter Gα12 expression. In the case of hKOR-CHO cells, U50,488H, U69,593, dynorphin A(1–17), EKC and tifluadom promote internalization of the human KOR, but etorphine or levorphanol do not (Liu-Chen, 2004). However, our data here showed that only (−)-U50,488 and (−)-EKC up-regulate Gα12 expression, indicating that the ability of κagonists to induce κ opioid receptor internalization is unrelated to the ability of the same agonists to up-regulate Gα12 expression.
In contrast to the varied effects of chronic opioid agonist treatment on Gα12 expression, our data showed that all treatments down-regulated Gαi3 expression. Since opioid ligands signal primarily through Gαi3 in CHO cells (Xu et al., 2005), this finding suggests that chronic opioid-induced down-regulation of Gαi3 may contribute to the development of opioid tolerance.
Viewed collectively, our data demonstrate that chronic opioid agonist regulation of G protein expression depends on the agonist tested, providing additional evidence for biased agonism.
Acknowledgments
This research was supported by the Intramural Research Program of the NIH, National Institute on Drug Abuse and funding NIDA grant DA018151 to Dr. Prisinzano.
Non-standard abbreviations
- CHO cells
chinese hamster ovary cells
- hMOR-CHO
CHO cells expressing the cloned human μ opioid receptor
- hDOR-CHO
CHO cells expressing the cloned human δ opioid receptor
- hKOR-CHO
CHO cells expressing the cloned human κ opioid receptor
- DAMGO
Tyr-D-Ala-Gly-N-Me-Phe-Gly-ol
- Herkinorin
(2S,4aR,6aR,7R,9S,10aS,10bR)-9-(Benzoyloxy)-2-(3-furanyl)dodecahydro-6a,10b-dimethyl-4,10-dioxo-2H-naphtho-[2,1-c]pyran-7-carboxylic Acid Methyl Ester
- SNC80
4-(alpha-(4-allyl-2,5-dimethyl-1-piperazinyl)-3-methoxybenzyl)-N,N-diethylbenzamide
- DADLE
H-Tyr-D-Ala-Gly-Phe-D-Leu-OH
- DPDPE
H-Tyr-D-Pen-Gly-Phe-D-Pen-OH
- DELT-1
Tyr-D-Ala-Phe-Asp-Val-Val-Gly-NH2
- (−)-EKC
(−)-ethylketocyclazocine
- (−)-U50
488, (trans)-3,4-dichloro-N-methyl-N-[2-(1-pyrrolidinyl)-cyclohexyl]-benzene-acetamide methane sulfonate
- U69
593, (+)-(5α,7α,8β)-N-methyl-N-[7-(1-pyrrolidinyl)-1-oxaspiro[4,5]dec-8-yl]benzeneacetamide
- [35S]GTP-γ-S
guanosine 5′-O-(3-[35S]thio)triphosphate
- cAMP
adenosine 3′,5′-cyclic monophosphate
Footnotes
The authors have no conflict of interest
References
- Allouche S, Polastron J, Hasbi A, Homburger V, Jauzac P. Differential G-protein activation by alkaloid and peptide opioid agonists in the human neuroblastoma cell line SK-N-BE. Biochem J. 1999;342(Pt 1):71–8. [PMC free article] [PubMed] [Google Scholar]
- Chakrabarti S, Law PY, Loh HH. Distinct differences between morphine- and [D-Ala2,N-MePhe4,Gly-ol5]-enkephalin-mu-opioid receptor complexes demonstrated by cyclic AMP-dependent protein kinase phosphorylation. J Neurochem. 1998;71:231–9. doi: 10.1046/j.1471-4159.1998.71010231.x. [DOI] [PubMed] [Google Scholar]
- Clarke WP. What’s for lunch at the conformational cafeteria? Mol Pharmacol. 2005;67:1819–21. doi: 10.1124/mol.105.013060. [DOI] [PubMed] [Google Scholar]
- Coughlin SR. Thrombin signalling and protease-activated receptors. Nature. 2000;407:258–64. doi: 10.1038/35025229. [DOI] [PubMed] [Google Scholar]
- Drake MT, Violin JD, Whalen EJ, Wisler JW, Shenoy SK, Lefkowitz RJ. Beta-arrestin-biased agonism at the beta2-adrenergic receptor. J Biol Chem. 2008;283:5669–76. doi: 10.1074/jbc.M708118200. [DOI] [PubMed] [Google Scholar]
- Groer CE, Tidgewell K, Moyer RA, Harding WW, Rothman RB, Prisinzano TE, Bohn LM. An opioid agonist that does not induce mu-opioid receptor beta-arrestin interactions or receptor internalization. Mol Pharmacol. 2007;71:549–57. doi: 10.1124/mol.106.028258. [DOI] [PMC free article] [PubMed] [Google Scholar]
- Harding WW, Tidgewell K, Byrd N, Cobb H, Dersch CM, Butelman ER, Rothman RB, Prisinzano TE. Neoclerodane diterpenes as a novel scaffold for mu opioid receptor ligands. J Med Chem. 2005;48:4765–4771. doi: 10.1021/jm048963m. [DOI] [PubMed] [Google Scholar]
- Kenakin T. Ligand-selective receptor conformations revisited: the promise and the problem. Trends Pharmacol Sci. 2003;24:346–54. doi: 10.1016/S0165-6147(03)00167-6. [DOI] [PubMed] [Google Scholar]
- Kenakin T. New concepts in drug discovery: collateral efficacy and permissive antagonism. Nat Rev Drug Discov. 2005;4:919–27. doi: 10.1038/nrd1875. [DOI] [PubMed] [Google Scholar]
- Koch T, Widera A, Bartzsch K, Schulz S, Brandenburg LO, Wundrack N, Beyer A, Grecksch G, Hollt V. Receptor endocytosis counteracts the development of opioid tolerance. Mol Pharmacol. 2005;67:280–7. doi: 10.1124/mol.104.004994. [DOI] [PubMed] [Google Scholar]
- Lecoq I, Marie N, Jauzac P, Allouche S. Different regulation of human delta-opioid receptors by SNC-80 [(+)-4-[(alphaR)-alpha-((2S,5R)-4-allyl-2,5-dimethyl-1-piperazinyl)-3-methoxybenzyl]-N,N-diethylbenzamide] and endogenous enkephalins. J Pharmacol Exp Ther. 2004;310:666–77. doi: 10.1124/jpet.103.063958. [DOI] [PubMed] [Google Scholar]
- Liu JG, Ruckle MB, Prather PL. Constitutively active mu-opioid receptors inhibit adenylyl cyclase activity in intact cells and activate G-proteins differently than the agonist [D-Ala2,N-MePhe4,Gly-ol5]enkephalin. J Biol Chem. 2001;276:37779–86. doi: 10.1074/jbc.M106104200. [DOI] [PubMed] [Google Scholar]
- Liu-Chen LY. Agonist-induced regulation and trafficking of kappa opioid receptors. Life Sci. 2004;75:511–36. doi: 10.1016/j.lfs.2003.10.041. [DOI] [PubMed] [Google Scholar]
- Robinson TE, Kolb B. Structural plasticity associated with exposure to drugs of abuse. Neuropharmacology. 2004;47(Suppl 1):33–46. doi: 10.1016/j.neuropharm.2004.06.025. [DOI] [PubMed] [Google Scholar]
- Sadee W, Wang D, Bilsky EJ. Basal opioid receptor activity, neutral antagonists, and therapeutic opportunities. Life Sci. 2005;76:1427–37. doi: 10.1016/j.lfs.2004.10.024. [DOI] [PubMed] [Google Scholar]
- Toll L, Berzetei-Gurske IP, Polgar WE, Brandt SR, Adapa ID, Rodriguez L, Schwartz RW, Haggart D, O’Brien A, White A, Kennedy JM, Craymer K, Farrington L, Auh JS. Standard binding and functional assays related to medications development division testing for potential cocaine and opiate narcotic treatment medications. NIDA Res Monogr. 1998;178:440–466. [PubMed] [Google Scholar]
- Urban JD, Clarke WP, von Zastrow M, Nichols DE, Kobilka BK, Weinstein H, Javitch JA, Roth BL, Christopoulos A, Sexton P, Miller K, Spedding M, Mailman RB. Functional selectivity and classical concepts of quantitative pharmacology. J Pharmacol Exp Ther. 2007;320:1–13. doi: 10.1124/jpet.106.104463. [DOI] [PubMed] [Google Scholar]
- Vogt S, Grosse R, Schultz G, Offermanns S. Receptor-dependent RhoA activation in G12/G13-deficient cells: genetic evidence for an involvement of Gq/G11. J Biol Chem. 2003;278:28743–9. doi: 10.1074/jbc.M304570200. [DOI] [PubMed] [Google Scholar]
- Whistler JL, von Zastrow M. Morphine-activated opioid receptors elude desensitization by beta-arrestin. Proc Natl Acad Sci U S A. 1998;95:9914–9. doi: 10.1073/pnas.95.17.9914. [DOI] [PMC free article] [PubMed] [Google Scholar]
- Xu H, Hashimoto A, Rice KC, Jacobson AE, Thomas JB, Carroll FI, Lai J, Rothman RB. Opioid peptide receptor studies. 14. Stereochemistry determines agonist efficacy and intrinsic efficacy in the [35S]GTP-gamma-S functional binding assay. Synapse. 2001;39:64–69. doi: 10.1002/1098-2396(20010101)39:1<64::AID-SYN9>3.0.CO;2-J. [DOI] [PubMed] [Google Scholar]
- Xu H, Lu YF, Rothman RB. Opioid peptide receptor studies. 16. Chronic morphine alters G-protein function in cells expressing the cloned mu opioid receptor. Synapse. 2003;47:1–9. doi: 10.1002/syn.10144. [DOI] [PubMed] [Google Scholar]
- Xu H, Wang X, Wang J, Rothman RB. Opioid peptide receptor studies. 17. Attenuation of chronic morphine effects after antisense oligodeoxynucleotide knock-down of RGS9 protein in cells expressing the cloned mu opioid receptor. Synapse. 2004;52:209–17. doi: 10.1002/syn.20019. [DOI] [PubMed] [Google Scholar]
- Xu H, Wang X, Zimmerman D, Boja ES, Wang J, Bilsky EJ, Rothman RB. Chronic morphine up-regulates G{alpha}12 and cytoskeletal proteins in chinese hamster ovary cells expressing the cloned mu opioid receptor. J Pharmacol Exp Ther. 2005;315:248–55. doi: 10.1124/jpet.105.089367. [DOI] [PubMed] [Google Scholar]
- Xu H, Partilla JS, Wang X, Rutherford JM, Tidgewell K, Prisinzano TE, Bohn LM, Rothman RB. A comparison of noninternalizing (herkinorin) and internalizing (DAMGO) mu-opioid agonists on cellular markers related to opioid tolerance and dependence. Synapse. 2007;61:166–75. doi: 10.1002/syn.20356. [DOI] [PubMed] [Google Scholar]