

Abstract
Objective
Obesity and being overweight during adulthood have been consistently linked to increased risk for development of dementia later in life, especially Alzheimer's disease. They have also been associated with cognitive dysfunction and brain structural alterations in otherwise healthy adults. Although proton magnetic resonance spectroscopy may distinguish between neuronal and glial components of the brain and may point to neurobiological mechanisms underlying brain atrophy and cognitive changes, no spectroscopic studies have yet assessed the relationships between adiposity and brain metabolites.
Methods
We have utilized magnetic resonance imaging and proton magnetic resonance spectroscopic imaging data from 50 healthy middle-aged participants (mean age, 41.7 ± 8.5 years; 17 women), who were scanned as control subjects for another study.
Results
After adjustment for age and sex, greater body mass indices (BMIs) correlated with: (1) lower concentrations of N-acetylaspartate (spectroscopic marker of neuronal viability) in frontal (p = 0.001), parietal (p = 0.006), and temporal (p = 0.008) white matter; (2) lower N-acetylaspartate in frontal gray matter (p = 0.01); and (3) lower concentrations of choline-containing metabolites (associated with membrane metabolism) in frontal white matter (p = 0.05).
Interpretation
These results suggest that increased BMI at midlife is associated with neuronal and/or myelin abnormalities, primarily in the frontal lobe. Because white matter in the frontal lobes is more prone to the effects of aging than in other lobes, our results may reflect accelerated aging in individuals with high levels of adiposity. Thus, greater BMI may increase the odds of developing an age-related disease, such as Alzheimer's disease.
Brain atrophy and lower concentration of N-acetylaspartate (NAA; marker of neuronal viability), especially in temporal lobes and hippocampus, are among risk factors for cognitive decline and dementia in elderly adults.1,2 Recent epidemiological studies have associated midlife adiposity with increased risk for dementia later in life, especially Alzheimer's disease (AD).3,4 In particular, they made the following associations: (1) atrophy of temporal lobes and greater prevalence of dementia in elderly women with consistently greater body mass index (BMI; an indicator of body adiposity) throughout adulthood5; (2) brain atrophy with greater BMI in male and female adults in their 50s6; and (3) smaller hippocampal volumes in elderly adults with larger waist/hip ratio (a measure of body fat distribution).7 Moreover, several epidemiological studies have identified increased BMI in middle age as a risk factor for diagnosis of dementia a few decades later, especially in women.8–10 These studies generally accounted for comorbid conditions such as hypertension, diabetes mellitus, among others,4 suggesting that body fat necessarily has detrimental effects on brain integrity and function. Adiposity appears to have functional relevance because studies found worse learning, memory, and executive functioning in obese versus nonobese older adults.11–13 In addition, Gunstad and colleagues,14 in a study among young and middle-aged healthy adults, associated being overweight or obese with executive dysfunction.
Alterations of brain morphology were also found in overweight and obese young adults.15,16 Pannacciulli and coworkers15 demonstrated focal gray matter (GM) volume reductions especially in frontal lobe accompanied by enlarged volumes of orbitofrontal white matter (WM), whereas Haltia and coworkers16 demonstrated only significantly enlarged WM volumes in several basal brain regions that got smaller with dieting. This suggests that brain neurobiological and functional alterations in individuals with high levels of adiposity may be present decades before the onset of dementia.
Given there are 1 billion overweight and 300 million obese individuals worldwide,17 and considering the significantly increasing prevalence of these conditions worldwide18 and in the United States,19 research into the effects of adipose tissue on the brain may play a significant role in understanding the processes that lead to dementia.
Although proton magnetic resonance spectroscopy can distinguish between neuronal and glial components of the brain and give insight into brain metabolism, no studies have assessed the association between any markers of adiposity at middle age and spectroscopic markers of brain integrity. We used proton magnetic resonance spectroscopic imaging at short-echo time to measure the concentrations of four major brain metabolites20,21: (1) NAA, an accepted marker of neuronal viability, observed only in mature neurons and their processes, decreased NAA reflects neuronal loss, atrophied dendrites and axons, and/or derangements in neuronal energetics; (2) choline-containing compounds (Cho), which are believed to be primarily involved in cell membrane breakdown and synthesis; (3) creatine-containing metabolites (Cr) involved in cell bioenergetics; and (4) myo-inositol (m-Ino), which is considered a marker of glial cell numbers and an osmoregulator.
Given the epidemiological associations between midlife adiposity and risk for dementia later in life, the cognitive and neurobiological abnormalities in individuals with high levels of adiposity may reflect risk factors and/or processes that lead to dementia. To further these results, we evaluated the relationships of self-reported BMI to mean concentrations of NAA, Cho, Cr, and m-Ino in GM and WM of the frontal, parietal, temporal, and occipital lobes and to GM, WM, and cerebrospinal fluid volumes of these lobes in a group of healthy middle-aged adults.
Subjects and Methods
Subjects
Fifty healthy middle-aged (mean age, 41.7 ± 8.5 years) individuals (17 women, 34%) were recruited from the San Francisco Bay Area. They served as human immunodeficiency virus–negative control participants in a study describing the effects of human immunodeficiency virus and alcohol use disorder on the central nervous system.22,23 They were free of any medical conditions known or suspected to affect brain morphology and metabolism, and drank less than 40 standard alcoholic drinks per month. A standard drink contains 13.6g of pure ethanol, equivalent of 12 ounces beer, 5 ounces wine, or 1.5 ounces liquor. BMI was calculated as weight in kilograms divided by height in meters squared that were obtained by self-report. BMI ranged between 18.7 and 36.8kg/m2; that is, participants were at normal weight (18.5 < BMI < 25), overweight (25 < BMI < 30), or obese (BMI > 30). The American National Adult Reading Test estimated verbal intelligence,24 and Beck Depression Inventory assessed current depressive symptomatology.25 Alcohol consumption was assessed via lifetime drinking history.26 Frequency of cigarette smoking over 6 months before study was assessed with an in-house self-report questionnaire. Participants were considered smokers if they reported smoking more than twice a month. All participants gave written informed consent to all procedures approved by the institutional review boards of the University of California San Francisco and the San Francisco Veterans Affairs Medical Center.
Data Acquisition and Processing
All magnetic resonance data were obtained on a standard 1.5-Tesla magnetic resonance system (Siemens Vision, Iselin, NJ). Structural magnetic resonance imaging data were obtained with magnetization-prepared, rapid, gradient-echo images acquired with TR/TE/TI = 10/7/300 milliseconds, 15-degree flip angle, oblique-coronal, 1 × 1mm2 in-plane resolution, and 1.5mm-thick coronal partitions yielded T1-weighted images. Magnetic resonance imaging was followed by automated head shimming and multislice short-TE proton magnetic resonance spectroscopic imaging (TR/TE/TI = 1,800/25/165 milliseconds).27 Spectra were acquired in 3 oblique-axial parallel planes, each 15mm thick, and 6mm apart. For structural analyses, probability maps of GM, WM, and cerebrospinal fluid within frontal, parietal, temporal, and occipital lobes were obtained from T1-weighted images by combining three-tissue probabilistic segmentation and masks of major lobes as previously described.22 Processing details for spectroscopic data were described previously.23,28 The outcome measures were absolute, mean, atrophy-corrected metabolite concentrations for two tissue types (GM and WM) in four major lobes. They were expressed in institutional units, not in molar units, to avoid possibly inaccurate assumptions about relaxation times.
An experienced neuroradiologist examined all images for evidence of any cerebrovascular disease or structural abnormalities. No participant had early confluent or confluent areas of WM signal hyperintensities. The volumes of WM signal hyperintensities were estimated to be less than 1% of the individual's total WM volume.29
Statistical Analysis
To account for age-related decreases in brain volumes,30 age-related increases in BMI5 (in our cohort, greater BMI tended to correlate with older age at ρ = 0.21; p = 0.07), and potential age-related changes in metabolite concentrations,31 we utilized a linear modeling approach, with BMI, age, and sex used as predictor variables. To control for interparticipant differences in head size, we used total intracranial volume, defined as sum of all GM, WM, and cerebrospinal fluid volumes, as predictor of brain volumes. Sex by BMI interactions (accounting for potentially larger effects of adiposity on the female brain) were not significant for any brain volume or any metabolite concentration in any region and were not included in the model.
To correct for multiple comparisons, we multiplied the significance levels of BMI and sex by the number of evaluated regions for each metabolite (GM and WM in four major lobes = eight regions). For volumetric measures, the significance levels for BMI were not corrected for multiple comparisons and are reported only for qualitative comparison with other studies. A significance level of p < 0.05 (after correction for multiple comparisons) was considered statistically significant.
For illustration, we also report Spearman's correlation coefficients between magnetic resonance measures and BMI. All analyses were implemented in S-PLUS 6.0 (Insightful Corporation, Seattle, WA) and SPSS-12.0 for Windows (SPSS, Chicago, IL).
Results
Ten percent of our study participants was classified as obese (BMI > 30; n = 5; 3 women), 30% overweight (25 < BMI < 30; n = 15; 4 women), and 60% were at normal weight (18.5 < BMI < 25; n = 30; 10 women). No participant was classified as underweight. Seventy-two percent of participants was white, 12% Latino, and 6% Asian. One participant was black, one Polynesian, and three participants did not disclose their ethnicities. Men and women had similar age, education level, and BMI. There were no significant differences in age, education level, American National Adult Reading Test score, current depressive symptomatology (Beck Depression Inventory), and height among participants classified as normal, overweight, or obese (all p > 0.25; compare Table). Kolmogorov–Smirnov tests demonstrated that the distributions of the metabolite concentrations and volumes did not significantly depart from normality.
Table. Comparison of Demographic Variables between Participants Classified as Normal, Overweight, and Obese.
| Variables | Normal | Overweight | Obese |
|---|---|---|---|
| n (female sex) | 30 (10) | 15 (4) | 5 (3) |
| Age, yr | 40.4 ± 9.3 | 44.0 ± 7.6 | 44.9 ± 7.2 |
| Education, yr | 15.5 ± 2.2 | 15.7 ± 2.2 | 15.4 ± 1.8 |
| Height, m | 1.74 ± 0.10 | 1.75 ± 0.07 | 1.69 ± 0.14 |
| Weight, kg | 67.6 ± 8.2 | 83.5 ± 8.6 | 93.9 ± 22.7 |
| BMI, kg/m2 | 22.4 ± 1.7 | 27.2 ± 1.7 | 32.4 ± 2.6 |
| Average number of alcoholic drinks per month over lifetime | 9.98 ± 9.74 | 14.5 ± 8.4 | 20.8 ± 17.6 |
| Average number of alcoholic drinks in the week before study | 1.15 ± 1.18 | 1.33 ± 0.75 | 1.24 ± 0.77 |
| AMNART score | 1.22 ± 0.47 | 1.28 ± 0.41 | 1.16 ± 0.72 |
| BDI score | 5.4 ± 5.4 | 4.8 ± 6.7 | 7.2 ± 7.0 |
| Smoker,a n | 5 | 1 | 2 |
| Daily smoker, n | 1 | 0 | 1 |
Reported smoking at least twice a month.
BMI = body mass index; AMNART = American National Adult Reading Test; BDI = Beck Depression Inventory
Greater BMI (Fig) was associated with lower NAA concentrations in frontal (p = 0.001), parietal (p = 0.006), and temporal WM (p = 0.008). Greater BMI also related to lower NAA concentration in frontal GM (p = 0.01) and to lower Cho concentration in frontal WM (p = 0.05) (all p values were Bonferroni corrected for multiple comparisons across regions). In the linear model fit, BMI accounted for the following amounts of variance: 25% for frontal WM NAA, 20% for parietal WM NAA, 17% for temporal WM NAA, 15% for frontal GM NAA, and 20% for frontal WM Cho. The corresponding Spearman's correlation coefficients were as follows: ρ = −0.62 for frontal WM NAA; ρ = −0.55 for parietal WM NAA; ρ = −0.52 for temporal WM NAA; ρ = −0.43 for frontal WM Cho; and ρ = −0.48 for frontal GM NAA (all p < 0.02 after Bonferroni correction for multiple comparisons across regions). These correlations were similar among men and women. The other regional metabolite concentrations were not associated with BMI.
Fig.
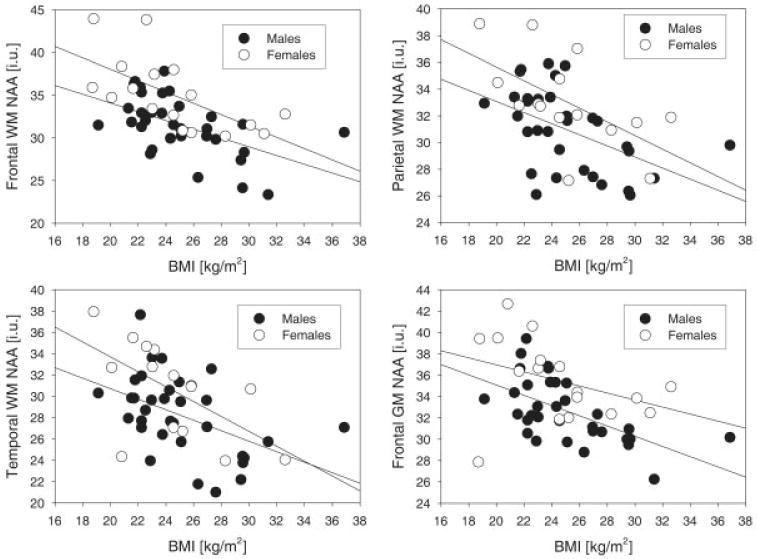
Concentrations of N-acetylaspartate (NAA; marker of neuronal viability, in institutional units [i.u.]) as a function of body mass index (BMI), separately for men (solid circles) and women (open circles). The relationships were not covaried for age, which was a nonsignificant factor in the model. GM = gray matter; WM = white matter.
Greater BMI was potentially associated with smaller parietal GM volume (p = 0.03, uncorrected) and larger frontal WM volume (p = 0.04, uncorrected). Female sex was significantly associated with 5 and 4% greater NAA in frontal GM and WM, respectively, as well as 3% greater frontal WM Cr (all p < 0.03, after correction for multiple comparisons). However, previous studies comparing absolute metabolite concentrations between male and female individuals used long echo time (TE > 135 milliseconds) and did not yield consistent results.32–35
In addition, to assess robustness of the results to the models used, we repeated all analyses with additional predictors: (1) age-squared term to evaluate possible nonlinear effects in aging,30 (2) mean regional GM contributions to spectroscopic voxels to control for partial-volume effects,36 (3) smoking status to partial out the potential detrimental effect of smoking on the outcome measures,37,38 and (4) average number of alcoholic drinks per month over lifetime and over the year preceding the study, as well as American National Adult Reading Test score and years of education. Moreover, to account for potential spurious associations between participant's body shape (weight, height), specific absorption rate, B1 inhomogeneities, and so forth and measured metabolite concentrations, we used Cr as a covariate in the model, because it would be affected by these factors in a way similar to the other metabolites given the flat excitation profile of the pulses over the spectral range. None of these additional covariates significantly affected the results. Finally, when BMI was removed from the models, that is, the predictors were age and sex only, the age dependence of magnetic resonance measures did not change significantly, which confirms that the reported associations between magnetic resonance measures and BMI were not statistically mediated by BMI increasing with age.
Discussion
The major finding of this study was that greater BMI was significantly associated with the following characteristics: (1) lower NAA concentrations in frontal, parietal, and temporal WM; 2) lower NAA concentration in frontal GM; and 3) lower Cho concentration in frontal WM. No significant associations of BMI with lobar brain volumes or regional concentrations of Cr or m-Ino were detected.
Lower NAA is consistent with derangement of neurometabolism, lower dendritic/axonal density, and/or axonal loss. Lower Cho in frontal WM suggests membrane and/or myelin alterations and/or alterations in membrane turnover. Thus, these results point to axonal and myelin abnormalities in frontal, parietal, and temporal WM, as well as decreased neuronal viability in the frontal lobe that are associated with greater BMI. This pattern of associations is not consistent with regions demonstrating volumetric and spectroscopic changes in preclinical39 and symptomatic AD.40 Spectroscopic studies in AD consistently demonstrated lower NAA40,41 and greater m-Ino42 levels in GM of medial temporal lobe and parietal lobes, but reports about Cho were inconclusive.43 Nevertheless, given the epidemiological associations between midlife adiposity and increased chances of AD, our results suggest that some processes leading to AD may have their origin in WM.
The strongest associations of BMI with NAA and Cho concentrations in the brain were found in the frontal WM, a region that myelinates later than the other lobes and is thought to be more prone to damage during aging.44 Consistently, age-related decreases of fractional anisotropy (a diffusion marker of WM microstructural fiber integrity) are also more pronounced in anterior versus posterior WM.31 This suggests that our results may reflect accelerated aging of WM in individuals with high levels of adiposity. Alternatively, because overweight or obese adults are likely to be overweight or obese as children,45 our findings could also reflect the adverse effects of adipose tissue10 on brain development. Taken together, our data suggest that adiposity has an adverse impact on aging and/or developmental processes of the brain, and thus may increase the odds of aging-related diseases such as AD. In addition, virtually identical relationships between BMI and metabolite concentrations in male and female individuals (reflected through insignificant interactions between BMI and sex) suggest that independent risk factors/processes explain why obese women appear to be more vulnerable to the development of late-life dementia than do men.
Based on many epidemiological studies, our results of frontal metabolic abnormalities with greater BMI may reflect increased risk for development of dementia later in life, possibly linked to compromised neuronal energetics.20 Stokin and colleagues46 demonstrated axonal transport defects and axonal swelling in mice models of AD and occasionally in aged wild-type mice, which preceded amyloid deposition by at least 1 year (this corresponds to several decades in human life). They also identified similar axonal defects in postmortem brains from individuals who showed early symptoms of AD but no amyloid plaques.46 This axonal swelling might be consistent with our findings of larger frontal WM volume with greater BMI (insignificant after correction for multiple comparisons), and with reports of associations between greater BMI and enlarged WM volume in young overweight and obese individuals.15,16
NAA abnormalities may also reflect insulin dysregulation (insulin resistance or hyperinsulinemia) that is often found among obese individuals.47 This dysregulation leads to reduced insulin transport into the brain, which results in impaired glucose utilization47 that could be associated with lower NAA.48 However, given the relatively small number of obese participants in our study, we do not believe that this mechanism explains our findings.
The limitations of our study include lack of assessment of potentially important covariates, such as total cholesterol, systolic and diastolic blood pressure, glucose and insulin levels, family history of AD, and apolipoprotein E genotype. However, in epidemiological studies, apolipoprotein E ε4 did not correlate with BMI8 and did not explain the associations between greater BMI and smaller brain volumes.6 Other markers of body fat and its distribution, potentially more strongly associated with brain abnormalities, such as waist/hip ratio or waist circumference,4 were not available for our analyses. Finally, potential unrecorded group differences in nutrition, stress, exercise and general fitness, overall physical health, and genetic predispositions (other then via apolipoprotein E) may contribute to the results described in this study.
In summary, this study is the first to demonstrate that greater BMI in otherwise healthy middle-aged adults is associated with axonal and/or myelin abnormalities in WM, primarily in the frontal lobe, and with neuronal injury in frontal GM. Because WM in the frontal lobes is more prone to the effects of aging than in other lobes, our results may reflect accelerated aging in individuals with high levels of adiposity, which may be associated with greater probabilities of development of AD. Significant associations of BMI with regional brain metabolite concentrations and with lobar brain volumes (the latter insignificant after correction for multiple comparisons) suggest that neuronal/glial metabolic abnormalities precede volumetric changes that may become detectable later in life or in individuals with more adipose tissue. Our findings extend previous associations between brain structure and adiposity. However, the data did not allow us to discern whether these abnormalities were associated with body fat per se, comorbid conditions, nutrition, or sedentary lifestyle. If our observations are confirmed in prospective studies that control for other important factors associated with adiposity, they may help understand important neurobiological changes preceding late-life dementia.
Acknowledgments
This work was supported by the NIAAA (R01 AA10788, D.J.M.; P01 AA11493, M.W.W.).
We thank Mr J. O'Hara, and Drs G. Matson, and A. Ebel for technical support; Drs T. Durazzo, J. Haron-Feiertag, and W.-C. Hsueh for consultation; and Dr D. Norman for clinical interpretation of magnetic resonance imaging data. We extend our gratitude to Dr M. Siger-Zajdel for inspiring discussions.
References
- 1.Meyer JS, Rauch GM, Crawford K, et al. Risk factors accelerating cerebral degenerative changes, cognitive decline and dementia. Int J Geriatr Psychiatry. 1999;14:1050–1061. doi: 10.1002/(sici)1099-1166(199912)14:12<1050::aid-gps56>3.0.co;2-z. [DOI] [PubMed] [Google Scholar]
- 2.Chao LL, Schuff N, Kramer JH, et al. Reduced medial temporal lobe N-acetylaspartate in cognitively impaired but nondemented patients. Neurology. 2005;64:282–289. doi: 10.1212/01.WNL.0000149638.45635.FF. [DOI] [PMC free article] [PubMed] [Google Scholar]
- 3.Gustafson D. Adiposity indices and dementia. Lancet Neurol. 2006;5:713–720. doi: 10.1016/S1474-4422(06)70526-9. [DOI] [PubMed] [Google Scholar]
- 4.Jagust W. What can imaging reveal about obesity and the brain? Curr Alzheimer Res. 2007;4:135–139. doi: 10.2174/156720507780362146. [DOI] [PubMed] [Google Scholar]
- 5.Gustafson D, Lissner L, Bengtsson C, et al. A 24-year follow-up of body mass index and cerebral atrophy. Neurology. 2004;63:1876–1881. doi: 10.1212/01.wnl.0000141850.47773.5f. [DOI] [PubMed] [Google Scholar]
- 6.Ward MA, Carlsson CM, Trivedi MA, et al. The effect of body mass index on global brain volume in middle-aged adults: a cross sectional study. BMC Neurol. 2005;5:23. doi: 10.1186/1471-2377-5-23. [DOI] [PMC free article] [PubMed] [Google Scholar]
- 7.Jagust W, Harvey D, Mungas D, Haan M. Central obesity and the aging brain. Arch Neurol. 2005;62:1545–1548. doi: 10.1001/archneur.62.10.1545. [DOI] [PubMed] [Google Scholar]
- 8.Gustafson D, Rothenberg E, Blennow K, et al. An 18-year follow-up of overweight and risk of Alzheimer disease. Arch Intern Med. 2003;163:1524–1528. doi: 10.1001/archinte.163.13.1524. [DOI] [PubMed] [Google Scholar]
- 9.Kivipelto M, Ngandu T, Fratiglioni L, et al. Obesity and vascular risk factors at midlife and the risk of dementia and Alzheimer disease. Arch Neurol. 2005;62:1556–1560. doi: 10.1001/archneur.62.10.1556. [DOI] [PubMed] [Google Scholar]
- 10.Whitmer RA, Gunderson EP, Barrett-Connor E, et al. Obesity in middle age and future risk of dementia: a 27 year longitudinal population based study. BMJ. 2005;330:1360. doi: 10.1136/bmj.38446.466238.E0. [DOI] [PMC free article] [PubMed] [Google Scholar]
- 11.Elias MF, Elias PK, Sullivan LM, et al. Lower cognitive function in the presence of obesity and hypertension: the Framingham Heart Study. Int J Obes Relat Metab Disord. 2003;27:260–268. doi: 10.1038/sj.ijo.802225. [DOI] [PubMed] [Google Scholar]
- 12.Elias MF, Elias PK, Sullivan LM, et al. Obesity, diabetes and cognitive deficit: the Framingham Heart Study. Neurobiol Aging. 2005;26(suppl 1):11–16. doi: 10.1016/j.neurobiolaging.2005.08.019. [DOI] [PubMed] [Google Scholar]
- 13.Waldstein SR, Katzel LI. Interactive relations of central versus total obesity and blood pressure to cognitive function. Int J Obes (Lond) 2006;30:201–207. doi: 10.1038/sj.ijo.0803114. [DOI] [PubMed] [Google Scholar]
- 14.Gunstad J, Paul RH, Cohen RA, et al. Elevated body mass index is associated with executive dysfunction in otherwise healthy adults. Compr Psychiatry. 2007;48:57–61. doi: 10.1016/j.comppsych.2006.05.001. [DOI] [PubMed] [Google Scholar]
- 15.Pannacciulli N, Del Parigi A, Chen K, et al. Brain abnormalities in human obesity: a voxel-based morphometric study. Neuroimage. 2006;31:1419–1425. doi: 10.1016/j.neuroimage.2006.01.047. [DOI] [PubMed] [Google Scholar]
- 16.Haltia LT, Viljanen A, Parkkola R, et al. Brain white matter expansion in human obesity and the recovering effect of dieting. J Clin Endocrinol Metab. 2007;92:3278–3284. doi: 10.1210/jc.2006-2495. [DOI] [PubMed] [Google Scholar]
- 17.Gu D, He J, Duan X, et al. Body weight and mortality among men and women in China. JAMA. 2006;295:776–783. doi: 10.1001/jama.295.7.776. [DOI] [PubMed] [Google Scholar]
- 18.James PT, Leach R, Kalamara E, Shayeghi M. The worldwide obesity epidemic. Obes Res. 2001;9(suppl 4):228S–233S. doi: 10.1038/oby.2001.123. [DOI] [PubMed] [Google Scholar]
- 19.Flegal KM, Carroll MD, Ogden CL, Johnson CL. Prevalence and trends in obesity among US adults, 1999-2000. JAMA. 2002;288:1723–1727. doi: 10.1001/jama.288.14.1723. [DOI] [PubMed] [Google Scholar]
- 20.Moffett JR, Ross B, Arun P, et al. N-acetylaspartate in the CNS: from neurodiagnostics to neurobiology. Prog Neurobiol. 2007;81:89–131. doi: 10.1016/j.pneurobio.2006.12.003. [DOI] [PMC free article] [PubMed] [Google Scholar]
- 21.Ross B, Bluml S. Magnetic resonance spectroscopy of the human brain. Anat Rec. 2001;265:54–84. doi: 10.1002/ar.1058. [DOI] [PubMed] [Google Scholar]
- 22.Cardenas VA, Studholme C, Meyerhoff DJ, et al. Chronic active heavy drinking and family history of problem drinking modulate regional brain tissue volumes. Psychiatry Res. 2005;138:115–130. doi: 10.1016/j.pscychresns.2005.01.002. [DOI] [PubMed] [Google Scholar]
- 23.Meyerhoff D, Blumenfeld R, Truran D, et al. Effects of heavy drinking, binge drinking, and family history of alcoholism on regional brain metabolites. Alcohol Clin Exp Res. 2004;28:650–661. doi: 10.1097/01.ALC.0000121805.12350.CA. [DOI] [PMC free article] [PubMed] [Google Scholar]
- 24.Grober E, Sliwinski M. Development and validation of a model for estimating premorbid verbal intelligence in the elderly. J Clin Exp Neuropsychol. 1991;13:933–949. doi: 10.1080/01688639108405109. [DOI] [PubMed] [Google Scholar]
- 25.Beck AT. Depression Inventory. Philadelphia: Center for Cognitive Therapy; 1978. [Google Scholar]
- 26.Sobell LC, Sobell MB. Timeline follow-back: a technique for assessing self-reported alcohol consumption. In: Litten R, Allen J, editors. Measuring alcohol consumption. Totowa, NJ: Humana Press; 1992. pp. 41–72. [Google Scholar]
- 27.Schuff N, Amend D, Knowlton R, et al. Age-related metabolite changes and volume loss in hippocampus by proton MR spectroscopic imaging and MRI neurobiology of aging. Neurobiol Aging. 1999;20:279–285. doi: 10.1016/s0197-4580(99)00022-6. [DOI] [PMC free article] [PubMed] [Google Scholar]
- 28.Schuff N, Ezekiel F, Gamst A, et al. Region and tissue differences of metabolites in normally aged brain using 1H magnetic resonance spectroscopic imaging. Magn Reson Med. 2001;45:899–907. doi: 10.1002/mrm.1119. [DOI] [PMC free article] [PubMed] [Google Scholar]
- 29.Gazdzinski S, Durazzo TC, Studholme C, et al. Quantitative brain MRI in alcohol dependence: preliminary evidence for effects of concurrent chronic cigarette smoking on regional brain volumes. Alcohol Clin Exp Res. 2005;29:1484–1495. doi: 10.1097/01.alc.0000175018.72488.61. [DOI] [PubMed] [Google Scholar]
- 30.Bartzokis G, Beckson M, Lu PH, et al. Age-related changes in frontal and temporal lobe volumes in men: a magnetic resonance imaging study. Arch Gen Psychiatry. 2001;58:461–465. doi: 10.1001/archpsyc.58.5.461. [DOI] [PubMed] [Google Scholar]
- 31.Raz N, Rodrigue KM. Differential aging of the brain: patterns, cognitive correlates and modifiers. Neurosci Biobehav Rev. 2006;30:730–748. doi: 10.1016/j.neubiorev.2006.07.001. [DOI] [PMC free article] [PubMed] [Google Scholar]
- 32.Braun CM, Boulanger Y, Labelle M, et al. Brain metabolic differences as a function of hemisphere, writing hand preference, and gender. Laterality. 2002;7:97–113. doi: 10.1080/13576500143000212. [DOI] [PubMed] [Google Scholar]
- 33.Nagae-Poetscher LM, Bonekamp D, Barker PB, et al. Asymmetry and gender effect in functionally lateralized cortical regions: a proton MRS imaging study. J Magn Reson Imaging. 2004;19:27–33. doi: 10.1002/jmri.10429. [DOI] [PubMed] [Google Scholar]
- 34.Pouwels PJ, Frahm J. Regional metabolite concentrations in human brain as determined by quantitative localized proton MRS. Magn Reson Med. 1998;39:53–60. doi: 10.1002/mrm.1910390110. [DOI] [PubMed] [Google Scholar]
- 35.Safriel Y, Pol-Rodriguez M, Novotny EJ, et al. Reference values for long echo time MR spectroscopy in healthy adults. AJNR Am J Neuroradiol. 2005;26:1439–1445. [PMC free article] [PubMed] [Google Scholar]
- 36.Ende G, Welzel H, Walter S, et al. Monitoring the effects of chronic alcohol consumption and abstinence on brain metabolism: a longitudinal proton magnetic resonance spectroscopy study. Biol Psychiatry. 2005;58:974–980. doi: 10.1016/j.biopsych.2005.05.038. [DOI] [PubMed] [Google Scholar]
- 37.Brody AL, Mandelkern MA, Jarvik ME, et al. Differences between smokers and nonsmokers in regional gray matter volumes and densities. Biol Psychiatry. 2004;55:77–84. doi: 10.1016/s0006-3223(03)00610-3. [DOI] [PubMed] [Google Scholar]
- 38.Gallinat J, Lang UE, Jacobsen LK, et al. Abnormal hippocampal neurochemistry in smokers: evidence from proton magnetic resonance spectroscopy at 3 T. J Clin Psychopharmacol. 2007;27:80–84. doi: 10.1097/JCP.0b013e31802dffde. [DOI] [PubMed] [Google Scholar]
- 39.Jagust W, Gitcho A, Sun F, et al. Brain imaging evidence of preclinical Alzheimer's disease in normal aging. Ann Neurol. 2006;59:673–681. doi: 10.1002/ana.20799. [DOI] [PubMed] [Google Scholar]
- 40.Schuff N, Meyerhoff DJ, Mueller S, et al. N-acetylaspartate as a marker of neuronal injury in neurodegenerative disease. Adv Exp Med Biol. 2006;576:241–262. doi: 10.1007/0-387-30172-0_17. discussion 361–363. [DOI] [PMC free article] [PubMed] [Google Scholar]
- 41.Jones RS, Waldman AD. 1H-MRS evaluation of metabolism in Alzheimer's disease and vascular dementia. Neurol Res. 2004;26:488–495. doi: 10.1179/016164104225017640. [DOI] [PubMed] [Google Scholar]
- 42.Zhu X, Schuff N, Kornak J, et al. Effects of Alzheimer disease on fronto-parietal brain N-acetyl aspartate and myo-inositol using magnetic resonance spectroscopic imaging. Alzheimer Dis Assoc Disord. 2006;20:77–85. doi: 10.1097/01.wad.0000213809.12553.fc. [DOI] [PMC free article] [PubMed] [Google Scholar]
- 43.Valenzuela MJ, Sachdev P. Magnetic resonance spectroscopy in AD. Neurology. 2001;56:592–598. doi: 10.1212/wnl.56.5.592. [DOI] [PubMed] [Google Scholar]
- 44.Bartzokis G. Age-related myelin breakdown: a developmental model of cognitive decline and Alzheimer's disease. Neurobiol Aging. 2004;25:5–18. doi: 10.1016/j.neurobiolaging.2003.03.001. author reply 49–62. [DOI] [PubMed] [Google Scholar]
- 45.Ogden CL, Flegal KM, Carroll MD, Johnson CL. Prevalence and trends in overweight among US children and adolescents, 1999-2000. JAMA. 2002;288:1728–1732. doi: 10.1001/jama.288.14.1728. [DOI] [PubMed] [Google Scholar]
- 46.Stokin GB, Lillo C, Falzone TL, et al. Axonopathy and transport deficits early in the pathogenesis of Alzheimer's disease. Science. 2005;307:1282–1288. doi: 10.1126/science.1105681. [DOI] [PubMed] [Google Scholar]
- 47.Craft S. Insulin resistance and Alzheimer's disease pathogenesis: potential mechanisms and implications for treatment. Curr Alzheimer Res. 2007;4:147–152. doi: 10.2174/156720507780362137. [DOI] [PubMed] [Google Scholar]
- 48.O'Neill J, Eberling JL, Schuff N, et al. Method to correlate 1H MRSI and 18FDG-PET. Magn Reson Med. 2000;43:244–250. doi: 10.1002/(sici)1522-2594(200002)43:2<244::aid-mrm11>3.0.co;2-2. [DOI] [PMC free article] [PubMed] [Google Scholar]