

Abstract
We have developed a set of orientational restraint potentials for solid-state NMR observables including 15N chemical shift and 15N-1H dipolar coupling. Torsion angle molecular dynamics simulations with available experimental 15N chemical shift and 15N-1H dipolar coupling as target values have been performed to determine orientational information of four membrane proteins and to model the structures of some of these systems in oligomer states. The results suggest that incorporation of the orientational restraint potentials into molecular dynamics provides an efficient means to the determination of structures that optimally satisfy the experimental observables without an extensive geometrical search.
Keywords: molecular dynamics, transmembrane helices, orientational restraint, 15N chemical shift, 15N-1H dipolar coupling
Introduction
Helices are the major secondary structures in transmembrane (TM) domains of membrane proteins [1], which play important roles in intracellular and intercellular signaling, transportation of ions and small molecules, and cell-cell recognition [2, 3]. Identifying and characterizing the relative orientation of helices in membrane proteins are crucial in determining their topologies and three-dimensional structures, which can provide insights into the underlying pathologic mechanisms responsible for many human diseases. Although particular successes are evident for some membrane proteins [4–6], X-ray diffraction methods generally encounter numerous obstacles due to hydrophobic interactions between membrane proteins and lipids. Solid-state NMR (SSNMR) is an emerging technique to study the topology, structure, and dynamics of membrane proteins in their native environment of lipid bilayers, which can complement X-ray and solution NMR studies. Measurements of 15N chemical shift and 15N-1H dipolar coupling using various SSNMR techniques provide the orientational constraints of helices that can be used to determine their tilt and rotation angles with respect to lipid bilayers. Such orientational information can also be utilized to model assembled structures in certain oligomer states.
Monte Carlo (MC) approach based on a geometric search of tilt and rotation angles have been widely used to find global minimum structures in the energy (or penalty) function that incorporates all the orientational constraints and the empirical potential energy function [7–9]. Alternatively, the incorporation of the orientational restraint potentials into molecular dynamics (MD) simulations has been attempted and applied in the structure refinement of gramicidin A [10]. Although the use of restraint potentials in energy minimization and MD simulations has been well-established as a powerful tool in the solution NMR structure determination, similar approaches have not been fully explored in the context of the SSNMR structure determination.
The present work aims to develop a protocol to determine membrane protein structures using MD simulations with orientational restraint potentials representing SSNMR observables such as the chemical shift and dipolar coupling. For this, we first formulated and implemented these restraint potentials as well as corresponding analytical forces in the biomolecular simulation program CHARMM [11]. Then, we developed and optimized a protocol for SSNMR structure determination by applying the restraint potentials to several membrane proteins whose structures were previously determined using the MC approach. To illustrate the efficacy of our approach, we determined the monomer structures of the major pVIII coat protein of fd filamentous bacteriophage (fd coat) [12], the mercury ion transporter (MerF) from the bacterial mercury detoxification system [13], the TM domain of the M2 protein (M2TMP) from influenza A virus [14], and the TM domain of viral protein “u” (VpuTM) from human immunodeficiency virus 1 (HIV-1) [9]. We further utilized the monomer structures to model oligomeric states of VpuTM (tetramer and pentamer) and M2TMP (tetramer).
Development of SSNMR restraint potentials
Dipolar Coupling
Dipolar coupling results from the interaction of one nuclear spin i with a magnetic field generated by another nuclear spin j, or vice versa. This is an interaction through space that is dependent on the gyromagnetic ratio (γ) of each nucleus as well as the distance, rij. The individual 15N-1H dipolar coupling (ν) is measured as
| (1) |
where ν0 is the dipolar coupling constant, i.e., in which h is Plank’s constant and μ0 is the permeability of space. In the case of rNH = 1.07 Å, the dipolar coupling constant becomes 19.86 kHz. θ is the angle between the NH internuclear vector, rNH, and the magnetic field, which is generally assumed to be parallel to the Z-axis. The solution of Eq. (1) has an intrinsic degeneracy due to doublet splitting of the dipolar coupling. Furthermore, SSNMR experiments cannot distinguish the sign of observables below half maximal amplitude, i.e., ν0/2, which is the so-called sign degeneracy [10, 15]. In spite of these ambiguities, dipolar waves have been used to identify a helix in proteins, detect kinks or curvature in the helix, and determine rotation and orientation of the helix with respect to the membrane normal [16].
The restraint potential for 15N-1H dipolar coupling, Udc, is expressed as a quadratic function to restrain the deviation of the calculated values (ν) from the experimental observables (νexp);
| (2) |
where N is the number of dipolar couplings, and kdc is the force constant in kcal/(mol·kHz2). Note that an absolute value, |ν|, is used in Eq. (2) to account for the sign degeneracy below ν0/2. The derivatives of Udc with respect to rα of two selected atoms (α = N or H) become
| (3) |
The derivative of |νi in Eq. (2) yields an opposite sign when νi < 0. If the sign degeneracy is resolved, the derivatives can be described by the upper equation in Eq. (3). The last term, ∂νi/∂rα, becomes
| (4) |
where ∂ν0,i/∂r does not vanish when the NH distance varies during simulations. The detailed mathematical descriptions for the derivatives of cos θ and ν0 are given in the Supplementary Information (SI).
SSNMR Chemical Shift
Chemical shielding is an anisotropic interaction characterized by a shielding tensor, which can be diagonalized to yield three principal components (σ11, σ22, and σ33). The three components in the 15N chemical shift are described in terms of a peptide plane (molecular frame) defined by the N, H, and C atoms. The shielding or de-shielding effects from the peptide plane move a resonant frequency to either higher or lower frequencies from a reference frequency. This deviation from the reference frequency is known as chemical shift. To calculate the chemical shift efficiently, the chemical shift tensor needs to be fixed relative to a local molecular frame, and the magnitude of each component must be constant, which is the so-called “rigid tensor approximation” [17, 18]. Because the SSNMR time scale is much longer than that of molecular motions, the observed chemical shift (σexp) parallel to the magnetic field can be calculated as a time-average of the projected instantaneous second-rank tensor,
| (5) |
where n̂ is a unit vector of the magnetic field, which is assumed to be parallel to the membrane normal (the Z-axis; n̂ ≡ ẑ), and σii(t) and êi(t) are the instantaneous magnitude and unit vector of chemical shift tensors, respectively. In general, ê1 and ê3 are on the peptide plane defined by N, C, and H atoms, and ê2 is defined by the cross product of rNC and rNH [18]. Then, ê1 is defined by a rotation angle ϕ from rNH on the peptide plane, and ê3 = ê1 × ê2. In terms of the rigid tensor approximation, the magnitudes of chemical shift tensor are separated from their unit vectors, i.e.,
| (6) |
The experimentally observed chemical shift is the time-average of the individual chemical shift tensors of the peptide plane. However, the chemical shift (σ) of a molecule can be calculated from an instantaneous conformation in the course of its time evolution. Then, the chemical shift parallel to the magnetic field becomes
| (7) |
where êi,z is the z component of êi (i = 1, 2, 3). The magnitudes of the three chemical shift tensors (σ11, σ22, and σ33) are often assumed to be independent of amino acid residues, except for glycine and proline. Table 1 summarizes these parameters, including ϕ to define ê1 in our testcases.
Table 1.
Summary of SSNMR parameters for four testcases
| fd coat | M2TMP | VpuTM | MerF | |
|---|---|---|---|---|
| No. of Chemical shiftsa | 38 | 10 | 18 | 41b |
| No. of Dipolar couplingsa | 39 | 7 | 18 | 41b |
| No. of residues | 50 | 25 | 19 | 45 |
| PDB (Monomer) | 1MZT | 1MP6 | 1PJE | 2H3O |
| PDB (Oligomer) | 1NYJ | 1PI8, 1PI7 | ||
| References | [12] | [7, 41] | [9] | [9, 13] |
| σ11 (ppm) | 64/41c | indiv.d | 64 | 64/41/38e |
| σ22 (ppm) | 77/64 | indiv. | 77 | 77/64/127 |
| σ33 (ppm) | 217/210 | indiv. | 222 | 222/215/231 |
| ϕ (°) | 107/108 | 109 | 108.5 | 108.5/108.5/110 |
| Dist(NH) (Å) | 1.07/1.07 | 1.07 | 1.05 | 1.05/1.05/NAf |
The SSNMR observables are obtained from corresponding references.
The SSNMR observables are obtained in magnetically aligned bicelles. The corresponding observables in bilayers can be calculated by σbicelle = (1 + S/2) σiso − (S/2)σbilayer and νbicelle = − (S/2)νbilayer, where σiso is the isotropic chemical shift frequency. The order parameter S was set to 0.80 for the bicelles.
The chemical shift tensors for non-glycine/glycine residues.
Different chemical shift tensors were used for individual residues. The values are in the references.
The chemical shift tensors for non-glycine/glycine/proline residues.
There is no NH bond in the Pro backbone.
The chemical shift restraint potential is expressed as a quadratic function to restrain deviations of calculated chemical shifts (σ) from experimental observables (σexp);
| (8) |
where N is the number of chemical shifts, and kcs is the force constant in kcal/(mol·ppm2). The derivatives of the chemical shift restraint potential (Ucs) with respect to rα (α = N, H, or C) are
| (9) |
In terms of Eq. (7), the last term for ith chemical shift becomes
| (10) |
where the index i is omitted for the sake of clarity. The detailed mathematical description of each derivative is described in SI.
Simulation details
To examine the numerical accuracy of the implemented analytical forces, we first compared them with the finite difference forces. Both forces are consistent within numerical errors (data not shown), demonstrating that the analytical forces are implemented correctly. In general, the simulation stability with restraint potentials is quantified by measuring the so-called total energy fluctuation in NVE (constant volume and energy) simulations [19, 20]. We performed 200 ps NVE simulations of VpuTM with the Verlet integrator and a time step of 1 femtosecond (fs). As shown in SI Fig. S1, the total energies appear to be well conserved, demonstrating again the accuracy of calculated restraint forces. Figures SI S2 and S3 show the total energy fluctuations from NVE Cartesian MD and torsion angle MD (TAMD) simulations [19] as a function of restraint force constant. As expected, the simulation stability depends on the applied force constants and dynamics algorithms. TAMD appears to yield much more stable trajectories than Cartesian MD because the peptide plane is a rigid unit in TAMD.
Combined with constant temperature TAMD simulations at 300 K, we have developed and optimized a protocol to determine monomer structures using the SSNMR restraint potentials just described. The protocol consists of (1) generating an ideal α-helix (or helices), (2) performing several steps of TAMD simulation with increasing force constants, and (3) selecting structures that satisfy certain criteria such as δσ < 1 ppm and δν < 1 kHz, where δσ and δν represent the root-mean square deviations of the calculated chemical shift and dipolar coupling from their corresponding target SSNMR observables, respectively. It should be noted that the criteria are within the SSNMR experimental errors [21, 22]. To generate stable simulation trajectories that often satisfy the aforementioned criteria, the maximum force constants were empirically optimized to be kcs = 0.8 kcal/(mol·ppm2) and kdc = 1.6 kcal/(mol·kHz2). However, due to the complexity of the MerF system, we had to slightly lower the criteria (δσ < 1.2 ppm and δν < 1.2 kHz) and increase the force constants (kcs = 3.2 kcal/(mol·ppm2) and kdc = 6.4 kcal/(mol·kHz2)) to yield statistically meaningful number of structures.
Figure 1 illustrates the overall process involved in the structure determination of a monomer using the SSNMR restraint potentials. Starting from an ideal α-helical conformation (ϕ = −65° and ψ = −40°) [23], 130 ps of TAMD were performed 100 times with different initial velocities. In the case of MerF, we generated two parallel TM α-helices (TM1: residues 26–41 and TM2: residues 51–70) with the helix-helix distance of 15 Å and rotated TM2 from −180 to 180° in 5° increments. The connecting loop residues were initialized by default CHARMM topologies. We performed 10 TAMD simulations for each initial structure with different initial velocities. The force constants were smoothly increased to the maximum values during a total of 130 ps simulations (150 ps for MerF). The final structures were selected based on the aforementioned criteria.
Figure 1.
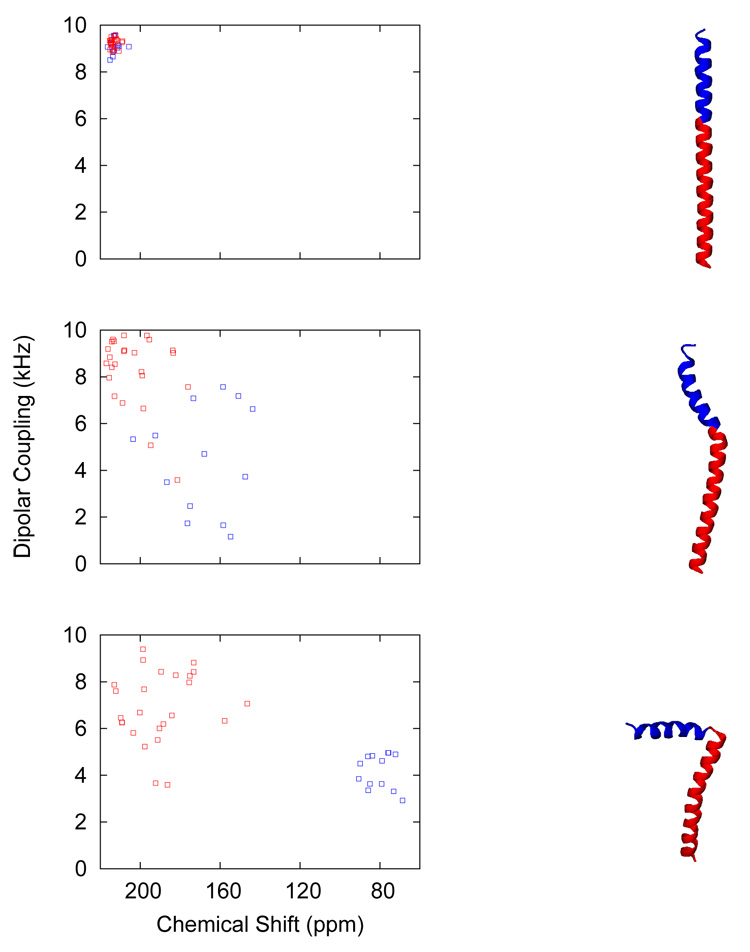
Illustration of our MD simulation protocol for the SSNMR structure determination. (right) The conformation changes of fd coat in the course of MD simulations with the SSNMR restraint potentials are shown, starting from an ideal α-helix (first row) to the final structure (third row) satisfying the RMSD criteria (δσ ≤ 1.0 ppm and δν ≤ 1.0 kHz). (left) The corresponding PISEMA spectra of fd coat are shown. The IP helix is shown in blue and the TM helix in red for both PISEMA spectra and corresponding structures.
Determination of oligomer structures of VpuTM and M2TMP were initiated from the average structures of the monomers. By displacing the monomer 15 Å away from the origin in a XY direction and rotating it along the Z-axis every 5°, we generated 72 initial structures and ran 10 simulations for each structure with different initial velocities, resulting in 720 assembled structures [24]. By imposing four-fold or five-fold symmetry using the IMAGE facility in CHARMM, 20 ps TAMD simulations were performed with the maximum force constants used in the monomer structure determination. We selected the structures satisfying δσ ≤ 1.0 ppm and δν ≤ 1.0 kHz, and then clustered them based on the helix-helix distance between neighboring (image) helices, the helix-helix crossing angles, and averaged potential energies over last 10 ps. We used the definitions of Chothia et al. [25] for the helix-helix distance and crossing angle.
Solvent/membrane environments play an important role in protein structure. As such, we determined the structures in vacuum as well as in an implicit membrane model in which the average influence of the membrane (waters and lipids) is approximated by solvation free energy terms. As an implicit membrane model, we used a generalized Born model with a simple switching function (GBSW) [26, 27] with 0.04 kcal/(mol·Å2) for the surface tension coefficient, 23 Å for the hydrophobic thickness corresponding to a DMPC membrane, and 5 Å for a membrane smoothing length over which the hydrophobic region is gradually changed to the solvent region. The implicit planar membrane is perpendicular to the Z-axis and centered at Z = 0. We used a time-step of 1 fs for TAMD simulations with the all-atom parameter set PARAM22 for proteins [28] including the dihedral cross-term corrections (CMAP) [29]. The cutoff distance for nonbonded interactions was 16.0 Å in the monomer structure determination, and there was no cutoff in the oligomer structure determination. A constant temperature of 300 K was maintained by using a simple Berendsen thermostat [30] in combination with velocity reassignment. While we used natural N- and C-terminal groups for fd coat, neutral termini were used for other proteins: acetylated N- and amidated C-terminal group for M2TMP and MerF and acetylated N- and methylamide C-terminal group for VpuTM.
Results and Discussion
Fd coat
Fd coat is the major pVIII coat protein of fd filamentous bacteriophage and consists of two distinct α-helices in the membrane-bound form: one is a short amphipathic in-plane (IP) helix (residues 7–18), which rests on the membrane-water interface, and the other is a longer hydrophobic TM helix (residues 21–45). The structure was determined by solution NMR (PDB:1FDM) [31] as well as SSNMR (PDB:1MZT) [12]. Following the structure determination protocol, we obtained 45 (vacuum) and 61 (GBSW) structures that satisfy the selection criteria (δσ ≤ 1.0 ppm and δν ≤ 1.0 kHz). Figures SI S4 (vacuum) and S5 (GBSW) show the individual deviations between the calculated SSNMR values and the corresponding experimental data for the best and worst structures satisfying the selection criteria. As shown in Table 2, the fluctuations in calculated tilt angles suggest that the IP helix is more flexible than the TM helix (see the definition of each tilt angle in Table 2). The flexibility of the IP helix may be associated with larger fluctuations in backbone torsion angles of the IP helix (see SI Fig. S6 for vacuum and S7 for GBSW). The averaged tilt angles of the IP and TM helices (90.1° for IP and 22.4° for TM in vacuum, and 85.3° for IP and 22.0° for TM in GBSW) are in good agreement with those in PDB:1MZT (92.0° for IP and 20.3° for TM) [12]. Figure 2a shows both the averaged structure obtained in vacuum and PDB:1MZT. A slight bending near residue Ile37 observed in PDB:1MZT is well reproduced. In the MC approach, since the tilt angles of the IP and TM helices are independently determined without the connecting turn (residues 19–20), the resulting structures may have geometric ambiguity. Therefore, Opella and coworkers first categorized their resulting structures into four families that have the same tilt angles but different orientations [12]. They then selected family A (as shown in Fig. 4A of reference [12]) based on the favorable connecting turn geometry (T19 ϕ/ψ = −93°/−82°; E20 ϕ/ψ = −37°/132°) in the Ramachandran map. Interestingly, 98% of the determined structures (44 of 45) in vacuum are categorized into family A with a similar connecting turn geometry (T19 ϕ/ψ = −112 ± 12°/−57 ± 30°; E20 ϕ/ψ = −47 ± 12°/125 ± 28°). In GBSW, 82% of the determined structures (50 of 61) are classified into family A. This suggests that our MD approach with SSNMR restraint potentials is more efficient than the MC approach because the former does not require the additional selection process based on the turn geometry.
Table 2.
Structure information of determined monomers
| fd coat | M2TMP | VpuTM | MerF | |
|---|---|---|---|---|
| Vacuum | ||||
| No. of Struct.a | 45 | 85 | 21 | 32 |
| Tilt (TM)b (°) | 22.4 ± 0.4 | 31.9 ± 1.0 | 15.1 ± 0.4 | 17.3 ± 0.2 |
| Tilt (IP)b (°) | 90.1 ± 5.0 | 18.6 ± 0.8 | ||
| Rotationc (°) | 173.9 ± 9.6 | −27.0 ± 2.6 | ||
| Hinged (°) | 79.8 ± 8.6 | 19.4 ± 10.8 | ||
| GBSW | ||||
| No. of Struct. | 61 | 100 | 21 | 25 |
| Tilt (TM) (°) | 22.0 ± 0.4 | 31.2 ± 0.6 | 15.0 ± 0.2 | 17.2 ± 0.4 |
| Tilt (IP) (°) | 85.3 ± 5.6 | 19.8 ± 0.4 | ||
| Rotation (°) | 195.5 ± 6.8 | −58.4 ± 2.0 | ||
| Hinge (°) | 88.8 ± 8.6 | 19.2 ± 23.0 | ||
The number of structures satisfying δσ ≤ 1.0 ppm and δν ≤ 1.0 kHz. In the case of MerF, we used δσ ≤ 1.2 ppm and δν ≤ 1.2 kHz with an additional criterion for the helix-helix distance to be less than 11 Å.
The tilt angle is defined by the angle between the helical principal axis and Z-axis. In the case of MerF, TM corresponds to TM1 and IP to TM2.
People have use two different definitions for the rotation angle: one (ρ) from Killian and coworkers [51] and the other (ρc) from Cross and coworkers [41]. The relationship between the two definitions is ρc + ρ = −180° if ρc < 0. We used the definition of Killian and coworkers with Cα atoms of Leu26 for M2TMP and Leu11 for VpuTM as reference atoms, respectively.
The hinge angel is defined by the angle between the TM (TM1) and IP (TM2) domains.
Figure 2.
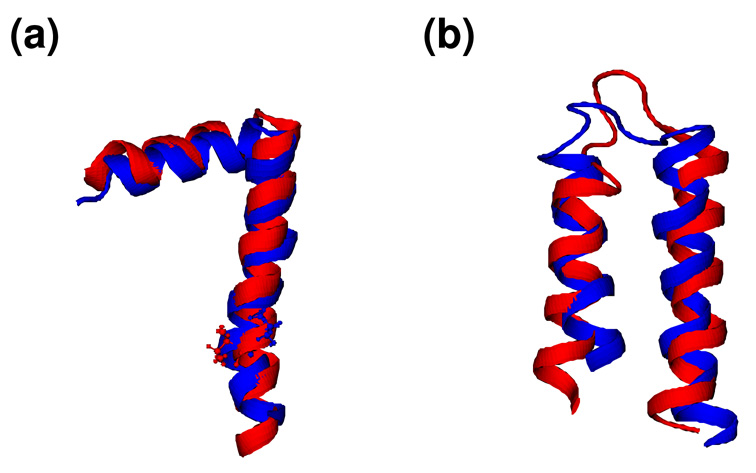
Comparison of (a) fd coat and (b) MerF structures (red) determined by our simulation protocol with corresponding structures (blue) previously determined based on the MC conformation search (PDB:1MZT for fd coat and PDB: 2H3O for MerF). The fd coat structure is the average of the ensemble structures in vacuum, and the MerF structure is the lowest energy structure that satisfies the additional pre-Pro and Pro ϕ/ψ criteria (see main text). For fd coat structures, Ile37 where the TM helix bends slightly is shown in ball and stick models.
Figure 4.
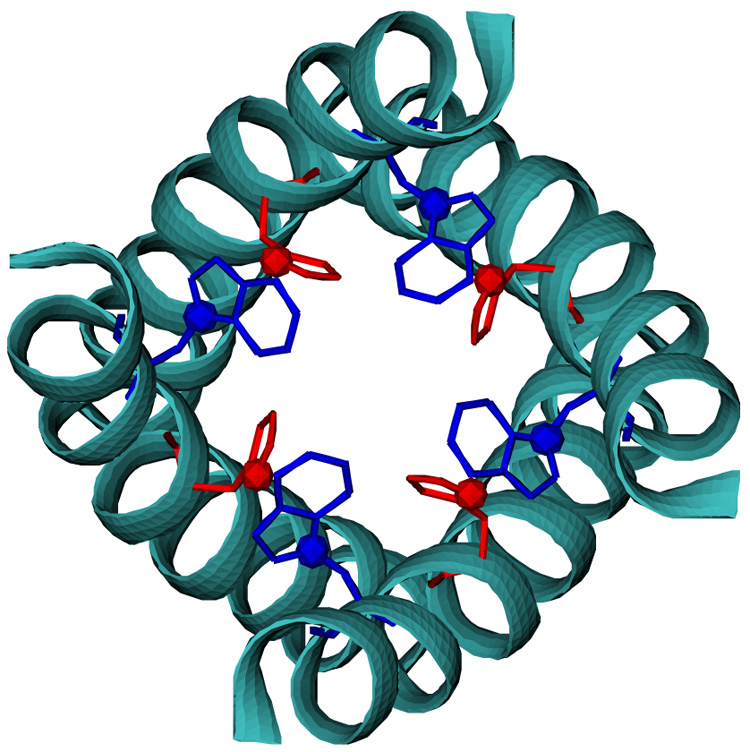
A M2TMP tetramer structure with the lowest potential energy in vacuum, satisfying δσ ≤ 1.0 ppm and δν ≤ 1.0 kHz as well as the REDOR SSNMR data. The distance between Nπ-His37 (red sphere) and Cγ-Trp41 (blue sphere) is 3.62 Å. The helices are shown in cyan.
MerF
MerF is a mercuric ion transporter associated with a bacterial mercury detoxification system. It is an attractive target for the SSNMR structure determination due to its essential biological function of transporting Hg(II) across membranes. MerF is composed of two TM helices (TM1: residues 26–41, TM2: residues 51–70) and an interhelical loop (residues 42–50). The dipolar waves show that MerF has two TM helices with a kink or bend [13]. Table 2 summarizes the features of the structures determined by the simulation protocol and selection criteria. The average tilt angles of the determined structures (TM1/TM2 = 17.3°/18.6° in vacuum and 17.2°/19.8° in GBSW) are in good agreement with those (18° for both helices) obtained by Opella and coworkers [13]. However, as shown in SI Fig. S8, the determined structures with the present protocol reveals various orientations between two TM helices due to the inherent degeneracy of SSNMR observables as well as the lack of restraints to define their relative orientation. This variation may be associated with the larger fluctuations in backbone torsion angles of the connecting loop than those of the TM1 and TM2 helices although the structures well satisfy the SSNMR observables (see SI Fig. S6 and S7). As such, the best representative structure was selected based on the potential energy as well as the backbone dihedral angles of Leu48, pre-Pro (−180° < ϕ < −20°, 30° < ψ < 180°), and Pro49 (−110° < ϕ < −30°, −70° < ψ < 180°) because of their limited ϕ and ψ angle distribution in the Ramachandran plot [32]. Figure 2b shows the lowest energy structure in vacuum that satisfies the ϕ/ψ criteria, which is compared with PDB:2H3O determined by Opella and coworkers [13]. It should be stressed that PDB:2H3O was determined by two additional distance restraints between TM1 and TM2 in addition to the SSNMR restraints [13]; our structures were determined by the SSNMR restraints alone based on the aforementioned criteria. The number of final structures in GBSW (18 of 25) is larger than that in vacuum (14 of 32), indicating that the implicit solvent model is useful in enriching the loop structures. However, even with the additional restriction in the ϕ/ψ angles, structural ambiguity remains due to the larger number of residues in the connecting loop. Further structure determination with additional restraints from spectroscopic measurements or with advanced sampling techniques such as the replica exchange method [33, 34] may be helpful to obtain the protein structure with higher precision.
M2TMP
Influenza A virus was the most deadly disease of the 20th century, and its structure determination is still of biomedical importance [35, 36]. The TM domain (residues 22–46) of the M2 protein (M2TMP) from influenza A virus forms a proton selective ion channel (homo-tetramer) that is essential for virus infection. The structure of the M2TMP tetramer in bilayers has been studied by experiments and MD simulations [22, 24, 36–40]. Following the simulation protocol and selection criteria defined above, we first calculated the monomer structure with 10 chemical shifts and 7 dipolar couplings (see Table 1). Table 2 summarizes the determined structural features such as TM helix tilt and rotation angles (see the definition of each angle in Table 2). Cross and coworkers estimated a tilt angle of 37° and a rotation angle of −10° (−170° or 190° in our definition) in a DMPC bilayer [41]. By using site-directed infrared dichroism spectra, Kukol et al. measured the tilt angle of 31.6 ± 6.2° [37]. Although the average rotation angle of our structural ensemble is similar to that of the structure determined by Cross and coworkers, the average tilt angle appears to be closer to the measurement by Kukol et al.
Following the simulation protocol for the oligomer structure determination, we obtained 546 (vacuum) and 420 (GBSW) tetramers that satisfy δσ ≤ 1.0 ppm and δν ≤ 1.0 kHz, from which we selected 291 (vacuum) and 145 (GBSW) conformations with a helix-helix distance below 10 Å. The structural data are summarized in Table 3 (vacuum) and in Table 4 (GBSW). As shown in Fig. 3, the low energy structures have left-handed packing (i.e., positive crossing angle) in vacuum as well as in GBSW. The left-handed structure (PDB:1NYJ) determined by Cross and coworkers has Ser31, His37, and Trp41 inside the pore, an important feature supported by the rotational echo double resonance (REDOR) SSNMR spectroscopy [14]. Figure 4 shows the lowest energy structure in vacuum, that also satisfies the REDOR SSNMR data (i.e., the distance between His37(i) in ith helix and Trp41(i+1) in the neighboring (i+1)th helix below 3.9 Å).
Table 3.
Structure information of determined oligomers in vacuum
| VpuTM | VpuTM | M2TMP | |
|---|---|---|---|
| Oligomerization | Tetramer | Pentamer | Tetramer |
| No. of structuresa | 58 | 27 | 291 |
| Population | |||
| (Left) | 28 (48%) | 2 (8%) | 183 (63%) |
| (Right) | 14 (24%) | 13 (48%) | 108 (37%) |
| (Parallel) | 16 (28%) | 12 (44%) | |
| Crossing angleb | |||
| (Left) | 20.1 ± 0.4 | 16.4 ± 0.2 | 44.4 ± 2.0 |
| (Right) | −13.2 ± 3.0 | −10.5 ± 0.8 | −45.1 ± 2.2 |
| (Parallel) | 8.3 ± 4.4 | 3.6 ± 1.2 | |
| Potential energyc | |||
| (Left) | 227.1 ± 11.6 | 230.0 ± 6.4 | −60.9 ± 10.8 |
| (Right) | 244.3 ± 10.4 | 235.1 ± 4.6 | −36.5 ± 3.6 |
| (Parallel) | 277.7 ± 22.0 | 255.4 ± 18.4 | |
| Tilt angle | |||
| (Left) | 15.0 ± 0.4 | 15.2 ± 0.2 | 32.3 ± 1.6 |
| (Right) | 15.0 ± 0.4 | 15.0 ± 0.4 | 33.5 ± 0.8 |
| (Parallel) | 15.0 ± 0.4 | 15.0 ± 0.2 | |
| His37-Trp41 distanced | |||
| (Left) | 6.1 ± 1.6 | ||
| (Right) | 20.6 ± 0.8 | ||
The number of structures satisfying the criteria of δσ ≤ 1.0 ppm and δν ≤ 1.0 kHz, and the helix-helix distance between two neighboring helices below 10.0 Å.
The helix-helix crossing angle was calculated based on the definition of Chothia et al. [25].
The average potential energy during the final 10 ps simulation.
The distance between Nπ-His37 and Cγ-Trp41 in M2TMP tetramers.
Table 4.
Structure information of determined oligomers in GBSWa
| VpuTM | VpuTM | M2TMP | |
|---|---|---|---|
| Oligomerization | Tetramer | Pentamer | Tetramer |
| No. of structures | 95 | 101 | 145 |
| Population | |||
| (Left) | 30 (32%) | 11 (11%) | 40 (28%) |
| (Right) | 25 (26%) | 26 (26%) | 105 (72%) |
| (Parallel) | 40 (42%) | 63 (63%) | |
| Crossing angle | |||
| (Left) | 20.4 ± 0.6 | 16.8 ± 0.4 | 43.4 ± 1.4 |
| (Right) | −15.8 ± 4.2 | −12.5 ± 3.2 | −43.1 ± 1.6 |
| (Parallel) | 2.0 ± 5.0 | 0.3 ± 3.8 | |
| Potential energy | |||
| (Left) | 195.3 ± 11.8 | 196.8 ± 13.4 | −130.3 ± 37.2 |
| (Right) | 199.7 ± 7.6 | 206.3 ± 16.0 | −123.4 ± 8.4 |
| (Parallel) | 213.8 ± 13.8 | 221.8 ± 20.6 | |
| Tilt angle | |||
| (Left) | 15.2 ± 0.4 | 15.3 ± 0.4 | 31.6 ± 1.0 |
| (Right) | 15.1 ± 0.4 | 15.3 ± 0.4 | 31.6 ± 0.8 |
| (Parallel) | 15.1 ± 0.4 | 15.1 ± 0.4 | |
| His37-Trp41 distance | |||
| (Left) | 8.3 ± 2.8 | ||
| (Right) | 19.4 ± 0.6 | ||
The same definitions as those in Table 3 are used for all the quantities listed.
Figure 3.
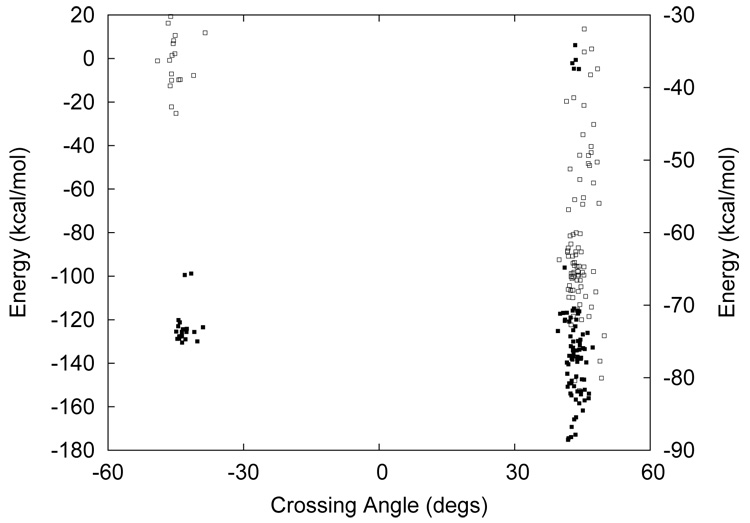
Distributions of helix-helix crossing angles and potential energies of M2TMP tetramer structures in vacuum (empty squares, right Y -axis) and GBSW (filled squares, left Y -axis). Only first 100 low energy structures are shown for clarity.
Based on the χ1 and χ2 dihedral angles of His37 and Trp41, the M2TMP tetramer can be categorized into four conformations such as (t60,t90), (t-160,t90), (t-160,t-105), (t60,t-105) where the first “t” represents that the χ1 angle is 180° (trans), and the following numerical values are the χ2 angles of His37 and Trp41. These conformations yields different distances between His37(i) and Trp41(i+1) as well as between Trp41(i) and Trp41(i+1), which dictates the relative orientations of both residues inside the pore; for example, based on PDB:1NYJ, these distances are (3.8 Å, 11.7 Å) in (t60,t90), (3.6 Å, 11.4 Å) in (t-160,t90), (3.8 Å, 5.1 Å) in (t-160,t-105), and (3.6 Å, 5.1 Å) in (t60,t-105), where the first one is for His37(i) and Trp41(i+1) and the second one for Trp41(i) and Trp41(i+1). Three conformations corresponding to (t-160,t90), (t-160,t-105), and (t60,t90) have been determined by 19F SSNMR [42], REDOR SSNMR [14] and MD simulations [43], respectively.
In our calculations, when the initial χ2 of Trp41 was set to 0°, which is the default CHARMM topology, the determined structures were populated mostly in (t60,t-105) and partly in (t-160,t-105) conformations. However, when the χ2 was set to 90°, the determined structures were mainly in (t60,t90) and partly in (t-160,t90) conformations. Recently, the DeGrado group determined the X-ray structure of the M2TMP tetramer (PDB:3BKD) [6]. The structure forms left-handed helices with tilt angles of 35° ± 2°. However, apart from the asymmetric nature of the tetramer structure, the average distance between His37(i) and Trp41(i+1) is 13.4±1.0 Å which does not agree with most SSNMR experiments. In addition, the X-ray structure has two χ1 and χ2 conformations such as (t-160,t90) and (t60,t90). Clearly, further experimental and computational studies will be required to understand the difference of the interfacial helix packing and the orientations of pore-lining residues such as His37 and Trp41.
VpuTM
Viral protein “u” (Vpu) is a small membrane protein whose sequence is encoded in the genome of HIV-1. There is a hydrophobic TM helix in the N-terminal domain and amphipathic helices in the C-terminal domain [44]. Vpu affects the budding of new virus particles, and the hydrophobic TM helix (residues 7–25) may play an important role as an ion channel that is selective for monovalent cations such as Na+ and K+ [45]. The ion channel is formed by the homo-oligomers of four to seven helices. Computational studies have suggested that the most probable oligomeric state is a pentamer [46, 47]. However, a recent study suggested that there might be more than one possible oligomeric state [9], and the exact state is yet to be determined. The atomic structure of Vpu is an essential and crucial starting point for rational drug design [48]. Vpu has also served as a model system (VpuTM) for method development in structure determination of membrane proteins [9, 49]. As summarized in Table 2, there are 21 determined monomer structures in both vacuum and GBSW membrane. The average tilt angles in both vacuum and GBSW are around 15°, which agrees well with 13° determined by the Opella group [9]. Interestingly, the fluctuations of individual backbone torsion angles of VpuTM are smaller than those of M2TMP probably due to a larger number of SSNMR observables used in VpuTM than M2TMP (see SI Fig. S6 for vacuum and S7 for GBSW).
By using our simulation protocol for oligomer structure determination, we obtained 58 tetramers and 27 pentamers in vacuum, and 95 tetramers and 101 pentamers in GBSW model membrane. The distribution of averaged energies as a function of crossing angle is shown in Figs. 5a (tetramer) and 5b (pentamer). While M2TMP tetramers are classified into two conformations (left- and right-handed), VpuTM oligomers are categorized into three conformations: left-handed (Ω > 15°), right-handed (Ω < −7.5°), and parallel (−7.5° ≤ Ω ≤ 15°), where Ω is the crossing angle between two neighboring helices. The structural analyses of these conformations are summarized in Table 3 (vacuum) and Table 4 (GBSW). The parallel structures are energetically unfavorable for both tetramer and pentamer, as shown in Figs. 5a and 5b. The left-handed conformations in tetramer and pentamer are energetically more favorable than the right-handed conformation in both vacuum and GBSW, although the energy difference is small. In the left-handed conformation, Trp22 is located inside the pore and Ser23 outside the pore. Figure 6 shows three pentameric conformations obtained in GBSW.
Figure 5.
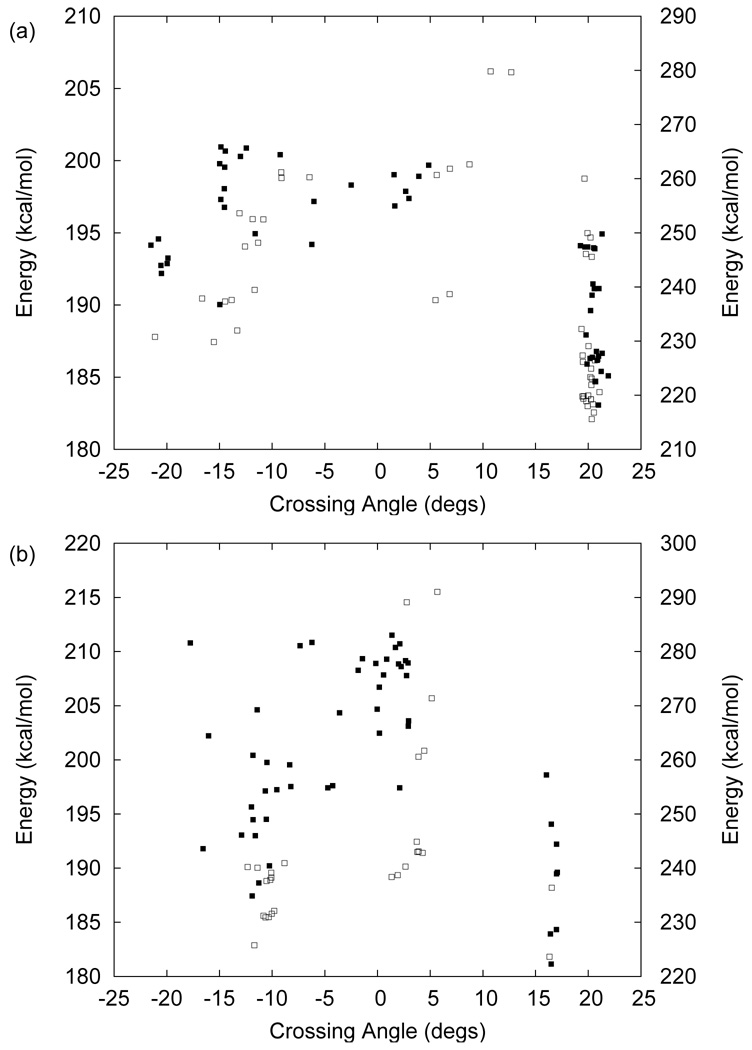
Distributions of helix-helix crossing angles and potential energies of VpuTM (a) tetramer and (b) pentamer structures in vacuum (empty squares, right Y -axis) and GBSW (filled squares, left Y -axis). Only first 50 low energy structures (27 pentamer structures in vacuum) are shown for clarity.
Figure 6.
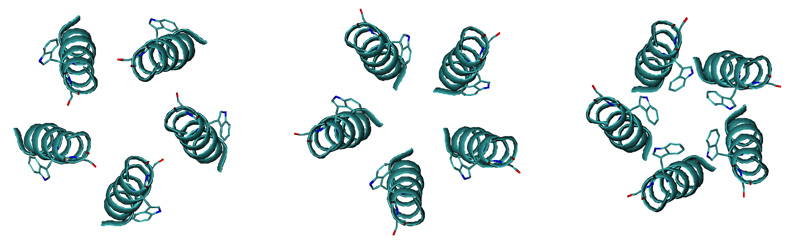
Three conformations of VpuTM pentamers with the lowest potential energy in right-handed, parallel, and left-handed structures (from left to right) in GBSW. The helices are shown in cyan, and Trp22 and Ser23 residues are shown in stick models.
Based on rigid-body assembly calculations with the AMBER potential, the Opella group proposed that both oligomers (tetramer and pentamer) have the strong preference of being the right-handed conformation due to energetically unfavorable clashes of the large Trp22 sidechains inside the pore in the left-handed conformation [9]. They also argued that the resulting pore lining of Ile17 in the right-handed conformation can be supported by the fact that the highly conserved Ile17 may have an essential role in its ion channel activity. However, modeling based on the experimental data from site-directed Fourier transform infrared dichroism supports the left-handed pentamer conformation and reveals a pore occluded by Trp residues at the end of the TM domain [50]. Our assembly calculations with flexible sidechains show that the left-handed pentamer conformation can have a slightly lower energy structure than the right-handed conformation without clashes of the Trp22 sidechains inside the pore. Clearly, further experimental measurements are required to resolve this discrepancy.
Conclusions
We have formulated and implemented SSNMR restraint potentials for 15N chemical shift and 15N-1H dipolar coupling. A series of assessments shows that the calculated restraint forces are numerically accurate and stable. The simulation stability depends on restraint force constants as well as the simulation protocol. Combined with constant temperature TAMD simulations, we have also developed a simple SSNMR structure determination protocol with these restraint potentials. The protocol consists of (1) generating an ideal α-helix (or helices), (2) performing several steps of TAMD simulations with increasing force constants, and (3) selecting structures that satisfy certain criteria such as RMSD between calculated and target SSNMR observables, i.e., δσ ≤ 1.0 ppm and δν ≤ 1.0 kHz. Its efficacy in determining the relative orientations of TM helices with respect to membrane bilayers has been illustrated by previously characterized four membrane proteins: (1) fd coat protein from fd filamentous bacteriophage, (2) MerF from bacterial mercury detoxification system, (3) M2TMP from Influenza A virus, and (4) Vpu TM domain from HIV-1. For M2TMP and VpuTM, we further demonstrated that the restraint potentials can be combined with the IMAGE facility in CHARMM to model corresponding homo-oligomer structures: tetramer for M2TMP, and tetramer and pentamer for VpuTM.
The structures determined by our protocol are characterized by tilt and rotational angles of the TM helices and show overall good agreement with the published structures determined using the existing MC approach. Here, we briefly summarize the main findings from our structure calculations. In the case of fd coat, when the determined structures were clustered, we found less geometric ambiguities in the relative orientation between the IP and TM helices despite the degeneracy inherent in orientational restraints. This might be attributed to the potential energy function which favors closer interactions between the IP and TM helices. The determined MerF monomer structures show structural degeneracy in the relative orientation between two TM helices, although the tilt and rotational angles of individual TM helices are consistent with previously determined structures. Additional restraints from more spectroscopic measurements appear to be necessary to resolve the degeneracies. Identifying proper monomer structures greatly reduces the conformation space needed to be searched for corresponding oligomer structures. By clustering the determined oligomers based on total potential energies and crossing angles, we found that the M2TMP tetramer has strong preference of being left-handed, placing Ser31, His37, and Trp41 in the pore region, which is in good agreement with the previously determined structure [14, 42] and the recent X-ray structure [6]. However, based on the χ2 distributions of His37 and Trp41, four different conformations were identified. Further studies are needed to identify the most probable conformation or energetic difference in four conformations. Although the oligomer structure of VpuTM has not been determined yet at the atomic level, we proposed that the favorable conformations of the VpuTM tetramer and pentamer are left-handed structures. This is consistent with the Fourier transform infrared dichroism experiment, but is at odds with the structure previously proposed based on rigid-body conformational searches using available SSNMR observables and the AMBER force field. Additional restraints from other spectroscopic measurements may help to resolve the discrepancy.
Finally, we also examined the influence of incorporating solvation effects in our structural calculation. The results show that the number of structures satisfying the selection criteria is generally larger in structure calculations with the GBSW implicit membrane model than in vacuum. This indicates that structure calculations with implicit solvent models might be useful in structure determination and modeling of membrane proteins with a limited number of available experimental observables. Further computational experiments with advanced sampling techniques such as the replica exchange method [33, 34] might provide better insights on how these techniques can be combined to yield biological useful models using limited number of orientational restraints.
Supplementary Material
Acknowledgment
We are grateful to Anna A. De Angelis and Sang Ho Park in the Opella group for sharing the SSNMR observables of MerF. The computational resources for this work were supported by ITTC at the University of Kanas. This work was supported by grant number P20RR016475 from the NCRR, a component of NIH, (to JC), the NIH (P41RR012255) and the Center for Multiscale Modeling Tools for Structural Biology (to CLB), and institutional funding from the University of Kansas and the Alfred P. Sloan Foundation (to WI).
Footnotes
Publisher's Disclaimer: This is a PDF file of an unedited manuscript that has been accepted for publication. As a service to our customers we are providing this early version of the manuscript. The manuscript will undergo copyediting, typesetting, and review of the resulting proof before it is published in its final citable form. Please note that during the production process errors may be discovered which could affect the content, and all legal disclaimers that apply to the journal pertain.
References
- 1.White SH, Wimley WC. Membrane protein folding and stability: Physical principles. Annu. Rev. Biophys. Biomol. Struct. 1999;28:319–365. doi: 10.1146/annurev.biophys.28.1.319. [DOI] [PubMed] [Google Scholar]
- 2.Drews J. Drug discovery: A historical perspective. Science. 2000;287:1960–1964. doi: 10.1126/science.287.5460.1960. [DOI] [PubMed] [Google Scholar]
- 3.Zheng CJ, Han LY, Yap CW, Ji ZL, Cao ZW, Chen YZ. Therapeutic targets: Progress of their exploration and investigation of their characteristics. Pharm. Rev. 2006;58:259–279. doi: 10.1124/pr.58.2.4. [DOI] [PubMed] [Google Scholar]
- 4.Singh SK, Yamashita A, Gouaux E. Antidepressant binding site in a bacterial homologue of neurotransmitter transporters. Nature. 2007;448:952–956. doi: 10.1038/nature06038. [DOI] [PubMed] [Google Scholar]
- 5.Pautsch A, Schulz GE. Structure of the outer membrane protein A transmembrane domain. Nat. Struct. Biol. 1998;5:1013–1017. doi: 10.1038/2983. [DOI] [PubMed] [Google Scholar]
- 6.Stouffer AL, Acharya R, Salom D, Levine AS, Costanzo LD, Soto CS, Tereshko V, Nanda V, Stayrook S, DeGrado WF. Structural basis for the function and inhibition of an influenza virus proton channel. Nature. 2008;451:596–599. doi: 10.1038/nature06528. [DOI] [PMC free article] [PubMed] [Google Scholar]
- 7.Kovacs FA, Cross TA. Transmembrane four-helix bundle of influenza A M2 protein channel: Structural implications from helix tilt and orientation. Biophys. J. 1997;73:2511–2517. doi: 10.1016/S0006-3495(97)78279-1. [DOI] [PMC free article] [PubMed] [Google Scholar]
- 8.Traaseth NJ, Verardi R, Torgersen KD, Karim CB, Thomas DD, Veglia G. Spectroscopic validation of the pentameric structure of phospholamban. Proc. Natl. Acad. Sci. USA. 2007;104:14676–14681. doi: 10.1073/pnas.0701016104. [DOI] [PMC free article] [PubMed] [Google Scholar]
- 9.Park SH, Mrse AA, Nevzorov AA, Mesleh MF, Oblatt-Montal M, Montal M, Opella SJ. Three-dimensional structure of the channel-forming trans-membrane domain of virus protein u (vpu) from hiv-1. J. Mol. Biol. 2003;333:409–424. doi: 10.1016/j.jmb.2003.08.048. [DOI] [PubMed] [Google Scholar]
- 10.Bertram R, Quine JR, Chapman MS, Cross TA. Atomic refinement using orientational restraints from solid-state NMR. J. Magn. Reson. 2000;147:9–16. doi: 10.1006/jmre.2000.2193. [DOI] [PubMed] [Google Scholar]
- 11.Brooks BR, Bruccoleri RE, Olafson BD, States DJ, Swaminathan S, Karplus M. CHARMM: A program for macromolecular energy minimization and dynamics calculations. J. Comput. Chem. 1983;4:187–217. [Google Scholar]
- 12.Marassi FM, Opella SJ. Simultaneous assignment and structure determination of a membrane protein from NMR orientational restraints. Protein Sci. 2003;12:403–411. doi: 10.1110/ps.0211503. [DOI] [PMC free article] [PubMed] [Google Scholar]
- 13.Angelis AAD, Howell SC, Nevzorov AA, Opella SJ. Structure determination of a membrane protein with two trans-membrane helices in aligned phospholipid bicelles by solid-state NMR spectroscopy. J. Am. Chem. Soc. 2006;128:12256–12267. doi: 10.1021/ja063640w. [DOI] [PMC free article] [PubMed] [Google Scholar]
- 14.Nishimura K, Kim S, Zhang L, Cross TA. The closed state of a H+ channel helical bundle combining precise orientational and distance restraints from solid-state NMR. Biochemistry. 2002;41:13170–13177. doi: 10.1021/bi0262799. [DOI] [PubMed] [Google Scholar]
- 15.Bertram R, Asbury T, Fabiola F, Quine JR, Cross TA, Chapman MS. Atomic refinement with correlated solid-state NMR restraints. J. Magn. Reson. 2003;163:300–309. doi: 10.1016/s1090-7807(03)00147-2. [DOI] [PubMed] [Google Scholar]
- 16.Tycko R, Opella SJ. High-resolution 14N overtone spectroscopy: An approach to natural abundance nitrogen NMR of oriented and polycrystalline systems. J. Am. Chem. Soc. 1986;108:3531–3532. [Google Scholar]
- 17.Woolf TB, Malkin VG, Malkina OL, Salahub DR, Roux B. The backbone 15N chemical shift tensor of the gramicidin channel. A molecular dynamics and density functional study. Chem. Phys. Lett. 1995;239:186–194. [Google Scholar]
- 18.Tycko R, Stewart PL, Opella SJ. Peptide plane orientations determined by fundamental and overtone 14N NMR. J . Am. Chem. Soc. 1986;108:5419–5425. [Google Scholar]
- 19.Chen J, Im W, Brooks CL., III Application of torsion angle molecular dynamics for efficient sampling of protein conformations. J. Comput. Chem. 2005;26:1565–1578. doi: 10.1002/jcc.20293. [DOI] [PubMed] [Google Scholar]
- 20.Lee J, Im W. Implementation and application of helix-helix distance and crossing angle restraint potentials. J. Comput. Chem. 2007;28:669–680. doi: 10.1002/jcc.20614. [DOI] [PubMed] [Google Scholar]
- 21.Kim S, Quine JR, Cross TA. Complete cross-validation and R-factor calculation of a solid-state NMR derived structure. J. Am. Chem. Soc. 2001;123:7292–7298. doi: 10.1021/ja003380x. [DOI] [PubMed] [Google Scholar]
- 22.Wang J, Kim S, Kovacs F, Cross TA. Structure of the transmembrane region of the M2 protein H+ channel. Protein Sci. 2001;10:2241–2250. doi: 10.1110/ps.17901. [DOI] [PMC free article] [PubMed] [Google Scholar]
- 23.Kim S, Cross TA. Uniformity, ideality, and hydrogen bonds in transmembrane α-helices. Biophys. J. 2002;83:2084–2095. doi: 10.1016/S0006-3495(02)73969-6. [DOI] [PMC free article] [PubMed] [Google Scholar]
- 24.Bu L, Im W, Brooks CL., III Membrane assembly of simple helix homo-oligomers studied via molecular dynamics simulations. Biophys. J. 2007;92:854–863. doi: 10.1529/biophysj.106.095216. [DOI] [PMC free article] [PubMed] [Google Scholar]
- 25.Chothia C, Levitt M, Richardson D. Helix to helix packing in proteins. J. Mol. Biol. 1981;145:215–250. doi: 10.1016/0022-2836(81)90341-7. [DOI] [PubMed] [Google Scholar]
- 26.Im W, Lee MS, Brooks CL., III Generalized Born model with a simple smoothing function. J. Comput. Chem. 2003;24:1691–1702. doi: 10.1002/jcc.10321. [DOI] [PubMed] [Google Scholar]
- 27.Im W, Feig M, Brooks CL., III An implicit membrane generalized Born theory for the study of structure, stability, and interactions of membrane proteins. Biophys. J. 2003;85:2900–2918. doi: 10.1016/S0006-3495(03)74712-2. [DOI] [PMC free article] [PubMed] [Google Scholar]
- 28.MacKerell AD, Jr, Bashford D, Bellot M, Dunbrack RL, Evanseck JD, Field MJ, Fischer S, Gao J, Guo H, Ha S, Joseph-McCarthy D, Kuchnir L, Kuczera K, Lau FTK, Mattos C, Michnick S, Ngo T, Nguyen DT, Prodhom B, Reiher WE, III, Roux B, Schlenkrich M, Smith J, Stote R, Straub J, Watanabe M, Wiorkiewicz-Kuczera J, Karplus M. All-atom empirical potential for molecular modeling and dynamics studies of proteins. J. Phys. Chem. B. 1998;102:3586–3616. doi: 10.1021/jp973084f. [DOI] [PubMed] [Google Scholar]
- 29.MacKerell AD, Jr, Feig M, Brooks CL., III Extending the treatment of backbone energetics in protein force fields: Limitations of gas-phase quantum mechanics in reproducing protein conformational distributions in molecular dynamics simulations. J. Comput. Chem. 2004;25:1400–1415. doi: 10.1002/jcc.20065. [DOI] [PubMed] [Google Scholar]
- 30.Berendsen HJC, Postma JPM, van Gunsteren WF, DiNola A, Haak JR. Molecular dynamics with coupling to an external bath. J. Chem. Phys. 1984;81:3684–3690. [Google Scholar]
- 31.Almeida FCL, Opella SJ. Fd coat protein structure in membrane environments: Structural dynamics of the loop between the hydrophobic trans-membrane helix and the amphipathic in-plane helix. J. Mol. Biol. 1997;270:481–495. doi: 10.1006/jmbi.1997.1114. [DOI] [PubMed] [Google Scholar]
- 32.Lovell SC, Davis IW, Arendall WB, III, de Bakker PIW, Word JM, Prisant MG, Richardson JS, Richardson DC. Structure validation by Cα geometry: ϕ ψ and Cβ deviation. Proteins. 2003;50:437–450. doi: 10.1002/prot.10286. [DOI] [PubMed] [Google Scholar]
- 33.Sugita Y, Okamoto Y. Replica-exchange molecular dynamics method for protein folding. Chem. Phys. Lett. 1999;314:141–151. [Google Scholar]
- 34.Chen J, Im W, Brooks CL., III Refinement of NMR structures using implicit solvent and advanced sampling techniques. J. Am. Chem. Soc. 2004;126:16038–16047. doi: 10.1021/ja047624f. [DOI] [PubMed] [Google Scholar]
- 35.Wang C, Lamb RA, Pinto LH. Activation of the M2 ion channel of influenza virus: A role for the transmembrane domain histidine residue. Biophys. J. 1995;69:1363–1371. doi: 10.1016/S0006-3495(95)80003-2. [DOI] [PMC free article] [PubMed] [Google Scholar]
- 36.Pinto LH, Dieckmann GR, Gandhi CS, Papworth CG, Braman J, Shaughnessy MA, Lear JD, Lamb RA, Degrado WF. A functionally defined model for the M2 proton channel of influenza A virus suggests a mechanism for its ion selectivity. Proc. Natl. Acad. Sci. USA. 1997;94:11301–11306. doi: 10.1073/pnas.94.21.11301. [DOI] [PMC free article] [PubMed] [Google Scholar]
- 37.Kukol A, Adams PD, Rice LM, Brunger AT, Arkin IT. Experimentally based orientational refinement of membrane protein models: A structure for the influenza A M2 H+ channel. J. Mol. Biol. 1999;286:951–962. doi: 10.1006/jmbi.1998.2512. [DOI] [PubMed] [Google Scholar]
- 38.Zhong Q, Husslein T, Moore PB, Newns DM, Pattnaik P, Klein ML. The M2 channel of influenza A virus: A molecular dynamics study. FEBS Letters. 1998;434:265–271. doi: 10.1016/s0014-5793(98)00988-0. [DOI] [PubMed] [Google Scholar]
- 39.Forrest LR, Kukol A, Arkin IT, Tieleman DP, Sansom MSP. Exploring models of the influenza A M2 channel: MD simulations in a phospholipid bilayer. Biophys. J. 2000;78:55–69. doi: 10.1016/s0006-3495(00)76572-6. [DOI] [PMC free article] [PubMed] [Google Scholar]
- 40.Schweighofer KJ, Pohorille A. Computer simulation of ion channel gating: The M2 channel of influenza A virus in a lipid bilayer. Biophys. J. 2000;78:150–163. doi: 10.1016/S0006-3495(00)76581-7. [DOI] [PMC free article] [PubMed] [Google Scholar]
- 41.Kovacs FA, Denny JK, Song Z, Quine JR, Cross TA. Helix tilt of the M2 transmembrane peptide from influenza A virus: An intrinsic property. J. Mol. Biol. 2000;295:117–125. doi: 10.1006/jmbi.1999.3322. [DOI] [PubMed] [Google Scholar]
- 42.Luo W, Mani R, Hong M. Side-chain conformation of the M2 transmembrane peptide proton channel of influenza A virus from 19F solid-state NMR. J. Phys. Chem. B. 2007;111:10825–10832. doi: 10.1021/jp073823k. [DOI] [PubMed] [Google Scholar]
- 43.Wu Y, Voth GA. A computational study of the closed and open states of the influenza A M2 proton channel. Biophys. J. 2005;89:2402–2411. doi: 10.1529/biophysj.105.066647. [DOI] [PMC free article] [PubMed] [Google Scholar]
- 44.Marassi FM, Ma C, Gratkowski H, Straus SK, Strebel K, Oblatt-Montal M, Montal M, Opella SJ. Correlation of the structural and functional domains in the membrane protein Vpu from HIV-1. Proc. Natl. Acad. Sci. USA. 1999;96:14336–14341. doi: 10.1073/pnas.96.25.14336. [DOI] [PMC free article] [PubMed] [Google Scholar]
- 45.Schubert U, Ferrer-Montiel AV, Oblatt-Montal M, Henklein P, Strebel K, Montal M. Identification of an ion channel activity of the Vpu transmembrane domain and its involvement in the regulation of virus release from HIV-1-infected cells. FEBS Lett. 1996;398:12–18. doi: 10.1016/s0014-5793(96)01146-5. [DOI] [PubMed] [Google Scholar]
- 46.Lopez CF, Montal M, Blasie JK, Klein ML, Moore PB. Molecular dynamics investigation of membrane-bound bundles of the channel-forming transmembrane domain of viral protein u from the human immunodeficiency virus HIV-1. Biophys. J. 2002;83:1259–1267. doi: 10.1016/S0006-3495(02)73898-8. [DOI] [PMC free article] [PubMed] [Google Scholar]
- 47.Grice A, Kerr I, Sansom M. Ion channels formed by HIV-1 Vpu: A modelling and simulation study. FEBS Lett. 1997;405:299–304. doi: 10.1016/s0014-5793(97)00198-1. [DOI] [PubMed] [Google Scholar]
- 48.Miller RH, Sarver N. HIV accessory proteins as therapeutic targets. Nature Med. 1997;3:389–394. doi: 10.1038/nm0497-389. [DOI] [PubMed] [Google Scholar]
- 49.Park SH, Opella SJ. Tilt angle of a trans-membrane helix is determined by hydrophobic mismatch. J. Mol. Biol. 2005;350:310–318. doi: 10.1016/j.jmb.2005.05.004. [DOI] [PubMed] [Google Scholar]
- 50.Kukol A, Arkin IT. Vpu transmembrane peptide structure obtained by site-specific fourier transform infrared dichroism and global molecular dynamics searching. Biophys. J. 1999;77:1594–1601. doi: 10.1016/S0006-3495(99)77007-4. [DOI] [PMC free article] [PubMed] [Google Scholar]
- 51.Özdirekcan S, Rijkers DTS, Liskamp RMJ, Killian JA. Influence of flanking residues on tilt and rotation angles of transmembrane peptides in lipid bilayers. A solid-state 2H NMR study. Biochemistry. 2005;44:1004–1012. doi: 10.1021/bi0481242. [DOI] [PubMed] [Google Scholar]
Associated Data
This section collects any data citations, data availability statements, or supplementary materials included in this article.